Endpoint Threat Hunting: Proactive Detection on Windows, Linux, and macOS
- Category: CTI
- Source article: https://medium.com/@1200km/endpoint-threat-hunting-proactive-detection-on-windows-linux-and-macos-f892d9b8a113
- Published: 2025-12-14
- Preserved media: 1 image(s), including cover images, screenshots, diagrams, and infographics where present.
- Preserved technical blocks: 6 code/configuration block(s).
Ecosystem Fit
This page mirrors the original Medium article into the 1200km.com Docusaurus ecosystem. The original article flow, images, screenshots, infographics, and technical blocks are preserved from the export.
Uncovering Advanced Compromises Through Telemetry, Artifacts, MITRE ATT&CK Tactics, and Practical Playbooks
Executive Summary
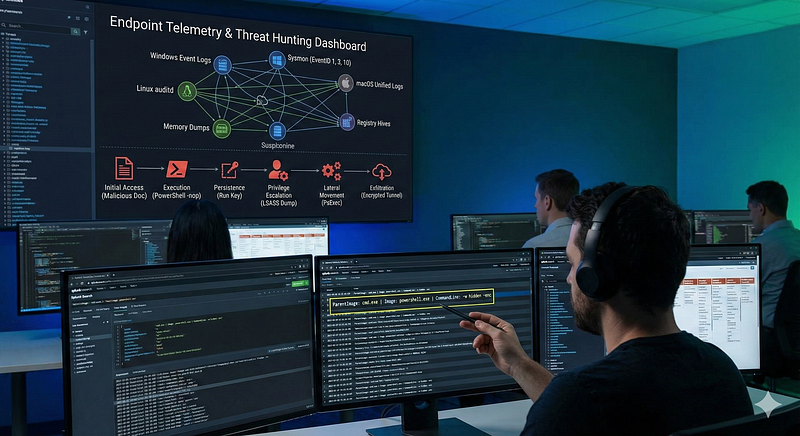
Endpoint threat hunting aims toproactively detect advanced compromiseson Windows, Linux, and macOS hosts before alerts fire. Hunters search for key Indicators of Compromise (IoCs) — such as known malicious file hashes, domains, IPs, unusual process names or registry entries — and anomalous behaviors that evade signature-based defenses.
Common attacker tactics include:
-
Initial access(malicious docs, drive-by downloads, USB-based malware)
-
Execution(abusing scripting engines or living-off-the-land binaries)
-
Persistence(e.g. “Run” registry keys, cron jobs, LaunchDaemons)
-
Privilege escalation
-
Lateral movement(PsExec, SSH)
-
Data exfiltration(encrypted tunnels, strange ZIPs, rare extensions)
To find these, analysts rely on rich telemetry and artifacts: Sysmon and Windows Event Logs, audit/journal logs on Linux/macOS, memory captures, file metadata (MACE times), registry hives, browser/email caches, etc. Capturing detailed endpoint logs is critical — for example,**Sysmon Process Create (EventID 1)**is considered a “workhorse” for seeing every program launch — enabling full visibility into what ran and when. By leveraging this telemetry (logs, registry, memory, filesystem) and cross-referencing known TTPs, threat hunters can spot stealthy compromises that leave subtle traces (e.g. Prefetch/Shimcache entries or unusual Parent‑Child process chains).
Hunting Methodology and Strategies
Threat hunting can behypothesis-driven,IoC-driven, oranomaly-based(behavioral) — often in combination.
A hypothesis-drivenhunt starts with an assumption (e.g.“Attacker may be using PowerShell to bypass detection on critical servers”) informed by recent threat intelligence or ATT&CK mappings. The hunter then searches telemetry (process logs, PowerShell script block logs, etc.) to confirm or refine the hypothesis.
IOC-drivenhunting is reactive: searching for specific artifacts (malicious IPs, domains, file hashes, registry keys) across logs. This is effective for known threats but can miss novel attacks (IoCs age out quickly.
Anomaly- or behavior-basedhunting looks for deviations from the norm — for example, using statistical “stack counting” or baselining to findleast-frequently occurringprocess names or login locations. High-quality baselines and machine-learning analytics help highlight outliers (though care must be taken to reduce false positives).
Throughout, threat intelligence should guide hunts: integrating context (APT profiles, TTPs) into hypotheses and enriching IoCs. Importantly, hunters must focussignal vs. noise: prioritize high-fidelity data sources and iteratively tune telemetry collection. After each hunt, teams should review which logs yielded hits versus noise and adjust data collection accordingly. In practice, this means emphasizing telemetry that produced true positives (e.g. process command-lines, registry changes) and filtering out low-value chatter.
Core Endpoint Data Sources
Windows Endpoints: The Gold Mine of Digital Forensics
In modern incident response, the Windows endpoint is often the primary battlefield. While network logs provide the “where” and “when,” endpoint data provides the “how” and “who.” To reconstruct an attack, investigators must fuse data from three primary pillars:Sysmon/Event Logs,The Registry, andFilesystem Artifacts.
Below is a detailed breakdown of these artifacts and how to interpret them.
1. Sysmon: The Forensic Workhorse
System Monitor (Sysmon) is a Windows system service and device driver that logs system activity to the Windows event log. Unlike standard logs, which are often sparse by default, Sysmon provides granular visibility into process behavior.
Critical Event IDs
-
Event ID 1: Process Create
-
Why it matters:This is the most valuable log source. It details every process launched, including theCommand Linearguments (vital for seeing PowerShell scripts or encoded commands), theParent Process(to detect anomalies like
winword.exespawningpowershell.exe), and theProcess Hash(MD5/SHA256). -
*Investigation Tip:*Look for “Living off the Land” binaries (LOLBins) being used in unexpected ways.
Event ID 3: Network Connection
-
**Why it matters:**Logs TCP/UDP connections created by processes.
-
*Investigation Tip:*Correlate this with Event ID 1. If
notepad.exeis making an outbound connection to an external IP on port 443, that is a high-confidence indicator of compromise (Process Injection).
Event ID 10: Process Access
-
**Why it matters:**This event logs when a process opens a handle to another process.
-
*Investigation Tip:*This is the primary indicator for credential dumping. Tools like Mimikatz must access
lsass.exeto read memory. Look for processes requesting0x1010or0x1400access rights to LSASS.
Event ID 11: File Create
-
**Why it matters:**Logs when a file is created or overwritten.
-
*Investigation Tip:*indispensable for tracking ransomware (mass file creation/renaming) or the dropping of web shells and payloads in the
DownloadsorTempfolders.
Event ID 13: Registry Value Set
-
**Why it matters:**Logs changes to the Registry.
-
*Investigation Tip:*Attackers often modify registry keys to establish persistence or lower security settings (e.g., disabling Windows Defender).
Event ID 17: Pipe Created
-
**Why it matters:**Named pipes are often used for inter-process communication (IPC).
-
*Investigation Tip:*This is critical for detecting lateral movement tools likeCobalt Strike(which often uses default pipe names) or SMB pivoting.
2. Native Windows Event Logs
Even without Sysmon, the standard Windows Security and System logs are vital, particularly for authentication and service tracking.
-
**Security Log (Event ID 4624/4625):**Tracks successful and failed logons. Look for Type 3 (Network) logons for lateral movement or Type 10 (Remote Interactive) for RDP access.
-
**WMI Activity:**Windows Management Instrumentation (WMI) is a favorite tool for attackers to execute code and maintain persistence without touching the disk.
-
Artifact:
Microsoft-Windows-WMI-Activity/Operationallog. -
*Red Flag:*Look for “WMI Event Consumer” events that trigger suspicious scripts.
3. The Registry: Persistence and History
The Windows Registry acts as a database of configuration settings, but for forensics, it is a timeline of user activity and attacker persistence.
Persistence Mechanisms
Attackers need their malware to survive a reboot. The Registry is the most common place to hide these instructions.
-
Run Keys:
HKLM\Software\Microsoft\Windows\CurrentVersion\RunandRunOnce. Any program listed here starts automatically when a user logs on. -
Services:
HKLM\SYSTEM\CurrentControlSet\Services. Malware often installs itself as a service to run with SYSTEM privileges. -
*Red Flag:*Look for random service names or services pointing to executables in
C:\Users\AppDataorC:\Temp.
Forensic Artifacts
-
USB Device History:
-
Location:
HKLM\SYSTEM\CurrentControlSet\Enum\USBSTOR -
**Insight:**This key lists every USB device ever connected to the machine. It is crucial for proving data exfiltration (insider threats) or the initial infection vector (infected USB drive).
-
Office Trust Records:
-
Location:
HKCU\Software\Microsoft\Office\[Version]\[App]\Security\Trusted Locations -
**Insight:**Logs when a user enables macros or trusts a document. This can prove a user opened a malicious phish.
4. Filesystem Execution Artifacts
When a program runs on Windows, it leaves behind “breadcrumbs” to speed up future performance. Forensics experts use these to prove a specific program was executed, even if the program itself has been deleted.
Prefetch (**.pf**)
-
Location:
C:\Windows\Prefetch -
**Function:**Designed to speed up application launch.
-
**Forensic Value:**Contains the executable name, run count, and the timestamp of the last 8 executions.
-
**Insight:**If you suspect an attacker ran
malware.exe, the Prefetch fileMALWARE.EXE-[HASH].pfserves as proof of execution.
Shimcache (Application Compatibility Cache)
-
**Location:**Stored in the Registry at
HKLM\SYSTEM\CurrentControlSet\Control\Session Manager\AppCompatCache. -
**Forensic Value:**Tracks executables to ensure compatibility with older Windows versions.
-
**Insight:**It acts as a “rolling log” of executed files. Crucially, it tracks files even if they have been deleted from the disk, showing the “Last Modified” time of the file (not the execution time).
AmCache
-
Location:
C:\Windows\AppCompat\Programs\Amcache.hve -
**Forensic Value:**A registry hive file that stores deep metadata about executed programs.
-
Insight:Unlike Prefetch, AmCache records theSHA1 hashof the binary. This allows you to identify known malware even if the attacker renamed the file to something benign like
svchost.exe.
5. Scheduled Tasks
-
Location:
C:\Windows\System32\Tasks(XML files) and RegistryTaskCache. -
**Analysis:**Scheduled tasks are a common persistence method. Attackers may create a task that runs a malicious script every day at 3:00 AM or upon system startup.
-
What to look for:
-
Tasks located in the root of the Tasks folder (legitimate Windows tasks are usually in subfolders).
-
Tasks executing encoded PowerShell commands.
-
Tasks with “System” privileges but targeting user-writable directories.
Linux & macOS: Server Rooms and Developer Workstations
While Windows dominates the corporate desktop, Linux rules the server room and macOS is the standard for developers and executives. Forensics on these platforms requires a different mindset: file-based configurations are king, and “everything is a file” — even processes and network connections.
Below is a detailed breakdown of the critical artifacts for *nix-based systems and how to interpret them.
1. Linux Endpoints: The Server Backbone
Linux forensics often revolves around web servers, databases, and SSH access. Because Linux environments rely heavily on command-line interfaces (CLI), user activity logs are often the “smoking gun.”
Key Log Sources
-
Authentication Logs (
**/var/log/auth.log**or**/var/log/secure**): -
**What they are:**The primary record of authentication attempts (SSH, sudo, su).
-
**Investigation Tip:**Look for “Accepted publickey” (successful SSH) followed by
sudocommands. High volumes of "Failed password" indicate brute-force attempts. -
Auditd (The Linux “Sysmon”):
-
**Why it matters:**If the
auditddaemon is running, it provides kernel-level visibility far superior to standard logs. -
**Critical Events:**It tracks syscalls. You can configure it to watch specific files (like
/etc/passwd) or execution (execve). -
Artifact:
ausearchis the tool used to queryaudit.log. Look fortype=EXECVEto see every command executed, arguments included. -
Journalctl:
-
On
systemd-based distributions (most modern Linux), logs are binary and centralized. Usejournalctl -xeto view recent system events, service crashes, or startup errors.
Shell History: The Attacker’s Diary
-
Files:
~/.bash_history,~/.zsh_history. -
**Forensic Value:**Attackers often forget to unset their history file variables. These files can contain a literal script of the attack:
wget malicious_tool,tar -xvf, and./exploit. -
**Anti-Forensics:**Attackers may run
history -c(clear) or prefix commands with a space (which prevents logging in default configs). If.bash_historyis empty or sent to/dev/null, treat it as a high-confidence indicator of compromise.
Persistence Mechanisms
-
Cron Jobs:
-
Locations:
/etc/crontab,/var/spool/cron/crontabs/(user specific),/etc/cron.daily/. -
**Red Flag:**Look for curl/wget commands running on a schedule, or scripts running out of
/tmpor/var/tmp. -
Systemd Services:
-
Location:
/etc/systemd/system/. -
**Red Flag:**Malicious
.servicefiles created to ensure a reverse shell starts on boot.
2. macOS Endpoints: The Unified Log & Launchd
macOS forensics is a hybrid of Unix roots and proprietary Apple frameworks. The most distinct feature is the shift from text logs to a binary logging database.
The Unified Logging System (ULS)
-
**Access:**Viewed via the
Console.appor the CLI toollog show. -
**Why it matters:**Old-school
/var/log/system.logis mostly deprecated. ULS captures high-volume data from the kernel and applications. -
Investigation Tip:
-
Use predicates to filter the noise:
log show --predicate 'process == "sudo"' --info. -
Look for**TCC (Transparency, Consent, and Control)**prompts. These logs show if an application requested access to the Camera, Mic, or Disk.
Security Artifacts
-
SIP (System Integrity Protection):
-
SIP restricts the root user from modifying protected system locations. Attackers often try to disable this.
-
**Check:**SIP status changes are logged in the NVRAM or recovery logs.
-
Keychain Logs:
-
The Keychain stores passwords and certificates. Access to the keychain files (
~/Library/Keychains/login.keychain-db) or logs indicatingsecurity dump-keychainexecution are critical red flags for credential theft.
Persistence: LaunchAgents & LaunchDaemons
macOS useslaunchdinstead of Cron (though Cron still exists).
-
LaunchAgents (
**~/Library/LaunchAgents****):**Run when a specific user logs in. This is the most common persistence spot for commodity malware targeting users. -
LaunchDaemons (
**/Library/LaunchDaemons****):**Run as root on system boot. Malware here has total control. -
**Investigation Tip:**Inspect the
.plist(Property List) files in these directories. Look for the<ProgramArguments>tag pointing to hidden binaries in user folders.
3. Volatile Data & Live Response (Cross-Platform)
When a system is running, memory (RAM) and active state data offer evidence that disappears upon shutdown.
Process Trees & Parent-Child Relationships
-
Tools:
ps auxf(Linux) orpstree. -
**The Anomaly:**Processes should have logical parents.
-
Normal:
sshdspawnsbash. -
Suspicious:
apache2(web server) spawnsshorbash. This usually indicates aWeb Shell(RCE vulnerability exploit). -
*Suspicious:*A generic process like
calcorflash_updaterunning as root without a parent (orphaned).
Network Connections
-
Tools:
netstat -antup,ss -lntp, orlsof -i. -
What to hunt:
-
ESTABLISHEDconnections to unknown external IPs.
-
Processes listening on high ports (e.g., 4444, 8080) that are not known web services.
-
**Zeek Logs:**If network monitoring is available, Zeek logs provide a historic record of these connections even after the process closes.
Memory Forensics
-
Acquisition:Tools likeLime(Linux) orOsxpmem(macOS) dump the RAM.
-
Analysis (Volatility/Rekall):
-
**Code Injection:**Modern malware “lives” in memory. It might inject a malicious DLL (Windows) or shared object
.so(Linux) into a legitimate process likenginxorsyslog. -
**Rootkits:**Memory analysis is often theonlyway to detect kernel-mode rootkits that hook system calls to hide files from
lsorps. -
**Credentials:**Passwords, SSH keys, and encryption keys can often be scraped in plaintext from a memory dump.
Open Handles
-
Tools:
lsof(List Open Files). -
**Insight:**In *nix, “files” include network sockets and pipes.
-
**Red Flag:**Use
lsof -p [PID]on a suspicious process. You might see it holding open a "deleted" file (a common trick to hide malware execution) or communicating over a hidden pipe.
Filesystem Forensics: The Silent Witness
The filesystem is the ultimate ledger of an operating system. While logs can be cleared and processes can terminate, the filesystem almost always retains scars of malicious activity. In Digital Forensics, we don’t just look atcontent; we analyze themetadata— the “data about the data.”
Below is a detailed breakdown of critical filesystem artifacts, how to interpret timestamps (MACE), and how to uncover hidden threats.
1. The Timeline: MACE / MACB Analysis
Every file on a modern system has a set of timestamps. These are the building blocks of forensic timelines.
The Attributes
-
M — Modified:The last time the file’scontentswere changed.
-
**A — Accessed:**The last time the file was read or executed.
-
*Note:*On modern Windows (Windows 10/11), access time updates are often disabled by default to save performance, making this less reliable unless a specific registry key (
NtfsDisableLastAccessUpdate) is changed. -
C — Created (Windows) / Changed (Linux):
-
*Windows:*When the file was born on that specific volume.
-
*Linux:*Changetime (metadata change). Linux does not traditionally store a “Birth” time in standard ext4, though newer versions (ext4 with 256-byte inodes) and filesystems like APFS (macOS) do support it (often notated as ‘B’ in MACB).
-
E — Entry Modified (MFT Change):The last time the file’smetadata(permissions, name, location) was updated. This is crucial for detecting tampering.
2. Windows Artifacts: NTFS Deep Dive
TheNew Technology File System (NTFS)is a relational database where every file is an entry in theMaster File Table ($MFT).
The Master File Table ($MFT)
The$MFTis the most important forensic artifact on Windows. It tracks every file on the partition.
-
**Resident vs. Non-Resident:**Small files (< ~700 bytes) are stored entirelyinsidethe MFT record (“Resident”). This means even if the file is “deleted” and the cluster is overwritten, the data might still exist in the MFT entry.
-
Timestomping Detection:
-
NTFS stores timestamps in two places within an MFT record:
-
$Standard_Information(SI): Can be easily modified by user-mode tools (like PowerShell). -
$File_Name(FN): Updated by the kernel only when the file name/path changes. -
The Check:If the SI timestamps areearlierthan the FN timestamps (e.g., a malware file claims to be created in 2015, but the FN record says 2024), you have detectedTimestomping.
Alternate Data Streams (ADS)
NTFS allows a file to contain multiple streams of data.
-
**Legitimate Use:**When you download a file, browsers add a
Zone.Identifierstream (Mark of the Web) to flag it as "from the internet." -
**Malicious Use:**Attackers can hide an entire payload inside a text file.
-
Example:
readme.txt:malware.exe. The user sees a 1KB text file, but a 5MB executable is hidden behind it. -
*Detection:*Standard
dirdoesn't show this. Usedir /Ror the Sysinternals toolstreams.exe.
3. Linux & macOS Artifacts: Inodes & Extended Attributes
Linux filesystems (ext4, XFS) and macOS (APFS/HFS+) useInodes(Index Nodes) to store metadata.
Inode Forensics
-
**The Link Count:**An inode tracks how many filenames point to the data.
-
*Investigation Tip:*If a legitimate binary (like
lsorps) has a link count of 0 but the process is still running, the file has been deleted to hide it ("Fileless" execution). -
**Metadata Change (ctime):**In Linux, you cannot easily fake the
ctime(Change time) without kernel-level access or resetting the system clock. If a hacker modifies a file and tries to reset the "Modify" timestamp back to the past, the "Change" timestamp will update to "Now," revealing the cover-up.
Hidden Files & Directories
-
**The Dot (.) Prefix:**Any file starting with
.is hidden by default inls. -
Common Hiding Spots:
~/.ssh/(stealing keys),/dev/shm/(shared memory—files here run in RAM, leaving no disk trace if rebooted). -
**Extended Attributes (xattrs):**Similar to ADS, macOS and Linux use extended attributes. macOS uses
com.apple.quarantineto track downloaded files (similar to Zone.Identifier).
4. Universal Red Flags (The “Staging” Grounds)
Regardless of the OS, attackers tend to use specific locations to stage tools and exfiltrate data.
1. Suspicious Paths
Attackers look for directories that areWorld Writable(anyone can save files there).
-
Windows:
C:\Windows\Temp,C:\Users\[User]\AppData\Local\Temp,C:\ProgramData. -
Linux/macOS:
/tmp,/var/tmp,/dev/shm. -
*Red Flag:*A binary named
svchost.exerunning fromC:\Tempis almost certainly malicious. Legitimate system files run fromSystem32.
2. File Extension Anomalies
-
Double Extensions:
invoice.pdf.exeorbackup.tar.gz.sh. Windows hides known extensions by default, so the user sees "invoice.pdf". -
Rare/Random Extensions:
.dat,.bin,.enc, or random strings (.x8z). Ransomware often renames files with a unique extension during encryption. -
**MIME Type Mismatch:**A file named
image.pngthat actually contains an executable header (MZfor Windows,ELFfor Linux).
3. Entropy Analysis
-
**What it is:**Entropy measures the randomness of data.
-
Forensic Value:
-
**High Entropy:**Indicates packed malware (compressed to hide code) or encrypted data (ransomware or exfiltration archives).
-
**Investigation Tip:**If you find a random file in
AppDatawith very high entropy, it is likely a staging archive or a crypto-miner..
Application Telemetry:
Modern tools generate logs too.
-
**Office macro logs:**Windows Registry “TrustRecords” entries (HKCU…Security\Trusted Documents) show exactly which documents had macros enabled and when.
-
Browser caches and historiesrecord visited URLs, downloads, and cookies — use them to trace web-based attacks or data exfil (especially for drive-by compromises)magnetforensics.com.
-
Email client caches(e.g. Outlook’s OST/PST files) can be parsed to find malicious attachments or phishing sources.
-
On Linux/Unix,
~/.ssh/known_hostsand shell history reveal SSH usage; mail logs (/var/log/mail*) can show large outgoing transfers.
Attack Techniques and IOCs by MITRE ATT&CK Tactic
-
**Initial Access (TA0001):**Phishing with malicious documents (macros in Office files), drive-by downloads exploiting browsers, USB/removable-media infections, or compromised VPNs. IoCs include document hashes, suspicious URLs/IPs, and registry keys from USB historymagnetforensics.com. E.g. a “Invoice.docx” enabling macros (traceable in TrustRecordsisc.sans.edu).
-
**Execution (TA0002):**Command-line abuse (unusual
cmd.exe,bashorpowershell.exearguments), script execution (PowerShell, Bash, Python), or living-off-the-land binaries (LOLBins likerundll32.exe,regsvr32.exe). Look for encoded commands (e.g.-nop -w hidden) or one-off DLL sideloading. -
Persistence (TA0003):Modifying Run keys orWMI Event Subscriptions, creating new cron jobs (Linux), LaunchAgents/Daemons (macOS), or Scheduled Tasks (Windows). Key IOCs include new entries under
HKLM:\Software\Microsoft\Windows\CurrentVersion\Run,/etc/cron.d/, or~/Library/LaunchAgents. -
**Privilege Escalation (TA0004):**Token stealing or impersonation (Mimikatz attacking LSASS), abusing
sudo/su(evidenced in/var/log/auth.log), or Windows UAC bypass scripts. Watch for abnormal service/service DLL registrations or modifications toHKLM\Software\Microsoft\Windows NT\CurrentVersion\Image File Execution Options\*(debugger hijack). -
**Defense Evasion (TA0005):**Techniques to hide presence. For example,parent-child anomalies: a shell process whose parent is an unrelated system process.Timestomping(manipulating file MACE times) — detect by comparing NTFS $FN or USN Journal against Shadow copies or backups. Malicious image loads: loading drivers or DLLs outside system dirs. Clearing logs (Windows Security log clear event ID 1102) is also a red flag.
-
**Credential Access (TA0006):**LSASS process access/dumps (catchable via Sysmon 10), dumped SAM or
/etc/shadowfiles (rare file copies), keyloggers (suspicious global hooks), or stealing cached creds (Windows Credential Manager). IoCs: processes likemimikatz.exe, Procdump dumping LSASS, or files created under/root/or%APPDATA%named afterhashordump. -
**Discovery (TA0007):**Adversaries enumerate network and host info: e.g.
netstat,arp -a,whoami,ipconfig,ps,ls, etc. Detection: look for logs of these commands (PowerShell transcripts, shell history). Windows Event 4663 (file access) spikes or mass enumeration of admin tools. -
**Lateral Movement (TA0008):**SMB/Remote execution (PsExec, Windows Admin Shares — look in Security logs for EventID 5140/5142), RDP, WMI remote calls, or SSH login attempts on Linux. IoCs: log entries showing new SMB connections, domain accounts logging into unfamiliar hosts, or
sshcommands in shell history linking known hosts. -
**Collection & Exfiltration (TA0009):**Data staging and exfil. Indicators include large archives (
.zip,.rar, strange extensions) created on endpoints, unusual clipboard activity (viaclip), or use of uncommon file transfer tools (ftp,curl,scp). Outbound C2 connections (HTTP beacon patterns) often precede exfil. Suspiciously named.zipin user directories or temporary upload scripts in webserver folders are clues.
Detection Playbooks and Queries
- Windows (Sysmon/EDR Queries):Use SIEM queries or Sigma rules to filter Sysmon events. For example, searchEventID 1for known bad processes:
index
=sysmon EventCode=
1
 Image=
"*\\powershell.exe"
 CommandLine=
"*-nop*"
- or look for uncommon parents:
index
=
sysmon
EventCode
=
1

ParentImage
!
=
"*
\\
explorer.exe"

AND
 (
Image
=
"*
\\
cmd.exe"

OR

Image
=
"*
\\
powershell.exe"
)
-
Check**EventID 3 (Network Connect)for connections to rare external IPs, andEventID 10 (Process Access)**where TargetImage endswith
lsass.exe. Sigma rules can encode these searches generically across SIEMs. In Splunk or ELK, alerts might trigger onEventID=11(file creation) for sensitive locations (e.g.C:\Windows\System32\Tasks\evil.xml). -
**Linux/macOS:**Search shell histories and logs. Example:
grep -Ei
"(wget|curl|scp|ftp)"
 /home/*/.bash_history grep -R
"netcat\|ncat\|cryptcat"
 /var/log/ journalctl | grep -i
"Failed password"
- Useauditd/AIDEto detect file changes (e.g., new SUID binaries). Example
osqueryquery:
SELECT

*

FROM
 file
WHERE
 path
LIKE

'/etc/cron.%'

OR
 path
LIKE

'/usr/sbin/cron'
;
- Inspect login records (
last,/var/log/auth.log) for unexpectedsshusage or privilege escalations. Check process parent trees:
ps auxf |
grep
 -i
"ssh\|bash\|cron\|daemon"
-
for odd spawn chains. Look for non-standard binaries (e.g. executables in
/tmpor user home) withfind / -type f -perm -111 -nouser. -
**Suspicious Process Trees:**Example:
rundll32.exelaunching a PowerShell child is unusual. A search for Sysmon Process Create whereParentImage="*\\rundll32.exe"andImage="*\\powershell.exe"would catch that. Similarly, ifexplorer.exeis parent of a shell script on mac (bashparented by a GUI app), that should be flagged. Always inspect chains likeServiceHost → svchost → cmd.exe.
Hunting Tools and Frameworks
-
Commercial EDRs:Solutions likeCrowdStrike Falcon,SentinelOne,Microsoft Defender for Endpoint, andElastic Agentoffer real-time endpoint telemetry (processes, registry, disk, memory) and built-in hunting queries. They often integrate with cloud SIEMs for query-based hunting.
-
Open Source:Tools likeVelociraptor(collect endpoint artifacts via VQL),Osquery(SQL queries against endpoint data),Sysmon(Windows event logging),KAPE(collect forensic artifacts),GRR(IR framework),Plaso(timeline generation), andRekall(memory forensics) are widely used. Velociraptor’s Artifact Exchange provides dozens of ready-made hunts (e.g. Windows.System.PowerShell.ExecutedCommand to find suspicious PowerShell).
-
Memory Analysis:Volatility 3,Redline,DumpIt, andLiMEcan acquire and analyze RAM. Volatility plugins can dump credentials (
hashdump), scan for injected code (Mimikatz signatures), or reconstruct execution (pslist,pstree). -
Log Aggregation:Centralizing logs inXPLG, ELK Stack(Elasticsearch/Kibana),Wazuh, orSplunkallows complex queries. For example, a Splunk query to spot new admin users might be:
index=wineventlog EventCode=4728 OR 4729 | stats count by TargetAccount. Kibana dashboards can plot process execution counts by endpoint.
Practical Hunting Workflow Examples
-
**Detecting Persistence via Registry/Service:**Suppose a new service is spotted (e.g. “AdobeUpdaterService”) running a strange executable.*Step-by-step:*use
Get-Serviceor WMI to find its image path; check the registry underHKLM:\CurrentControlSet\Services\AdobeUpdaterServicefor its EXE location. If odd, search the hostname for that EXE. Next, reviewHKLM:\Software\Microsoft\Windows\CurrentVersion\RunandHKCU:\...\Runto see if the same EXE is listed – it may have created a startup key. Find the process’s parent in Sysmon/Task Manager to ensure it wasn’t launched by a legitimate program. -
**Timeline Reconstruction (Prefetch + Shimcache + MFT):**Assume a suspicious
evil.exewas found. CheckC:\Windows\Prefetch\Evil.EXE-*.pf: the filename encodes last run timemagnetforensics.com. Load it in WinPrefetchView to see execution count and timestamp. In the Registry/System Volume Information, look at Shimcache for the same file pathmagnetforensics.com. Use an MFT parser (e.g. log2timeline) to get precise file creation/modify times. By aligning these times, you can pinpoint whenevil.exeappeared and ran. If it ran on multiple hosts, compare their timelines to map lateral movement. -
**Hunting Credential Theft:**Look for Sysmon EventID 10 where
TargetImageends in\lsass.exe. This indicates a process opened LSASS (often for dumping credentials). Cross-reference theImageandProcessGuidfor those events to find the culprit (e.g.procdump.exeormimikatz.exe). On Linux, check/var/log/auth.logorsudo logfor suddensuorsudousage. Use a memory dump tool to capturelsass.exe(e.g. with ProcDump or Task Manager Dump). Run Volatility’shashdumporlsa_secretson the dump to extract account hashes and secrets. Alert on any process loadingmimilib.dllor callingLSAOpenProcess. -
**Using Velociraptor to Hunt PowerShell/Macros:**Deploy Velociraptor and import the artifact exchange. For example, use the
Windows.System.PowerShell.ExecutedCommandartifact to search all endpoints for suspicious PowerShell. A sample VQL query:
SELECT

*

FROM
 artifact
WHERE
 artifact
=

'Windows.System.PowerShell.ExecutedCommand'

AND
 (cmd_line
LIKE

'%Invoke-Expression%'

OR
 cmd_line
LIKE

'%DownloadString%'
)
This returns hosts where PowerShell was used to download/execute content. Similarly, useWindows.Forensics.ActiveFilesto find newly created.vbsor.ps1in temporary folders, orWindows.EventLogartifacts to search for Office macro block events.
Enrichment, Pivoting, and Automation
Detected IOCs should be enriched and pivoted across data. For example, lookup a suspicious hash onVirusTotalorHybrid Analysisfor known malware family information. From one IOC (say a malicious parent process GUID), pivot to find all events with that GUID, all processes with the same parent or same command line. Look forsame parent processacross multiple hosts,same binary hashin other systems,same user account, orsame outbound IP. Automation scripts are invaluable: e.g. an OSQuery script to regularly dump all autorun registry entries, or a PowerShell script using WMI to list all current scheduled tasks. Build alert rules/dashboards in your SIEM for common patterns — e.g. a recurring Splunk search for “ParentProcessName = powershell.exe AND CommandLine containsInvoke-WebRequest”. When hunts succeed, feed their results intoPlaybooks(SOPs) and continuously refine detection rules.
Further Reading and References
-
MITRE ATT&CK— comprehensive mapping of tactics & techniquesattack.mitre.org.
-
**Threat Hunting Frameworks:**PEAK (Microsoft), OTHF, TaHITI, etc. (See Splunk’s PEAK documentation).
-
**DFIR Guides:**SANS/ForensicFocus/Huntress/Red Canary blogs offer detection playbooks (e.g. Red Canary’s “3 Keys to Threat Hunting”).
-
**GitHub Repos:**SigmaHQ (Sigma rules repository with 3000+ detection rules)github.com;VelociraptorArtifact Exchange (ready-made hunts); forensic scripts on GitHub (e.g. artifact parsers).
-
**Public Datasets:**Volatility memory sample repository (e.g. Volatility Foundation’s GitHub), DFIR.training challenges, Malware traffic/zoo sites for practice.