SpiderFoot Deep Dive: Installation, Scans, and Practical Use Cases

- Category: CTI
- Source article: https://medium.com/@1200km/spiderfoot-deep-dive-installation-scans-and-practical-use-cases-11ea6537ad6f
- Published: 2025-11-23
- Preserved media: 10 image(s), including cover images, screenshots, diagrams, and infographics where present.
- Preserved technical blocks: 4 code/configuration block(s).
Ecosystem Fit
This page mirrors the original Medium article into the 1200km.com Docusaurus ecosystem. The original article flow, images, screenshots, infographics, and technical blocks are preserved from the export.
How to run SpiderFoot, pick the right modules, interpret results, and use it responsibly for threat intelligence and reconnaissance.
TL;DR
SpiderFoot is an open-source OSINT automation tool that collects, correlates, and visualizes information about domains, IPs, emails, and other entities from hundreds of public data sources. Use it to map attack surface, enrich threat intel, or validate exposures — but only on assets you own or are authorized to test.
Introduction
In reconnaissance and threat intelligence, breadth matters. Manually querying dozens of services (WHOIS, DNS, Shodan, paste sites, breach databases) is slow and error-prone. SpiderFoot automates that heavy lifting: it queries many sources in parallel, links related items, and delivers results you can consume as JSON, HTML, or visual graphs.
In this article I’ll walk through:
-
what SpiderFoot is and when to use it
-
how to install and run it (GUI + CLI)
-
recommended modules and scan profiles for common tasks
-
reading and exporting results
-
integration ideas, tips, and ethical/legal considerations
What is SpiderFoot?
SpiderFoot is an OSINT automation framework written in Python. It exposes:
-
a web UI for interactive scanning and graph exploration,
-
a CLI for scripted or automated runs, and
-
a modular engine with ~200 modules (API connectors, search engines, DNS, certificates, breach data, passive DNS, etc.).
It’s opinionated for reconnaissance: feed it a domain, IP, email, or hostname and it will attempt to gather everything it can, then correlate entities (domains → subdomains → IPs → ASNs → certificates → associated emails → paste leaks → …).
When to use SpiderFoot
Use SpiderFoot to:
-
map the external attack surface of an organization (public DNS, cloud misconfigurations, exposed services)
-
enrich IOC investigations with contextual data (who owns a domain, where certs point)
-
find leaked credentials and paste exposures
-
automate reconnaissance for red team and purple team exercises
-
gather intel for digital investigations or incident response
Don’t use it against targets you don’t have permission to test — doing so may be illegal.
Installation
**Kali-linux:**preinstalled, just run it
spiderfoot -l 127.0.0.1:8888
#you can use any free port
Ubuntu:
sudo snap install spiderfoot
spiderfoot -l 127.0.0.1:8888
#you can use any free port
The following works on other modern Linux distributions:
# prerequisites
sudo apt update
sudo apt install -y python3 python3-venv python3-pip git
# clone and install
git
clone
 https://github.com/smicallef/spiderfoot.git
cd
 spiderfoot
python3 -m venv .venv
source
 .venv/bin/activate
pip install -r requirements.txt
# start the web UI, binding to localhost port 5001
python3 sf.py -l 127.0.0.1:8888
#you can use any free port
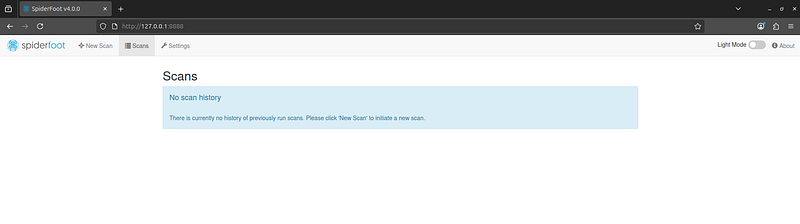
Then openhttp://127.0.0.1:8888in your browser:
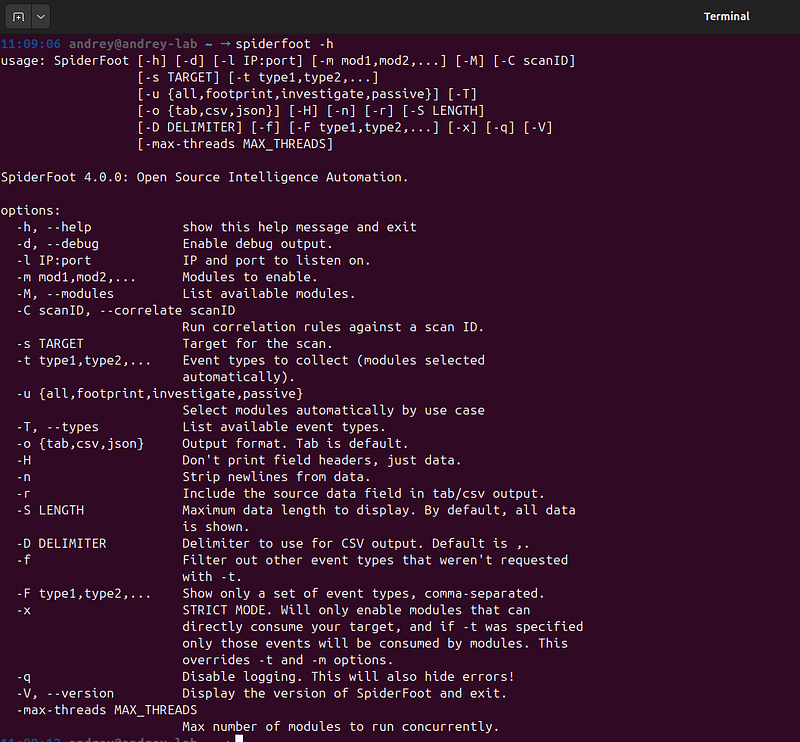
Or use CLI:
spiderfoot -h
Basic Configuration and API Keys
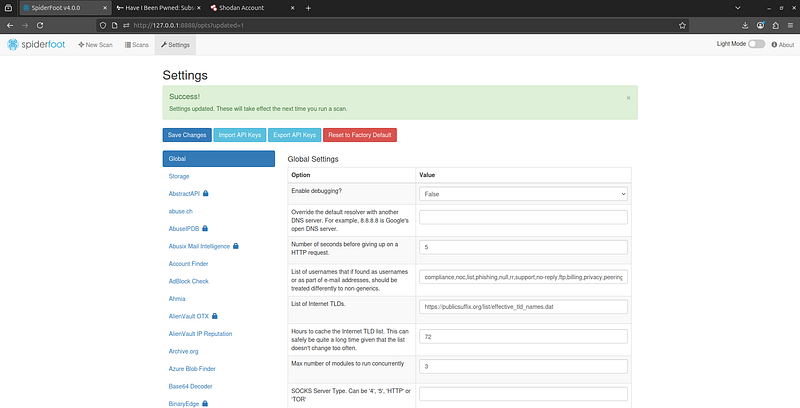
Before running scans, it’s wise to configure SpiderFoot’s settings. The web GUI offers aSettingspage where you can tweak global options (like DNS resolver, request throttling, using Tor for anonymity, etc.). A particularly important setup step isadding API keysfor various OSINT services. SpiderFoot integrates with data sources like Shodan, VirusTotal, HaveIBeenPwned, etc., which often require API keys for full access. By registering for free or commercial API keys and plugging them intoSettings > API Keys, you unlock SpiderFoot modules that query those services (for example, DNS data from SecurityTrails, breach data from HaveIBeenPwned, IP info from Shodan, and more). With API keys added, SpiderFoot can retrievemuch deeper intelligencefrom those sources, greatly enhancing the depth and accuracy of your scan results. It’s worth the few minutes to set these up before a big scan.
Running Scans: Targets, Profiles, and Modules
With installation done, let’s run our first SpiderFoot scan via the web GUI. After starting the web interface, navigate to the**“New Scan”**page (usually the default homepage in the GUI).
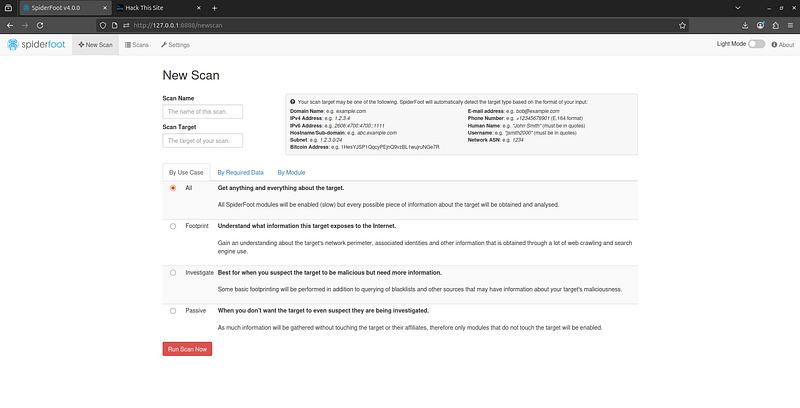
**1. Define the Target:**SpiderFoot can investigate a variety of target types: domains, subdomains, IP addresses, CIDR subnets, ASNs, email addresses, usernames, phone numbers, names, and more. For this tutorial, let’s consider a domain as the target (since that’s common in red team recon). In theNew Scanform, enter the target domain name (or IP, email, etc. as needed).
**2. Choose a Scan Profile:**This is where SpiderFoot really shines by letting you tailor the scan’s scope. A scan profile is basically a preset selection of modules. SpiderFoot comes with several built-in profiles for different use cases:
-
**All:**Runsallmodules for maximum discovery (comprehensive but slow).
-
**Footprint:**Focuses on mapping the target’s public footprint — things like domains, IPs, netblocks, basic whois, etc. This is a broad reconnaissance profile that’s thorough but avoids some of the more aggressive or niche modules.
-
**Investigate:**Includes the footprint modulespluschecks for malicious or sensitive indicators (e.g. known malware associations, blacklists). This is useful if you suspect the target might be malicious or compromised.
-
Passive:Uses only passive modules thatdo not directly touch the target, instead relying on third-party data sources. This means no packets sent to the target — ideal if you need to stay stealthy and avoid showing up in the target’s logs. A passive scan still returns a wealth of information by querying public databases, without alerting the target.
Select the profile that fits your goal. For initial reconnaissance on a domain, theFootprintorInvestigateprofile is a good start (All will take longer, and Passive will miss active information like open ports). You can also create custom profiles, but we’ll stick to these defaults for now.
Configuring a new scan in SpiderFoot’s web GUI. You can enter a target domain or IP and select a scan profile such as “Footprint” or “All” to automatically enable a recommended set of modules. Advanced users can customize exactly which modules to run.
3. Select Modules (Optional):If you prefer granular control, you can manually pick which modules to run. SpiderFoot hasover 200 modulescategorized by function. By default, choosing a profile auto-selects the relevant modules, but you can click on “Modules” or “Module Selection” in the GUI to review or tweak them. Some key module categories (and examples) include:

-
**Network & Infrastructure:**e.g.
sfp_dnsresolve(DNS lookups),sfp_dnsbrute(brute-force subdomain enumeration),sfp_whois(WHOIS info),sfp_ports(open port detection via services like Shodan). These help map the target’s domain-IP-address infrastructure. -
**Social Media & People:**e.g.
sfp_twitter(Twitter mentions),sfp_linkedinorsfp_facebook(profiles related to target). Great for finding employee or organization mentions online. -
**Dark Web & Breaches:**e.g.
sfp_pwned(checks if emails/accounts related to target were in known data breaches) andsfp_darkweb(searches dark web sites/forums for target mentions). These can reveal compromised credentials or sensitive leaks. -
**Email & Contacts:**e.g.
sfp_email(harvest email addresses),sfp_phone(find phone numbers). Useful for gathering potential spear-phishing targets or contact info. -
**Threat Intelligence:**e.g.
sfp_shodan(query Shodan for the target’s IP/domain to find exposed services and known vulnerabilities),sfp_virustotal(check if the target appears in VirusTotal malware or phishing data), and modules for various threat intel databases.
Each module is designed to query a specific source or perform a specific analysis. For most users, the preset profiles will cover your needs, but feel free to enable/disable modules based on scope. For instance, if youonlycare about network footprint and not people, you might disable the social media modules to reduce noise.
4. Run the Scan:Double-check your target and module selection, then hit the“Run Scan”button. SpiderFoot will queue the scan and begin executing all selected modules. You’ll be redirected to theScanspage where you can monitor progress. The interface will show the scan status (running/completed) and how many data “elements” have been found so far.
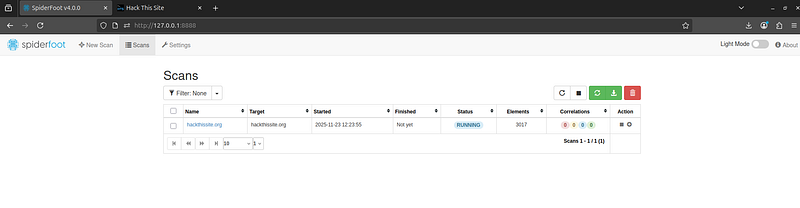
While a scan is running, you can click into it to see live updates. SpiderFoot will show a log of modules executing and the data being collected. Active modules will update in real-time, and SpiderFoot’s engine will automaticallycorrelate findings(i.e. feed output from one module into others). For example, if one module finds a new subdomain, other modules will take that subdomain and run with it (do whois, check leaks, etc.), all within the same scan. This chained, automated discovery is what makes SpiderFoot so powerful — it’s like having a team of research bots crawling through OSINT sources for you.
Depending on how many modules you enabled (and the target’s footprint), scans can take anywhere from a couple of minutes to multiple hours. The “Scan Status” view will indicate when it’s finished. Remember that more modules = more data (but also more time and more API usage).
Interpreting SpiderFoot Results
Once the scan completes, the real work for the red teamer begins:analyzing the findings. SpiderFoot provides several ways to explore the results in the web UI:
- Browse/Raw Data View:
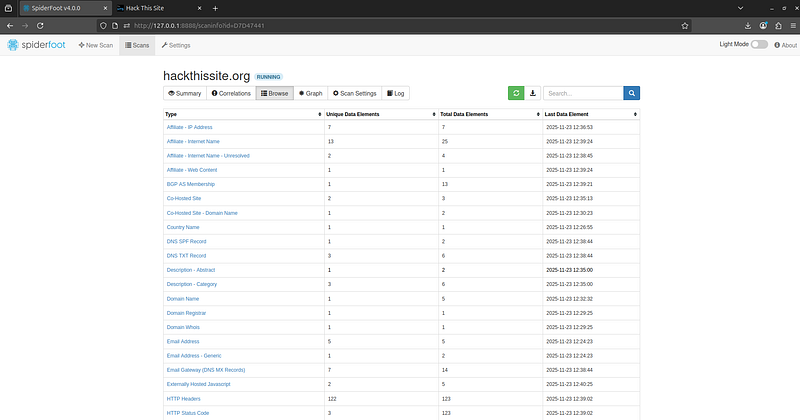
This is a list or tree view of every piece of data SpiderFoot collected. Data is typically organized by type (e.g. all IP addresses found, all email addresses found, all hostnames, etc.). You can click on any item to see which module produced it and any linked entities. There’s also a search box for filtering specific keywords or patterns. The raw data view is useful for a deep dive or exporting specific items.
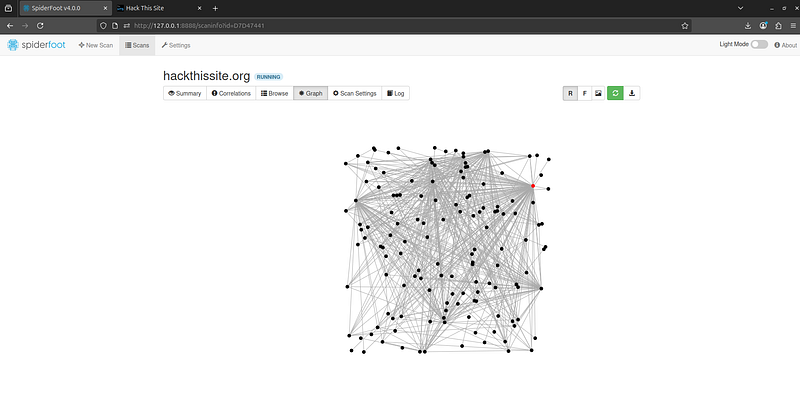
- Graph View:
Use Force Layout:
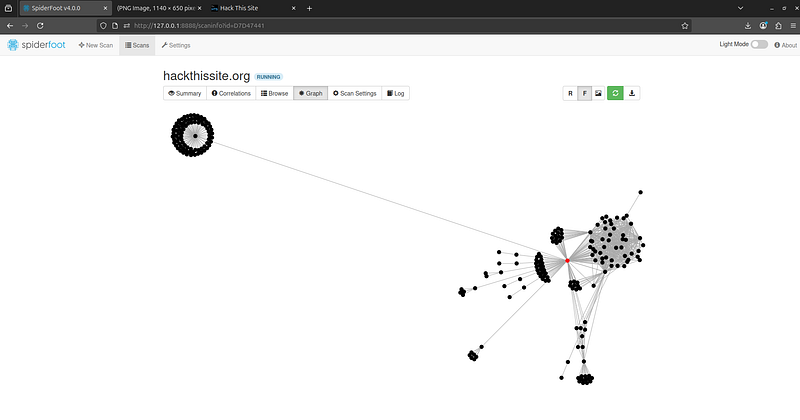
SpiderFoot can generate an interactive graph visualization of the entities and how they are connected. For example, you might see your target domain in the center, with lines connecting out to discovered subdomains, which connect to IP addresses, which connect to other domains, emails, etc. The graph helps you spot relationships (like “this IP is shared by these 3 domains” or “these discovered emails all belong to the same domain”) at a glance. You can zoom, drag, and click nodes on the graph for details.
-
SpiderFoot’s graph view shows relationships among data. Here, domains, IP addresses, and other entities are visualized as a network, helping you identify key connections (e.g. shared infrastructure, linked emails, etc.).
-
Summary Dashboard:The dashboard tab provides a high-level summary of the findings — often highlighting counts of items (e.g. “5 IP addresses, 12 domains, 3 leaks found”) and any red flags. This is a quick way to get the gist of what was uncovered. If SpiderFoot’s built-incorrelation enginehas flagged anything (more on this below), those might show up prominently as well.
-
**Collaboration/Notes:**In SpiderFoot HX (the premium version), there are more features for collaboration and notes. In the open-source version, you might keep notes separately, but you can still mark important items or export for reporting.
Exporting Results:If you want to analyze the data outside the web UI or generate a report, SpiderFoot allows you to export scan results in multiple formats. In the GUI, go to theScanspage, select your scan, and use theExportbutton. You can chooseJSON,CSV,GEXF, or other formats:
-
JSON exportgives the complete structured data, which you can then load into other tools or scripts (great for feeding into custom analysis or combining with data from other sources).
-
CSV exportis convenient for spreadsheet analysis — each line typically represents a finding with columns for type, value, module, etc.
-
GEXF exportis useful if you want to import the graph into Gephi or other graph analysis software to further manipulate or visualize the relationships.
For example, after a scan you could clickExport > JSONand downloadexample.com.jsoncontaining all findings. This could be ingested by a Python script or even a security dashboard (more on that later). Alternatively, from the CLI you can directly output to JSON/CSV by using the-oflag as shown earlier. The ability to export means you’re not locked into SpiderFoot’s interface – the data can be used wherever you need it.
> Note: Large scans can yield hundreds or thousands of data points . Don’t be overwhelmed — use the filtering and search functions. For instance, you might search for the target’s company name to see all entries containing it, or filter by data type (view just “breach credentials” or just “IP addresses”) to focus on what matters for your mission.
Enhancing SpiderFoot with AI for Analysis
SpiderFoot gathers an abundance of OSINT data — so much that analyzing it can feel like drinking from a firehose. This is where integratingAI(Artificial Intelligence), such as large language models or machine learning, can help triage and make sense of the information:
-
**Automated Triage with LLMs:**After exporting SpiderFoot results (e.g., to JSON), you can use a large language model (LLM) like OpenAI ChatGPT or Google Gemini, summarize and prioritize findings. For example, you could write a script that feeds the LLM a prompt like:*“Here is a list of findings (IPs, domains, leaks, etc.) from a SpiderFoot scan. Identify which findings are most likely to represent critical security risks and explain why.”*The LLM can parse the data and highlight things like “an open RDP port was found, which is high-risk” or “several credentials were found in breaches, which could enable account takeover”. This kind of AI-driven summary can save you from manually reading hundreds of lines of output. It’s essentially using AI to do a first-pass analysis, so you focus on what matters.
-
Pattern Recognition and Anomaly Detection:Machine learning can be used to spot patterns in SpiderFoot data that might not be obvious at first glance. For instance, you could cluster discovered subdomains by name similarity to see if there’s a pattern (maybe all the dev systems have a certain naming convention, which could hint at another undiscovered one). Or train a simple model to classify findings by severity (perhaps based on keywords like “breach” or port numbers — though rule-based logic might suffice here too). AI excels at sifting through large data sets to find the signal in the noise. In OSINT, researchers are using AI toautomate data filtering, detect threats, reduce false positives, and provide actionable intelligence. You can apply those same concepts to SpiderFoot outputs: for example, use NLP (Natural Language Processing) on textual data SpiderFoot finds (like pastebin texts or Whois records) to extract key details or sentiments.
-
**LLM-Assisted Reporting:**Another integration point is using an LLM to generate human-friendly reports from SpiderFoot data. After all, as a red teamer you might need to report your recon findings to a client or team lead. Instead of writing it all from scratch, you could feed the raw results to an LLM and ask it to produce a concise summary or even a narrative. For example,*“Summarize the OSINT findings for ACME Corp. into a report, including what was found and potential risks associated with each finding.”*The LLM can draft paragraphs that you can then edit for accuracy. This can accelerate report writing and ensure you don’t overlook mentioning something important.
-
Interactive Queries:Tools likeShellGPT(GPT in the terminal) allow you to interact with your data using plain English. You might load the SpiderFoot JSON into memory and then ask questions like “How many unique email addresses were found and which domains do they belong to?” or “List any servers running Apache and their versions.” The AI will interpret the question and fetch/format the answer from the data. This can serve as a smart filter, especially if you’re less comfortable with writing code or database queries to interrogate the results.
It’s important to note that SpiderFoot itself does not (as of writing) have built-in machine learning modules — its “intelligence” comes from correlation rules and the clever chaining of OSINT sources. Thecorrelation enginein SpiderFoot is somewhat akin to an expert system: it has a YAML-based set of rules (with about 37 predefined rules in the open-source version) that will flag certain conditions, such as*“Potential password found in page text”or“Unencrypted login form detected”*. For example, if SpiderFoot sees a<input type="password">on a page that isn’t HTTPS, it could trigger a correlation rule about an insecure login page. These correlation alerts appear in a separate tab, highlighting issues with a risk rating. Think of correlation rules as SpiderFoot’s built-in “AI” for pinpointing obvious issues so you can focus there first.
By incorporating modern AI, you take this further: the correlation rules flag the low-hanging fruit, and an LLM assistant can comb through everything else to suggest whatitthinks is important. However, always double-check AI-generated conclusions. Use AI as an analyst helper, not an infallible oracle. The quality of AI output depends on the prompt and data given, so ensure you feed it clear, relevant information (and no confidential data unless you’re using a secure, approved AI platform).