Protocol-Level Network Threat Hunting: A Wireshark-Centric Guide
- Category: CTI
- Source article: https://medium.com/@1200km/protocol-level-network-threat-hunting-a-wireshark-centric-guide-a6770ffc96c6
- Published: 2025-12-12
- Preserved media: 12 image(s), including cover images, screenshots, diagrams, and infographics where present.
- Preserved technical blocks: 9 code/configuration block(s).
Ecosystem Fit
This page mirrors the original Medium article into the 1200km.com Docusaurus ecosystem. The original article flow, images, screenshots, infographics, and technical blocks are preserved from the export.
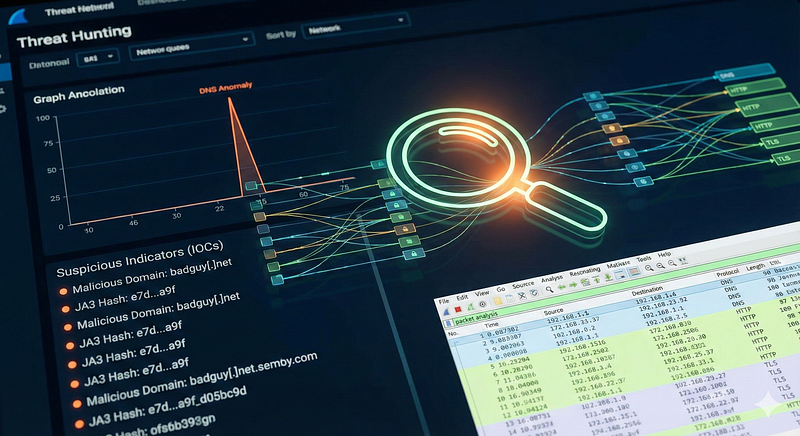
Uncovering Stealthy Attacks Through IOCs, Anomaly Detection, and Practical Playbooks
Executive Summary
Network threat hunting at the protocol level zeroes in on unusual patterns in network traffic rather than just endpoint artifacts. Key network IOCs include malicious domains and IP addresses, TLS fingerprints (JA3/JA3S hashes, certificate thumbprints), anomalous Server Name Indication (SNI) or HTTP headers, odd User-Agent strings, and signs of data exfiltration (e.g. unusually large DNS queries or HTTP POSTs). Protocols often abused in C2 and exfil attacks — DNS, HTTP/HTTPS/TLS, and legacy protocols like NetBIOS/NTP — require focused inspection. Hunters use both signature matches (IOCs) and behavioral analysis: for example, spottingfast-fluxDNS (many answers, low TTL) orDNS tunneling(random, high-entropy subdomains). Anomaly detection (e.g. sudden spikes in NXDOMAINs or ICMP echoes) complements IOC searches. Detailed packet analysis (via Wireshark/tshark) provides “ground truth” of every byte exchanged. In practice, analysts formulate hypotheses (e.g. “malware is exfiltrating via DNS”) and then query packet captures or live feeds for telltale signs, often guided by threat intelligence. This protocol-level visibility is critical because it can reveal stealthy or novel threats that evade higher-level logs and signature-based tools.
Hunting Methodology & Primitives
Threat hunting can behypothesis-driven,IOC (threat-intel)-driven, oranomaly-driven. In hypothesis-driven hunting, analysts define a narrow, testable scenario (e.g. “Adversary with X toolkit might use DNS C2”) and then gather relevant data. IOC-driven hunts start from known indicators (malicious IPs, domains, file hashes) and scan telemetry for matches. Analytics-driven or anomaly hunts rely on statistical or ML models to spot outliers (unusually large traffic flows, strange timing patterns) without specific IOCs. In practice, hunts often combine all three approaches.
The investigative flow typically follows these steps:
**(1)**Formulate hypothesis or gather IOC list;
**(2)**Scope data sources (DNS logs, full-packet captures, NetFlow, etc.);
**(3)**Execute queries/filters (using display filters or scripts) over the data;
**(4)**If suspicious artifacts appear, pivot — e.g. extract related metadata or follow sessions;
**(5)**Validate findings (e.g. corroborate with threat intel, trace back to endpoint). Each hunt iterates: new clues refine the hypothesis or IOC list.
Importantly, hunters use both logs and packets. Logs (DNS query logs, web proxy logs, etc.) offer broad coverage and indexing of known items, but they may miss novel exploits. Full-packet capture (PCAP) is theground truth— unalterable and content-rich. For example, if DNS logs show lots of failed lookups, the hunter might load the PCAP in Wireshark to inspect query contents. Threat intelligence feeds augment this: IOCs from commercial or open sources guide filters (e.g. “block known malicious JA3 hash”), while observed anomalies can be checked against intelligence (e.g. matching a suspicious domain in VirusTotal).
High-fidelity data sources are crucial. Network captures contain everything: payloads, timing, and lower-layer headers. Hunting often alternates between broad search (e.g. filter for “dns.qry.name contains *” to scan query space) and deep dive (e.g. follow a single TCP stream). Each discovery can feed back into tuning detection rules (e.g. adding a new malicious User-Agent to SIEM). This continuous loop of hypothesis → search → discovery → tuning is the essence of proactive hunting.
Network IOC Classes
Network IOCs can be grouped intohost-based vs. network-based, but here we focus on network IOCs. Common classes include:
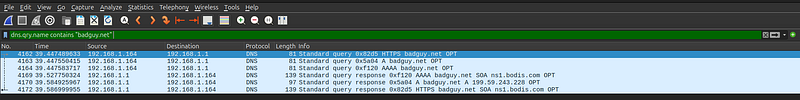
- **IP addresses & Domains:**Malicious/C2 IPs or domains are classic network IOCs. For example, an unusual DNS query for
badguy[.]netflags suspicious activity. Analysts also note subnets or ASNs known for abuse.
dns.qry.name contains "badguy.net"
-
**TLS Fingerprints (JA3/JA3S):**The MD5 hash of a client’s TLS ClientHello (JA3) or ServerHello (JA3S) is a reproducible fingerprint. Many malware/tools use distinct TLS parameters, so a rare JA3 hash is an IOC. Wireshark plugins can display JA3 values for filtering.
-
**SNI and Certificate Anomalies:**The TLS Server Name Indication (SNI) field normally matches the domain. A mismatch (e.g. SNI says
cache.example.combut the HTTP Host is different) can indicate domain fronting or tunneling. Similarly, unusual certificate subjects, issuers, or fingerprints (e.g. self-signed C2 certs) are IOCs. -
**HTTP Attributes:**Suspicious HTTP hostnames, unusual User-Agent strings, or odd headers can signal C2 or exfil. For instance, malware may use a fake User-Agent that never appears in legitimate traffic. Even session cookies or custom header values might reveal an IOC.
-
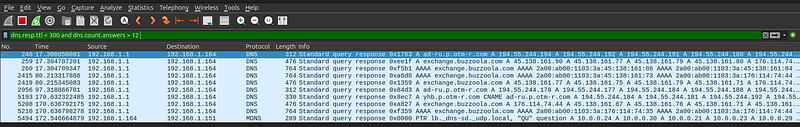
**DNS Query Patterns:**Indicators like many queries for non-existent domains (excessive NXDOMAIN responses), high query entropy, or unusually long subdomains suggest tunneling or DGA use. Also, “fast-flux” behavior (domains resolving to rapidly-changing multiple IPs) is an IOC, detectable by filters like
dns.resp.ttl < 300ordns.count.answers > 12. -
**User-Agents and Application IDs:**Beyond browsers, many tools embed identifiers. Unique or malformed User-Agent strings (e.g.
SouthSide/1.0) used only by malware are IOCs. Similarly, application-level session IDs or cookies can be tracked. -
**MAC and ARP Fields:**At layer 2, IOC examples include unexpected source MAC addresses or gratuitous ARP replies. For example, two hosts claiming the same IP indicates ARP spoofing. Wireshark flags this with “(duplicate use of IP)” and can filter on
arp.duplicate-address-detectedosqa-ask.wireshark.org. -
**Rogue Services:**Unusual DHCP replies (multiple offers or a second DHCP server on the wire) are network IOCs. A second “DHCPOFFER” from a different server MAC is a red flag. Similarly, if an unauthorized device begins responding to DHCPDISCOVER, that MAC or IP can be flagged.
-
**Malformed Packets:**Non-compliant or fragmented packets with invalid fields (like overlapping fragments in a Teardrop attack) are IOCs. Filters like
tcp.flags.reserved != 0or anomalous packet lengths (frame.len > …) can catch protocol abuse or exploitation of parsing bugs. -
**Scanning/Brute Force Patterns:**Excessive connection attempts (e.g. many TCP SYNs to different ports) in a short time are IOCs of reconnaissance. Protocol-specific: a high rate of SSH connection attempts (port 22) or SMB login failures signals brute force; DNS queries with large volume to many subdomains of one domain suggests DGA.
Network IOCs often come enriched with metadata. For instance, an alert in an NDR platform might include the DNS query, the resolved domain, the TLS certificate common name, the JA3/JA3S values, the HTTP host and User-Agent, etc.. In practice, hunting tools and dashboards correlate such fields: e.g.,Stamus NDRhighlights DNS records alongside TLS fingerprints and HTTP attributes. This shows that network IOCs are diverse: domains, IPs, filenames, certificate hashes, protocol fingerprint strings, and even behavioral flags (e.g. “first seen” timestamps for these items). As one NDR vendor notes, investigators often pivot on “first-seen metadata” like domain, certificate, or JA3 hash to find all sessions involving that IOC.
Protocol-Specific Suspicious Behavior and Wireshark Detection Recipes
DNS
- **Fast-Flux Domains:**Look for domains with unusually short TTLs or many A records. Wireshark/tshark filters like
dns.resp.ttl < 300can highlight low-TTL responses. Similarly,dns.count.answers > 12will catch unusually large answer sets (fast-flux pools).
dns.
resp
.
ttl
 <
300
 and dns.
count
.
answers
 >
12
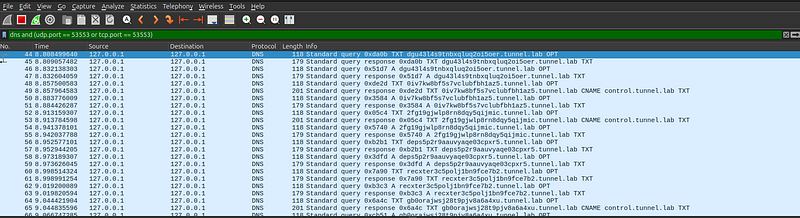
- **DNS Tunneling:**Query patterns often involve very long or random-looking subdomains. A simple display filter is
dns.qry.name.len > 15 and !mdnsto capture long query names (excluding mDNS). Known tunnel domains (e.g. dnscat2, iodine) can be filtered by name: e.g.dns contains "dnscat2". Monitor for clusters of queries to a single unusual domain (e.g. many TXT or CNAME responses from one server).
-
**Exfil Patterns:**Attackers may encode data in DNS (hex/base32). After filtering suspicious queries, one can extract them with Tshark: for example,
tshark -Y "dns" -T fields -e dns.qry.namelists all query names. One might then strip out fixed parts (e.g. suffix domain) and decode the remainder. (SeeHunting Playbookbelow.) -
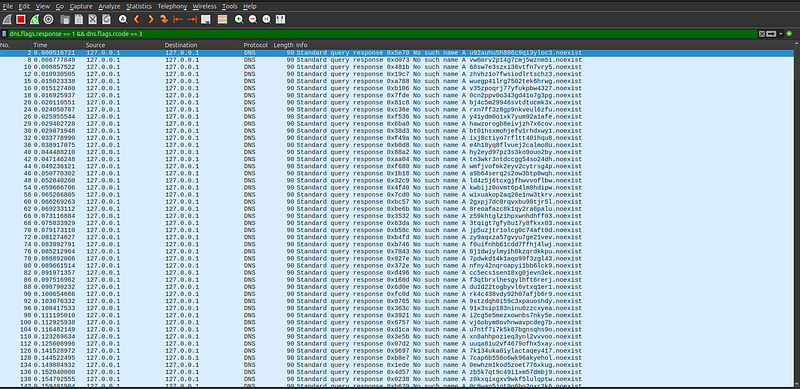
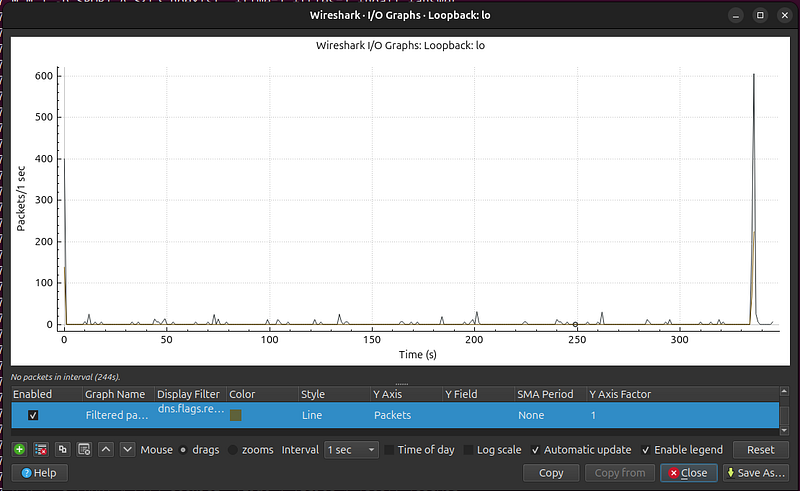
**NXDOMAIN Spikes:**A sudden burst of queries yielding NXDOMAIN (
dns.flags.rcode == 3) often indicates a DGA or misconfigured C2. Plotting DNS response codes (IO Graphs can chart counts of NXDOMAIN over time) can reveal this anomaly.
DHCP
-
**Rogue DHCP:**Filter
bootpto see all DHCP packets (DHCP is implemented as BOOTP). For example,bootp.option.type == 53isolates DHCP messages. Legitimate networks should have one server; if multiple DHCPOFFERs appear from different MACs, that signals a rogue server. -
**Unusual Options:**Check lease times or vendor IDs. Anomalous values (e.g. extremely long leases, or unexpected option codes) can indicate malicious DHCP. For example, Wireshark’s DHCP dissection shows options like lease time or message type; a filter such as
bootp.option.lease_time >= 31536000would catch year-long leases.
ARP
-
**ARP Poisoning/Spoofing:**Look for multiple ARP replies claiming the same IP with different MACs. Wireshark automatically flags “(duplicate use of …)”. Use
arp.duplicate-address-detectedto filter those. Also, a flurry of ARP replies with no preceding request (gratuitous ARP) might indicate a change of MAC-to-IP mapping by an attacker. -
**Gratuitous ARP Anomalies:**A host announcing an IP it doesn’t own or replaying old ARP can be caught by watching for repeated ARP
who-hasfor the same address oris-atwithout solicitation.
ICMP
- **ICMP Tunneling/Data Transfer:**Elevated ICMP payload sizes or unusual types are suspicious. A good heuristic filter is
data.len > 64 and icmp, which catches ICMP packets carrying extra data beyond normal ping. One report on ICMP tunnels found malicious ICMP of 106 bytes vs. normal 64 bytes.
icmp and data.
len
 >
64
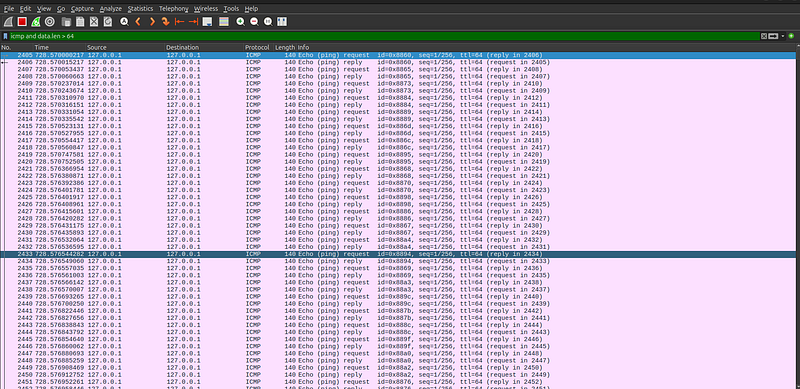
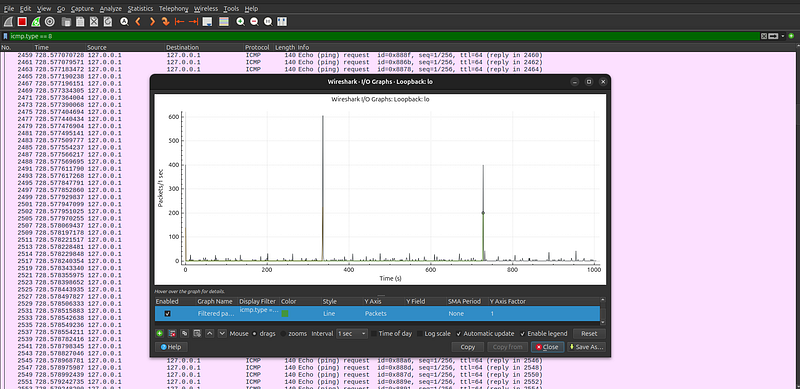
- **Ping Flood:**Excessive ICMP Echo Request (type 8) or Reply floods can be spotted by filtering
icmp.type==8(requests) oricmp.type==0(replies) and counting. In tshark:-Y "icmp.type==8" -z io,stat,0,icmpshows echo rate. Sudden spikes in ping traffic are a red flag.
- **Unreachable Flood:**Many “Destination Unreachable” messages (type 3) from one IP indicate scanning or routing issues. Use
icmp.type==3to filter these and see if a host is sending a torrent of unreachable replies.
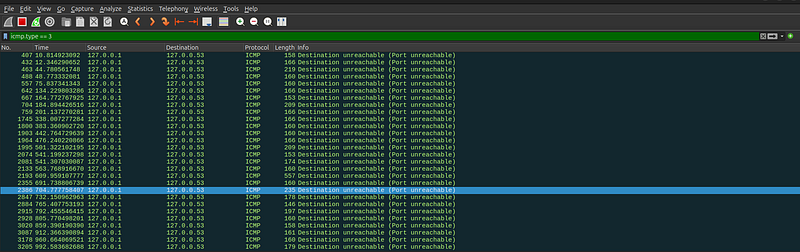
ICMP Type 3 — Destination Unreachable (codes 0–15)
| Code | Short name                                    | Meaning / explanation                                                                                        | Wireshark display filter        |
| ---: | --------------------------------------------- | ------------------------------------------------------------------------------------------------------------ | ------------------------------- |
|    0 |
**net-unreachable**
                           | Destination network unreachable — route to network not available.                                            |
`icmp.type==3 && icmp.code==0`
  |
|    1 |
**host-unreachable**
                          | Destination host unreachable — host cannot be reached (next-hop / routing).                                  |
`icmp.type==3 && icmp.code==1`
  |
|    2 |
**protocol-unreachable**
                      | Protocol on destination host unreachable (no listener for that protocol).                                    |
`icmp.type==3 && icmp.code==2`
  |
|    3 |
**port-unreachable**
                          | Destination port unreachable — typical response to UDP to closed port.                                       |
`icmp.type==3 && icmp.code==3`
  |
|    4 |
**fragmentation-needed**
 (and DF set)         | Fragmentation needed but DF (Don’t Fragment) bit set; includes MTU in some implementations (used for PMTUD). |
`icmp.type==3 && icmp.code==4`
  |
|    5 |
**source-route-failed**
                       | Source route failed — source route specified but next hop couldn't be forwarded.                             |
`icmp.type==3 && icmp.code==5`
  |
|    6 |
**destination-network-unknown**
               | Destination network unknown (deprecated/rare — route info not available).                                    |
`icmp.type==3 && icmp.code==6`
  |
|    7 |
**destination-host-unknown**
                  | Destination host unknown (name-to-address or routing unknown).                                               |
`icmp.type==3 && icmp.code==7`
  |
|    8 |
**source-host-isolated**
                      | Source host isolated — used in some networks to indicate host isolation.                                     |
`icmp.type==3 && icmp.code==8`
  |
|    9 |
**network-prohibited**
                        | Communication with destination network administratively prohibited (ACL/firewall).                           |
`icmp.type==3 && icmp.code==9`
  |
|   10 |
**host-prohibited**
                           | Communication with destination host administratively prohibited.                                             |
`icmp.type==3 && icmp.code==10`
 |
|   11 |
**network-unreachable-for-type-of-service**
   | Network unreachable for specified TOS.                                                                       |
`icmp.type==3 && icmp.code==11`
 |
|   12 |
**host-unreachable-for-type-of-service**
      | Host unreachable for specified TOS.                                                                          |
`icmp.type==3 && icmp.code==12`
 |
|   13 |
**communication-administratively-prohibited**
 | Often shown as “administratively prohibited” — firewall/ACL dropped the traffic. Very common.                |
`icmp.type==3 && icmp.code==13`
 |
|   14 |
**host-precedence-violation**
                 | Host precedence violation (old precedence/TOS control). Rarely used today.                                   |
`icmp.type==3 && icmp.code==14`
 |
|   15 |
**precedence-cutoff-in-effect**
               | Precedence cutoff in effect — traffic denied due to precedence. Rare.                                        |
`icmp.type==3 && icmp.code==15`
 |
Notes:
-
Codes 6–8 exist historically and are rarely seen in modern IP networks; 9–13 are the codes you’ll most commonly encounter for administrative filtering/firewall behavior (13 especially).
-
Code 4 is the canonicalfragmentation needed/ PMTU signal; some devices include the MTU in the ICMP payload (this is used by path MTU discovery). Wireshark may show
needs DFand sometimes show the MTU. -
Wireshark displays human-readable text for codes (e.g., “Destination unreachable (Port unreachable)”) but you can reliably filter with numeric
icmp.codeas shown.
Practical tips for triage / hunting
-
Quick filter foranyDestination Unreachable:
icmp.type == 3 -
Group spikes by code: use tshark/io-stat for
COUNT(icmp.type==3 && icmp.code==13)to see admin-prohibited spikes. -
To pair unreachable messages with the original probe: expand the ICMP packet in Wireshark and open**“Original datagram”**(embedded IP header + first 8 bytes of payload). Use that embedded header to identify which probe generated the unreachable.
-
To detect scanning vs routing problems:
-
If many distinct destination IPs appear in the embedded headers, likely scanning (attacker/probe).
-
If many
code==1orcode==0across many sources, check routing/blackhole issues. -
If many
code==13from firewall IPs, this is administrative blocking — correlate with firewall logs.
HTTP / HTTPS / TLS
-
**User-Agent and URL Anomalies:**Filter unusual or known-malicious User-Agents: e.g.
http.user_agent contains "SouthSide"if you suspect the Raccoon Stealer UA mentioned in reports. Also filter on HTTP methods: finding unexpected methods (http.request.method != "GET" and http.request.method != "POST") can reveal unwanted commands. Check HTTP headers for uncommon fields or values. -
**Host Header vs. SNI:**TLS SNI mismatches are telltales. Use Wireshark’s TLS filters: e.g.
tls.handshake.extensions_server_name == "example.com"to find client hellos for a given domain. Then verify if the subsequent HTTP host/header matches. A domain fronting attempt would show SNI different from HTTP host. -
**JA3/JA3S Matching:**If you have a malicious JA3 hash, filter SSL/TLS handshakes by it. For instance, with the JA3 plugin installed, use
ssl.handshake.ja3 == <hash>to show flows from that fingerprint. Similarly,ssl.handshake.ja3s == <hash>finds server-side JA3S matches. -
**Certificate Checks:**Filter by certificate attributes: e.g.
tls.handshake.certificate == 1combined withtls.handshake.certificate.fingerprint == <bad-fingerprint>(if known). Unusual key lengths or self-signed certs can also be filtered (e.g.tls.handshake.certificate_length > 1024). -
**Large Transfers (Exfil):**Watch for big HTTP uploads or downloads. In Wireshark one can sort by
http.content_lengthor use IO Graphs onframe.len. Large, unexpected binary HTTP payloads can signal data theft.
Other Protocols
-
**SMB:**Frequent SMB negotiation or file access attempts across hosts suggests lateral movement or exploitation. Filter with
smb2or port 445 to spot enumeration (e.g. lots ofTreeConnectrequests). Known tools have specific SMB signatures (e.g. version strings inSMB2 Dialect). -
**FTP:**Brute-force or scanning: look for many
ftp.requestcommands (like multiple USER/PASS pairs) or many 530 login failures (ftp.response.code == 530). -
**SSH:**High rates of connections to port 22, especially with many TCP retransmissions or resets, indicate brute-force. Wireshark can’t parse SSH content easily, but you can filter
tcp.port == 22and look for rapid sequence of SYNs without replies. -
**NetBIOS/SMB-Related:**Rapid NBNS (NetBIOS name service) queries (
nbns) often indicate host enumeration tools. Filternbnsto see names being queried en masse. -
**NTP:**The old NTP MONLIST (mode 7, function 2) is used for reflection attacks. Filter
ntp.mode == 7 && ntp.fn == 2to catch MONLIST queries. Also, watch for traffic to port 123 from many IPs – an NTP amplifier beacon. -
**Malicious DNS/ICMP Hacks:**Some malware uses ICMP or DNS just for traffic; these are covered above. Other protocols (like LDAP, SNMP, etc.) can similarly be abused; any unexpected traffic on rarely-used ports is worth inspecting.
Wireshark Tools, Views and Workflows
Wireshark offers powerful views and filters for hunting:
-
**Display Filters:Master the filter syntax. Simple filters include protocol names (
dns,http,arp,icmp,tlsetc.) or fields (e.g.ip.addr == 10.0.0.5). Use logical operators (and,or,!). For example,frame.len > 1000finds large packets, andtcp.analysis.flagshighlights any TCP errors. The filter"eth.addr == aa:bb:cc:dd:ee:ff"matches a specific MAC, and"http.host == "example.com""**filters HTTP hostnames. For TLS SNI: usetls.handshake.extensions_server_name == "target.com". Filters can be right-clicked from packet details to build them quickly (Apply/Prepare as Filter). -
**Follow Streams:**For TCP/UDP conversations, right-click a packet → “Follow” → “TCP Stream” (or UDP). This reconstructs the entire conversation in one view, useful for examining HTTP sessions or C2 protocols end-to-end. Tshark analog: use
-z follow,tcp,ascii,<stream_index>. -
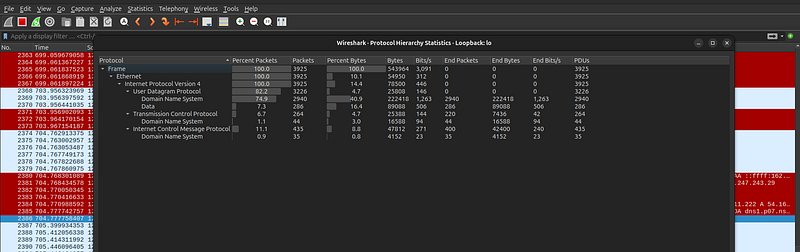
Statistics and Hierarchy:
-
Protocol Hierarchy:(Statistics → Protocol Hierarchy) shows a breakdown of protocols present and their relative byte/packet counts. A sudden appearance of an obscure protocol signals investigation.
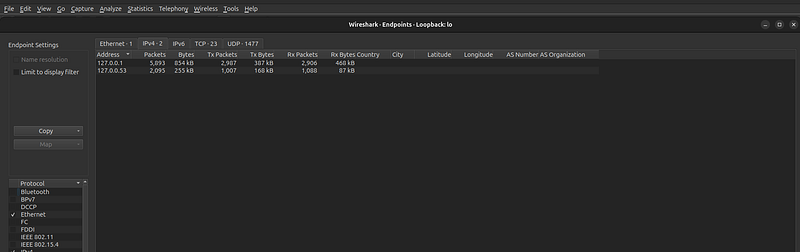
- Endpoints/Conversations:(Statistics → Endpoints or Conversations) lists all IPs/hosts and their traffic volumes or all sessions. You can sort by bytes or packets to find high-volume or unusual peers.
- IO Graphs:(Statistics → I/O Graphs) plots metrics over time. You can graph total packets, bits, or apply a display filter as a series. For example, plotAll Packets(line) vsTCP Errors(dots) orDNS requests(dots). This quickly highlights bursts or anomalies (see figure below).
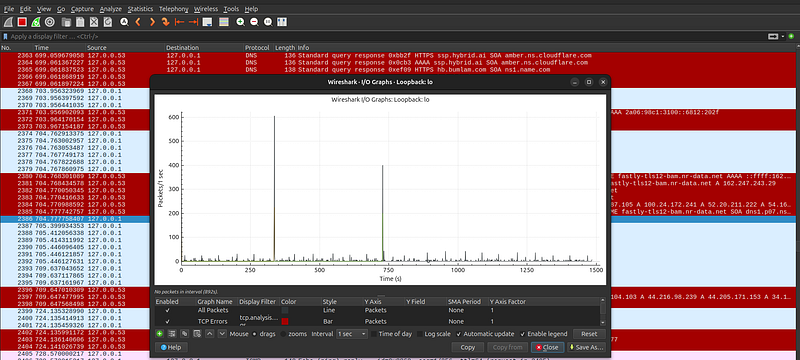
Figure: Wireshark I/O Graph plotting packet rates over time (line) with overlaid events (colored dots). This visual helps spot bursts (spikes) or periodic behavior (e.g. beacon intervals).
-
**Coloring Rules:**Define rules to color packets by filter (View → Coloring Rules). For example, color all DNS answers in blue and HTTP in yellow so they stand out. This makes patterns pop when scrolling through packets.
-
**Marking and Notes:**You can Mark packets of interest (right-click → Mark Packet) and add Comments (to export as a “.xml” with marks). This is useful for flagging suspicious frames for later reference.
-
**Export Objects:**Wireshark can reassemble and export transferred files: useFile → Export Objectsfor HTTP, SMB, etc.. This can recover exfiltrated data from a PCAP.
-
**Decryption:**If you have SSL/TLS keys, you can decrypt HTTPS in Wireshark (Preferences → Protocols → TLS → (Pre)-Master-Secret log) to view plaintext. For Wi-Fi, WPA2 decryption is also supported with the PSK.
-
**Tshark (CLI):**The command-line
tsharkmirrors Wireshark’s capabilities for scripting. Example:
tshark -r capture.pcap -Y
"dns && ip.dst==192.168.157.145"
 \       -T fields -e dns.qry.name > queries.txt
-
This extracts all DNS query names to
queries.txtmedium.com. You can similarly scripttshark -T fieldsto pull fields likehttp.host,tls.handshake.ja3, etc., and save to CSV. Scripting allows batch processing of large PCAPs or integration into toolchains. For instance, one analyst piped the DNS query names throughawk/sedto strip fixed prefixes and decode payload datamedium.commedium.com. -
**Name Resolution:**Turn off name resolution (View → Name Resolution) unless needed; resolving slows analysis. Keep IPs and MACs visible when hunting anomalies.
-
**Automating Filters:**UseManage Display Filtersto save frequently used filters. Export or share sets (e.g. “suspicious-dns”, “large-http”) with teammates.
Automation, Enrichment and Pivoting
Threat hunters often combine Wireshark/tshark with automation tools and enrichment data:
- **Tshark Scripting:**As noted, tshark’s
-Yfilter and-T fieldsoutput allow flexible scripting. For example, one investigator filtered for any packet containing the strings “ping” or “STRRAT” to flag exfil attempts, then output source/dest IPs and ports:
tshark -r file.pcap -Y
'frame
 contains
"ping|STRRAT"
' \        -T fields -e ip.src -e tcp.srcport -e ip.dst -e tcp.dstport
-
This quickly isolated an endpoint talking to 141.98.10.79 on port 12132.
-
IDS/Logs (Zeek, Suricata):Running a PCAP through Zeek or Suricata yields connection logs and alerts. For example, using Zeek on the capture will produce
conn.log(endpoints, byte counts) andhttp.log(URLs, user agents) which can be Grepped. Suricata or Snort rule sets can automatically tag known malware signatures. One analysis ran Snort/Suricata and also theBrim/Zuitool (which applies open-source rules) on the PCAP; the IDS alerts (e.g. “ET MALWARE STRRAT CnC Checking”) confirmed the suspected Trojan. Such tools can be scripted or run in batch to triage large captures. -
**Enrichment:**Every IOC can be enriched with contextual data. For an IP or domain, pull WHOIS, geolocation, passive DNS history, ASN and organization. One report notes how IOC matching engines enhance indicators with passive DNS, WHOIS, ASNs and even sandbox results. For instance, if you find a suspicious C2 domain, your tooling might automatically query ThreatCrowd/Whois and attach metadata to the event. This helps prioritize: a domain tied to known bad actors or an IP in a high-risk ASN is higher priority.
-
**Pivoting:**Use any artifact to find related ones. For example, after identifying a malicious DNS domain, pivot to find all HTTP or TLS sessions to the resolved IP. Wireshark’s filter can be updated (e.g.
ip.addr == X.X.X.X) or add that IP to tshark queries (-Y "ip.addr==X.X.X.X && http"). In practice, tools like ELK or Zeek logs let you search logs by IOC (e.g. “find all records with this JA3 hash”). One NDR platform even offers a “Sightings” feature: input an IOC (domain, cert SHA256, JA3 hash, etc.) and retrieve all first-seen events for it.
Overall, automation and pivoting turn raw packet data into intelligence. A chain of evidence might flow: a rare User-Agent is spotted in Wireshark, fed to a script to find other occurrences in the PCAP (tshark grep), then used to query threat feeds for a malware family, and finally trigger alerts on other logs (SIEM/EDR) containing that agent string.
Hunting Playbook: DNS-Tunnel Exfiltration
**Scenario:**An analyst suspects data exfiltration via DNS tunneling. Network logs show spikes in DNS queries to a certain external domain. The steps below show how to hunt this in Wireshark/tshark:
-
**Isolate DNS Traffic:**Open the full capture in Wireshark and apply the filter
dnsto see only DNS packets. Inspect for unusual patterns: long query names, high frequency to one domain, or many NXDOMAINs. -
**Identify Suspicious Domain:**Suppose the domain
exfil.example.netappears frequently. Verify it: in Wireshark, filterdns.qry.name contains "exfil.example.net". Check the packet list for repeated long subdomains (likea1b2c3d4.exfil.example.net). -
**Extract All Queries:**Use tshark to pull the query names. For example:
tshark -r capture.pcap -Y
'dns
.qry.name contains
"exfil.example.net"
' \        -T fields -e dns.qry.name > queries.txt
-
This writes all queried subdomain strings into
queries.txt. -
**Clean and Decode Data:**Often DNS tunnels encode data into subdomains. If queries have a fixed suffix (
*.exfil.example.net), strip it. For instance:
sed -i
's/.exfil\.example\.net//g'
 queries.txt sed -i
"s/\.//g"
 queries.txt
- (Here we remove the constant domain and all dots). Now each line is raw hex or Base32 from the malware. Convert it to readable form. For hex, one can use
xxdor online tools:
cat
 queries.txt | xxd -r -p > decoded.txt
-
The resulting
decoded.txtcontains the exfiltrated text (usernames, keys, etc.). -
**Validate and Investigate:**Confirm the decoded content (e.g. see if it contains PII or proprietary data). Pivot on the DNS server IPs observed. Use
tshark -r capture.pcap -Y 'dns && ip.dst==5.6.7.8' -T fields -e frame.time -e dns.qry.nameto get timestamps. Check if other protocols to that IP are present (HTTP, ICMP). -
**Report and Block:**Record all IOCs (the domain, resolved IP, any user-agent seen). Add them to blocklists and update detection rules. For example, one might add a signature to flag any future DNS queries matching the subdomain pattern.
Throughout this process, Wireshark’s GUI aids exploration (hover over packets to see full query names, useStatistics → DNSto list top queried names), while tshark or text tools automate extraction. By stepping through these stages, the hunter turns raw capture data into proof of DNS-based exfiltration and captures the exfil contents.
Further Reading and References
-
**SANS & CERT:**SANS courses on Network Forensics (SEC503, FOR572) provide in-depth tactics for packet analysis. CERT advisories (e.g. ICS-CERT bulletins on Mirai) describe network IOCs.
-
**Wireshark Guides:**The official User’s Guide has sections on filters and stats (e.g. [I/O Graphs][67]). Black Hills InfoSec’s Wireshark Cheat Sheet is a handy quick reference.
-
Palo Alto Networks — Unit 42:“DNS Tunneling in the Wild” discusses DNS C2 techniques and defenses.
-
**Stamus Networks Blog:**Practical threat-hunting scenarios and enrichment (see “NDR Forensics” series).
-
**Network Analysis Tutorials:**TheNetwerkLABSWireshark tutorial covers DNS/ICMP anomalies and filters. TheHack The Box“Litter” write-upmedium.comwalks through real DNS tunneling analysis.
-
**IOCs and Indicators:**The Palo Alto Networks [IoC Guide][51] explains different IOC types. GitHub repos like mthcht’s [suspicious-user-agents list][35] and the official [JA3 repository] provide curated IOC data.
-
**Open Datasets/Tools:**Sites like MalwareTrafficAnalysis.net publish tagged PCAP samples and exercises. Tools like Zeek (Corelight docs) and Suricata (Emerging Threats rules) enable large-scale PCAP enrichment.
-
**Blogs and Code:**Security blogs (e.g. extraHop, Zeek blog), and scripts on GitHub (tshark filters, Zeek scripts) are valuable. For example, the Wireshark JA3 plugin and TLS fingerprinting scripts help automate JA3/JA3S extraction.
These resources, along with the techniques above, equip hunters to detect protocol-level compromise. By combining filters, statistical views, and external intelligence, analysts can uncover hidden threats woven into everyday network traffic.