Meet syscheck_beauty: a colorful Linux system report with deep storage insights (and exportable…
- Category: CTI
- Source article: https://medium.com/@1200km/meet-syscheck-beauty-a-colorful-linux-system-report-with-deep-storage-insights-and-exporta-a38329dfe085
- Published: 2025-10-20
- Preserved media: 3 image(s), including cover images, screenshots, diagrams, and infographics where present.
- Preserved technical blocks: 12 code/configuration block(s).
Ecosystem Fit
This page mirrors the original Medium article into the 1200km.com Docusaurus ecosystem. The original article flow, images, screenshots, infographics, and technical blocks are preserved from the export.
Meet syscheck_beauty : a colorful Linux system report with deep storage insights (and exportable HTML)
TL;DR : I built a single-file Python tool that prints a beautiful, color-coded snapshot of your Linux machine — CPU, memory, GPU, disks, filesystems — and can optionally scan for the heaviest directories/files. It also exports a polished, responsive HTML report you can share with teammates or stash in tickets.
Why another system report tool?
Admins and developers jump betweenlscpu,free,df,du,lsblk,nvidia-smi, and friends. That’s fast when you know where to look… until you’re on a different distro, a container, or a laptop with hybrid graphics. I wanted:
-
One commandthat “just works” on most Linux boxes.
-
Readable outputin the terminal with clear colors and progress bars.
-
Adeep storage viewhighlighting space hogs.
-
Ashareable HTML reportthat looks good in docs and tickets.
What it shows
System & OS
-
Vendor/model, motherboard, serials (via
/sys/devices/virtual/dmi/id/*, withdmidecode/lshwfallbacks) -
OS pretty name, version/ID, kernel, architecture
CPU
-
Model, vendor, architecture, physical/logical cores
-
Base/max frequency andlive utilization(if
psutilis available)
Memory
-
Totals, used/free/available, usage percent
-
Swap totals/usage
GPU
-
Vendor/model/driver, bus, VRAM totals;NVIDIA VRAM usagevia
nvidia-smiif present -
Fallback to
lshworlspcion non-NVIDIA systems
Storage: hardware + filesystems
-
Per-disk model, vendor, capacity, transport (NVMe/SATA/USB), block sizes
-
ClassifiesNVMe SSD / SSD / HDD
-
Per-mount capacity &color barsfor usage
-
Optional deep scan (largest directoriesat depth 1 andlargest files) per mount
Quick start
> Requires Python 3.8+. It gracefully degrades when optional tools aren’t present.
# Optional: install psutil for live CPU/memory & partition info
python3 -m pip install --user psutil
# Clone the repo
git
clone
 https://github.com/anpa1200/SystemCheck.git
cd
 SystemCheck
# Run (colorful TTY output, deep storage scan enabled by default)
python3 systemcheck.py
# Skip deep scan (faster)
python3 systemcheck.py --no-deep
# Deep scan with larger top lists
python3 systemcheck.py --deep --top 10
# Generate a beautiful HTML report
python3 systemcheck.py --html --html-file report.html
# Or view immediately (Linux desktop)
xdg-open report.html
Tip (NVIDIA): install proprietary drivers sonvidia-smiworks.
Tip (hardware details):sudoenables richer DMI data on some distros (dmidecode).
HTML reports you can share
Generate a responsive, well-styled HTML report:
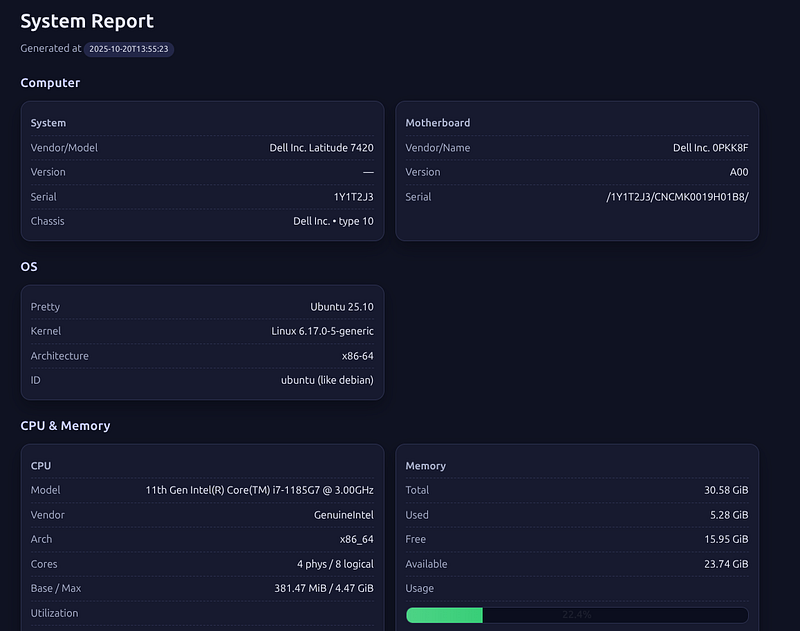
./syscheck_beauty.py --html --html-file report.html
The report includes section cards, clean tables, and color-coded usage bars. It’s perfect for:
-
Attachments in incident tickets
-
Deliverables in audits / onboarding docs
-
Sharing with teammates who don’t have shell access
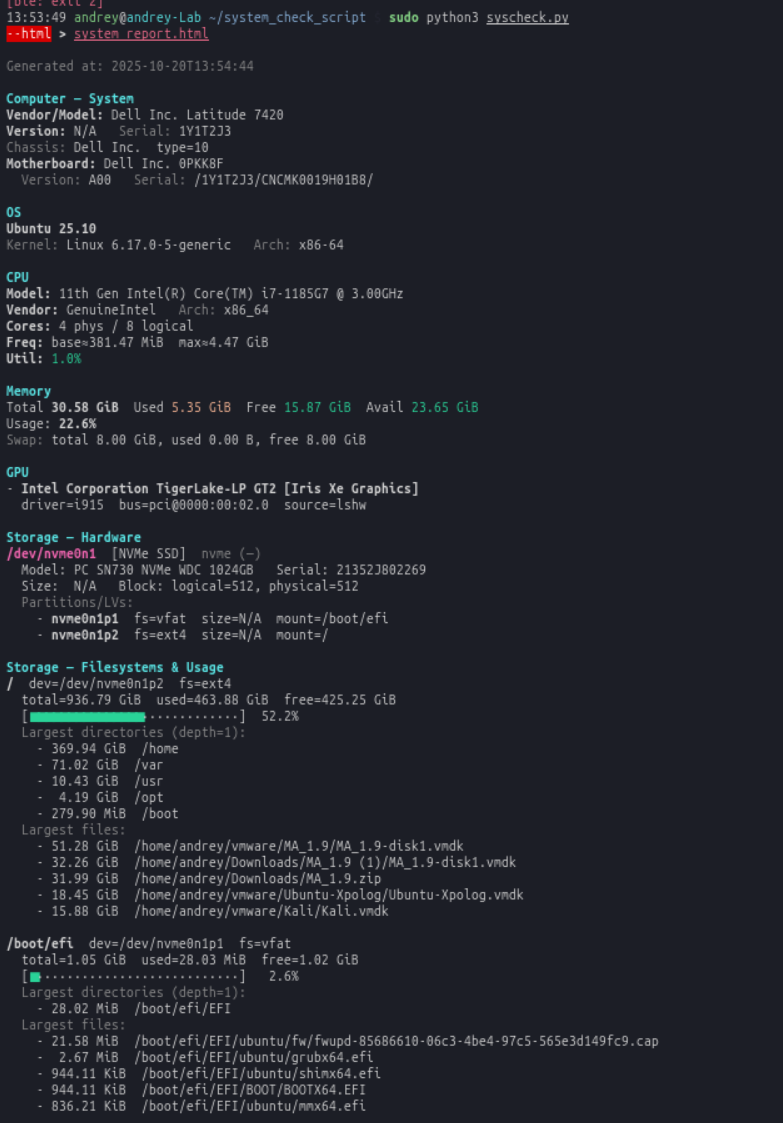
A peek at the terminal output
Generated at: 2025-10-20T13:54:44
Computer — System
Vendor/Model: Dell Inc. Latitude 7420
Version: N/A   Serial: 1Y1T2J3
Chassis: Dell Inc.  type=10
Motherboard: Dell Inc. 0PKK8F
  Version: A00   Serial: /1Y1T2J3/CNCMK0019H01B8/
OS
Ubuntu 25.10
Kernel: Linux 6.17.0-5-generic   Arch: x86-64
CPU
Model: 11th Gen Intel(R) Core(TM) i7-1185G7 @ 3.00GHz
Vendor: GenuineIntel   Arch: x86_64
Cores: 4 phys / 8 logical
Freq: base≈381.47 MiB  max≈4.47 GiB
Util: 1.0%
Memory
Total 30.58 GiB  Used 5.35 GiB  Free 15.87 GiB  Avail 23.65 GiB
Usage: 22.6%
Swap: total 8.00 GiB, used 0.00 B, free 8.00 GiB
GPU
- Intel Corporation TigerLake-LP GT2 [Iris Xe Graphics]
  driver=i915  bus=pci@0000:00:02.0  source=lshw
Storage — Hardware
/dev/nvme0n1  [NVMe SSD]  nvme (—)
  Model: PC SN730 NVMe WDC 1024GB   Serial: 21352J802269
  Size:  N/A   Block: logical=512, physical=512
  Partitions/LVs:
    - nvme0n1p1  fs=vfat  size=N/A  mount=/boot/efi
    - nvme0n1p2  fs=ext4  size=N/A  mount=/
Storage — Filesystems & Usage
/  dev=/dev/nvme0n1p2  fs=ext4
  total=936.79 GiB  used=463.88 GiB  free=425.25 GiB
  [■■■■■■■■■■■■■■■·············]  52.2%
  Largest directories (depth=1):
    - 369.94 GiB  /home
    - 71.02 GiB  /var
    - 10.43 GiB  /usr
    -  4.19 GiB  /opt
    - 279.90 MiB  /boot
  Largest files:
    - 51.28 GiB  /home/andrey/vmware/MA_1.9/MA_1.9-disk1.vmdk
    - 32.26 GiB  /home/andrey/Downloads/MA_1.9 (1)/MA_1.9-disk1.vmdk
    - 31.99 GiB  /home/andrey/Downloads/MA_1.9.zip
    - 18.45 GiB  /home/andrey/vmware/Ubuntu-Xpolog/Ubuntu-Xpolog.vmdk
    - 15.88 GiB  /home/andrey/vmware/Kali/Kali.vmdk
/boot/efi  dev=/dev/nvme0n1p1  fs=vfat
  total=1.05 GiB  used=28.03 MiB  free=1.02 GiB
  [■···························]   2.6%
  Largest directories (depth=1):
    - 28.02 MiB  /boot/efi/EFI
  Largest files:
    - 21.58 MiB  /boot/efi/EFI/ubuntu/fw/fwupd-85686610-06c3-4be4-97c5-565e3d149fc9.cap
    -  2.67 MiB  /boot/efi/EFI/ubuntu/grubx64.efi
    - 944.11 KiB  /boot/efi/EFI/ubuntu/shimx64.efi
    - 944.11 KiB  /boot/efi/EFI/BOOT/BOOTX64.EFI
    - 836.21 KiB  /boot/efi/EFI/ubuntu/mmx64.efi
(Progress bars render in color when your terminal supports ANSI.)
Command options
# Optional: install psutil for live CPU/memory & partition info
python3 -m pip install --user psutil
# Clone the repo
git clone https:
//gi
thub.com/anpa120
0
/SystemCheck.git
cd SystemCheck
# Run (colorful TTY output, deep storage scan enabled by default)
python3 systemcheck.py
# Skip deep scan (faster)
python3 systemcheck.py --
no
-deep
# Deep scan with larger top lists
python3 systemcheck.py --deep --top
10
# Generate a beautiful HTML report
python3 systemcheck.py --html --html-file report.html
# Or view immediately (Linux desktop)
xdg-
open
 report.html
--top N
# show top N directories/files per mount (default: 5)
--max-mounts N
# cap the number of mounts scanned (default: 5)
--per-mount-timeout S
# per-mount timeout in seconds (default: 60)
# TTY color
--
no
-color
# disable colored terminal output
How it works (under the hood)
-
Safe subprocess wrappers(
subprocess.check_output) with timeouts → non-crashy behavior. -
Graceful fallbacks:
psutil→/proc/core utils;nvidia-smi→lshw→lspci. -
Deep scanuses
du -x -B1 -d1for same-filesystem directory sizes and afind | sortpipeline for top files. -
NVMe/SSD/HDDclassification from
lsblk -JO(transport & rotation flags). -
HTMLis embedded CSS with responsive grids and ARIA-friendly usage bars.
Performance & safety
-
Default mode (no HTML/JSON) enablesdeep storage scan; pass
--no-deepto go faster. -
Deep scans areboundedwith
--per-mount-timeout. -
HTML/JSON modes default tono deep scan(can be re-enabled).
-
Only reads system info —does not modifyanything.
Troubleshooting
-
“No GPU adapters detected” Install
lshw(sudo apt install lshw) or proprietary drivers for NVIDIA (nvidia-smi). -
“Please run with Python 3.8 or newer” Use
pyenv, distro packages, or containers to run a newer Python. -
Sparse motherboard/System info Some environments require
sudofor DMI tables:sudo ./syscheck_beauty.pyAlso considersudo apt install dmidecode.
Extend it
A few easy wins you can add if you like hacking:
-
AMD GPUs: integrate
rocm-smifor VRAM and power usage. -
Thermals: pull CPU/GPU temps from
sensorsor/sys/class/thermal. -
Network: enumerate NICs, link speeds, IPs, RX/TX counters.
-
HTML themes: add light mode and print-friendly CSS.
If you want any of these, ping me — I can share diffs or a patch-ready snippet.
Final notes
-
It’s a single script; great forSSH one-offs,golden images, andfleet diagnostics.
-
Output is readable for humans, structured for machines, andbeautifulwhen you need to share.
If you try it, I’d love feedback — especially from servers with unusual storage layouts or hybrid-GPU laptops. Happy auditing!