AI-Powered Malware Debugger That Explains Every Function It Sees

- Category: CTI
- Source article: https://medium.com/@1200km/ai-powered-malware-debugger-that-explains-every-function-it-sees-2a28ef75df8a
- Published: 2026-03-14
- Preserved media: 9 image(s), including cover images, screenshots, diagrams, and infographics where present.
- Preserved technical blocks: 25 code/configuration block(s).
Ecosystem Fit
This page mirrors the original Medium article into the 1200km.com Docusaurus ecosystem. The original article flow, images, screenshots, infographics, and technical blocks are preserved from the export.
How I combined Claude AI, Frida, Capstone, and a suite of static analysis engines into a reverse engineering tool that talks back
Introdaction
Malware reverse engineering is one of the most skill-intensive jobs in security. You sit with IDA Pro or Ghidra, stare at hundreds of unnamed functions full of obfuscated assembly, and try to build a mental model of what a threat actor’s code is actually doing. It takes years to get fast at it.
I wanted to change that. So I builtAIDebug— an open-source malware debugger that uses Claude AI to analyze every function it encounters, explain what it does in plain English, assign a risk level, and map it to a MITRE ATT&CK technique. In real time. And it now ships with FLIRT signature matching, automatic malware pattern detection, per-function control flow graphs, and live network traffic capture.
This article walks you through what the tool does, how it works architecturally, and how to run it yourself on a real malware sample.
GitHub - anpa1200/AIDebug: AI-Assisted Malware Reverse Engineering Debugger - step-by-step debugger… *AI-Assisted Malware Reverse Engineering Debugger - step-by-step debugger with Claude AI analysis of function…*github.com
Table of Contents
-
The Problem With Traditional Malware Analysis
-
What AIDebug Does
-
Architecture Deep Dive
-
Running It On a Real Sample
-
Installation
-
The TUI: Four Panels That Tell the Full Story
-
Ask the AI Follow-Up Questions
-
Dynamic Mode: What Happens at Runtime
-
Reporting and Export
-
Architecture Summary
-
Why Claude?
-
Conclusion
The Problem With Traditional Malware Analysis
When you open a stripped Windows PE in a disassembler, you’re greeted with hundreds of functions namedsub_401234. Your job is to:
-
Read the assembly
-
Understand what each function does
-
Name it
-
Repeat — for hours
The bottleneck is not intelligence, it’s throughput. An experienced analyst can only read assembly so fast. And when malware is packed, obfuscated, or uses indirect calls, even experienced analysts slow down dramatically.
There are also a dozen sub-tasks that eat time before you even get to the interesting code: separating compiler-generated CRT functions from hand-written malware code, identifying which functions are trivial wrappers, spotting XOR decryption loops before you waste 20 minutes trying to reverse them as normal code.
AI doesn’t replace the analyst — but it can act as an extremely fast co-pilot that reads assembly, pre-classifies behavioral patterns, draws the control flow, and gives you its interpretation in seconds, while you decide where to look next.
What AIDebug Does
AIDebug is a Python tool that runs a full pipeline on any PE or ELF binary:
-
Static analysis— PE/ELF parsing, section entropy, imports, strings
-
Recursive-descent function discovery— from entry point, following CALL targets
-
FLIRT signature matching— library functions identified and excluded from AI analysis
-
Malware pattern scanning— 8 behavioral patterns detected before AI runs
-
CFG construction— basic block decomposition per function
-
Claude AI analysis— disassembly + patterns + context sent to Claude for structured explanation
-
Frida dynamic instrumentation— optional runtime hooks, memory diffs, unpacking detection, network capture
The UI is a Textual TUI with three panels. The right panel has four tabs:
Architecture Deep Dive
Layer 1: Static Analysis
TheStaticAnalyzerclass handles PE and ELF files:
from
 analysis
import
 StaticAnalyzer
info = StaticAnalyzer().analyze(
'malware1.exe'
)
print
(info.arch)
# 'x86'
print
(info.entry_point)
# 0x401780
print
(info.imports)
# [ImportInfo(dll='KERNEL32.dll', functions=[...])]
For PE files it usespefileto extract architecture, image base, section names and entropy (> 7.0 flags packing), import table, export table, and both ASCII and UTF-16LE strings with virtual address mapping.
For ELF files it usespyelftoolswith full symbol table support — including RISC-V, useful for IoT malware like Mirai variants.
Layer 2: Disassembler + Enrichment Pipeline
TheDisassembleruses Capstone for recursive-descent function discovery. After finding all reachable functions, it runs an enrichment pass:
def

_run_enrichment
(
self, addresses
):
    detector = PatternDetector()
    flirt    = FlirtMatcher(self.info)
for
 addr
in
 addresses:
        func = self.functions[addr]
        func.patterns    = detector.detect(func)
# pre-AI pattern scan

match
 = flirt.identify(func)

if

match
:
            func.flirt_match =
match
            func.is_library  =
match
.skip_ai
Every function gets pattern detection and FLIRT matching before a single AI call is made. This front-loading means the AI prompt arrives pre-enriched — Claude sees what patterns were already found and can focus on deeper interpretation.
Layer 3: FLIRT Signature Matching
One of the biggest noise sources in PE analysis is compiler-inserted CRT code. Functions like_memset,_strlen,_malloc, and the whole C runtime startup chain appear in virtually every MSVC-compiled binary. Sending them all to Claude wastes tokens and clutters results.
AIDebug solves this with a lightweight FLIRT-style matching system:
**Strategy 1 — Import wrapper detection:**A function that’s justjmp [IAT_entry]is named after the imported API it wraps. This covers the vast majority of API call stubs in PE files.
**Strategy 2 — CRC16 prologue match:**The first 32 instruction bytes are hashed (with call target addresses zeroed out to make the hash position-independent) and looked up indata/flirt_sigs.json.
**Strategy 3 — Single-import call inference:**A function that calls exactly one imported API and immediately returns is named after that API.
**Strategy 4 — Trivial stub detection:**Functions with 3 or fewer instructions are marked as library stubs.
Result: the function list distinguishes clearly between library noise and actual malware logic:
[
LIB
]
0x40541c
   _memset          (
3
 insns)    ← skipped
by
 AI
[
LIB
]
0x405674
   _strlen          (
8
 insns)    ← skipped
by
 AI
[
CRIT
]
0x40bcb8
   allocate_rwx_region (
31
 insns) ← analyzed
by
 AI
[
HIGH
]
0x4079b6
   check_os_registry   (
40
 insns) ← analyzed
by
 AI
Layer 4: Malware Pattern Detection
PatternDetectorscans every function's instruction list for 8 behavioral patterns before AI analysis runs. Detected patterns are:
-
**xor_decryption_loop**(HIGH): backward jump + XOR on a memory operand — the classic string/config decryption pattern -
**stack_string**(MEDIUM): 4+ consecutivemov byte ptr [esp+N]— anti-string-scan technique -
**api_hash_resolution**(HIGH): ROR/ROL + XOR loop — shellcode loader technique for resolving API names by hash -
**rdtsc_timing_check**(MEDIUM/HIGH): RDTSC instruction — sandbox/VM timing evasion -
**direct_syscall**(HIGH): SYSCALL / SYSENTER / INT 2E — EDR bypass via direct kernel entry -
**nop_sled**(INFO): 5+ consecutive NOPs — shellcode alignment -
**null_preserving_xor**(HIGH): test/jz/xor sequence — common in XOR-encoded shellcode to avoid null bytes -
**base64_alphabet_reference**(MEDIUM): reference to a known Base64 alphabet string
These patterns are injected into the AI prompt, so Claude gets pre-flagged behavioral context rather than having to infer everything from raw assembly. The patterns also appear independently in the Patterns tab — no AI call required to see them.
Layer 5: Control Flow Graph

CFGBuilder.build(func)splits the function into basic blocks at branch/jump/ret boundaries and links blocks via successor/predecessor edges. The result is aCFGobject with a dict ofBasicBlockentries.
Two renderers:
-
**CFGTextRenderer**— renders to multi-line ASCII art with box-drawing characters for the TUI -
**CFGSVGRenderer**— renders to a self-contained inline SVG for HTML reports, using a BFS layout algorithm
A real function frommalware1.exe(0x4015c2, 26 instructions,stack_stringpattern):
CFG:

6

basic

blocks
┌──

◆

Block

0x004015c2

(12

insns)

──
│

0x004015c2:

push

ebp
│

0x004015c3:

mov

ebp,

esp
│

0x004015c5:

sub

esp,

0x4c
│

…

(9

more)
└──

→

0x004015e9
,

0x004015e1
┌──

◆

Block

0x004015e1

(2

insns)

──
│

0x004015e1:

xor

eax,

eax
│

0x004015e3:

ret
└──
 [
RET
]
The CFG shows immediately what the branching structure looks like without reading every instruction.
Layer 6: AI Analysis
This is the core of the tool. For each non-library function, we build a structured prompt that includes binary metadata, the full import table, the disassembly, referenced strings, cross-references — and now the pre-detected patterns:
BINARY INFO:

File      :

malware1.exe

Arch      :

x86

32
-bit

OS Target :

Windows
KNOWN IMPORTED APIs:

KERNEL32.dll:

WaitForSingleObject,

LoadLibraryA,

...

ADVAPI32.dll:

CryptImportKey,

CryptDecrypt,

...
FUNCTION ADDRESS:

0x40bcb8
DISASSEMBLY

(31

instructions):
0x0040bcb8:

push

ebp
...
0x0040bce4:

call

NtAllocateVirtualMemory
REFERENCED STRINGS:

"NtAllocateVirtualMemory"
PRE-DETECTED PATTERNS:
  [
HIGH
]
xor_decryption_loop:

xor

byte

ptr
 [
eax
]
,

cl

at

0x40bcd1
Claude returns structured JSON:
{

"suggested_name"
:

"allocate_rwx_region"
,

"summary"
:

"Resolves NtAllocateVirtualMemory dynamically and allocates RWX memory. NT API used to bypass EDR hooks on VirtualAlloc."
,

"parameters"
:

[

{
"name"
:

"size"
,

"type"
:

"ULONG_PTR"
,

"description"
:

"Size of region"
}
,

{
"name"
:

"protect"
,

"type"
:

"ULONG"
,

"description"
:

"0x40 = PAGE_EXECUTE_READWRITE"
}

]
,

"return_value"
:

"Pointer to allocated RWX region, or NULL"
,

"behaviors"
:

[

"Direct NT syscall — bypasses EDR hooks on VirtualAlloc"
,

"RWX memory allocation — shellcode staging indicator"

]
,

"mitre_technique"
:

"T1055.001 - Process Injection: DLL Injection"
,

"risk_level"
:

"CRITICAL"
,

"notes"
:

"Check callers for WriteProcessMemory or CreateRemoteThread after this call."
}
That note —“Check callers for WriteProcessMemory”— is the kind of contextual intelligence that saves an analyst 20 minutes of cross-referencing.
Layer 7: Dynamic Instrumentation (Frida)
In dynamic mode the tool spawns the binary and loads three Frida scripts simultaneously:
**tracer.js**— hooks 80+ Win32 APIs and logs every call with auto-dereferenced string arguments.
**unpack_detector.js**— hooksVirtualAlloc,VirtualProtect, andNtProtectVirtualMemory. When a region transitions from RWX to R-X (the unpacking stub has finished writing and is handing control to the unpacked code), the script scans the region forpush ebp; mov ebp, espprologues to hint at the OEP:
// Scan for PE-like prologue in newly-executable region
for
 (
var
 i =
0
; i < size -
2
; i++) {

var
 b0 = mem[i], b1 = mem[i+
1
], b2 = mem[i+
2
];

if
 (b0 ===
0x55
 && b1 ===
0x8B
 && b2 ===
0xEC
) {
        oepHint = ptr(baseAddr).
add
(i).toString();

break
;
    }
}
**network_tracer.js**— hooks Winsock (connect,send,recv,sendto,recvfrom) and WinInet (InternetOpenUrl,HttpSendRequest,InternetReadFile). Captures actual buffer bytes up to 512 bytes as hex strings, and parsessockaddrstructs to extract IP and port:
// Parse sockaddr for IP:port
var
 family = sockaddr.readU16();
if
 (family ===
2
) {
// AF_INET

var
 port = ((sockaddr.
add
(
2
).readU8() <<
8
) | sockaddr.
add
(
3
).readU8());

var
 ip = [
0
,
1
,
2
,
3
].map(function(i) {

return
 sockaddr.
add
(
4
+i).readU8();
    }).
join
(
'.'
);
    send({type:
'network'
,
event
:
'connect'
, ip:ip, port:port, ...});
}
The result is C2 protocol reconstruction without needing a separate network capture tool — all captured data ends up in the Network tab of the TUI and in thenetwork_eventsdatabase table.
Theengine.pyalso captures 64-byte memory snapshots at pointer-valued registers on function entry, then reads the same regions again on exit to produce a per-function memory diff.
Layer 8: Persistence (SQLite)
Five tables intraces.db:
-
sessions— binary metadata per analysis run -
function_traces— disassembly + AI analysis JSON per function -
api_calls— Win32 API call log from dynamic mode -
detected_patterns— malware pattern results per function -
network_events— network events from dynamic mode
Re-running the tool on the same binary is instant — no repeat API calls for already-analyzed functions.
Running It On a Real Sample
Here’s what happens when I run this onmalware1.exe.
Step 1: Static fingerprint
[*]

Format
   :
PE

x86

32
-bit
  (Windows)
[*]

EntryPoint
:
0
x401780
[*]

Sections
  :
[
'.text'
,
'.rdata'
,
'.data'
,
'.reloc'
,
'dhqj'
]
[*]

Imports
   :
89

functions

from

8

DLLs
[!]

Possible

packing
:
[
'dhqj'
]
 (entropy >
7.0
)
Immediate red flags:
-
Section
**dhqj**— non-standard section name, custom packer -
Entropy > 7.0— packed or encrypted content
-
Imports:
Secur32.dll(SSP manipulation),ADVAPI32.dllwithCryptDecrypt/CryptImportKey,ntdll.dllNT-native calls
Step 2: Function discovery + enrichment
25 functions found. After FLIRT matching: 3 are library functions (_memset,_strlen, a CRT stub) and are skipped. Pattern detection fires on 2 functions before AI runs:
[FLIRT]
 sub_00405412  → _memset (msvcrt) — skipped

[FLIRT]
 sub_00405674  → _strlen (msvcrt) — skipped

[PAT  ]

0
x004015c2    → stack_string (MEDIUM)

[PAT  ]

0
x00401000    → xor_decryption_loop (HIGH)
I already know where to look before Claude runs a single analysis.
Step 3: Key findings from AI analysis
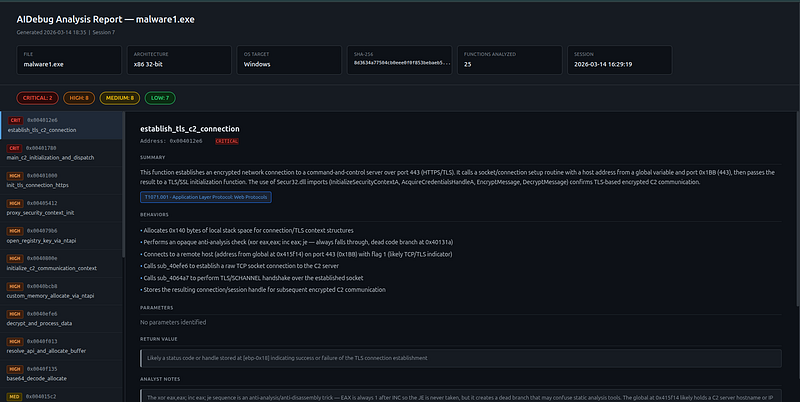
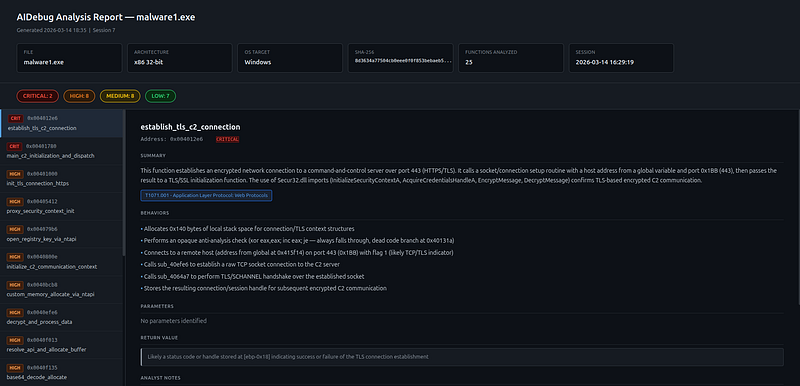
**0x40bcb8**—**allocate_shellcode_region**[CRITICAL]
> Calls NtAllocateVirtualMemory directly (bypassing EDR hooks on VirtualAlloc) to allocate RWX memory. The 0x40 protection constant is PAGE_EXECUTE_READWRITE. MITRE: T1055.001
**0x4079b6**—**check_os_and_open_registry**[HIGH]
> Queries Windows version (“Windows 11” check) and opens a registry key via NtOpenKey. The FallbackGUID string suggests persistence — writing a GUID-keyed run key. MITRE: T1547.001 — Registry Run Keys
**0x4015c2**—**build_stack_string**[MEDIUM]
> Constructs a string on the stack byte-by-byte ( stack_string pattern confirmed by pre-analysis). This technique evades static string scanners. The constructed value is likely a registry path, URL, or filename. MITRE: T1140 — Deobfuscate/Decode Files or Information
**0x401000**—**xor_decode_config**[HIGH]
> XOR decryption loop with a hardcoded key. Likely decoding an embedded C2 address or configuration blob.
Within minutes — without writing a single IDA script — we have a threat profile: RWX allocation via NT syscalls, registry persistence, stack-string obfuscation, and an XOR-encoded C2 config.
Installation
git
clone
 https://github.com/anpa1200/AIDebug
cd
 AIDebug
pip install -r requirements.txt
export
 ANTHROPIC_API_KEY=sk-ant-...
Run in TUI mode
python
main
.py

--binary
 /path/
to
/sample
.exe
Run in CLI mode (headless, good for scripting)
python
main
.py

--binary
 sample
.exe

--no-tui
Generate HTML report in one shot
python
main
.py

--binary
 sample
.exe

--no-tui

--report
Dynamic mode (requires Frida)
# Linux with Wine
python
main
.py

--binary
 sample
.exe

--mode
 dynamic
# Attach
to
 running process
python
main
.py

--binary
 sample
.exe

--mode
 dynamic
--pid

4521
The TUI: Four Panels That Tell the Full Story

The right panel has four tabs that work together to give you a complete picture of any function without leaving the terminal.
AI Analysis tab— Claude’s structured output: suggested name, 2–3 sentence summary, parameters, return value, behaviors, MITRE technique, analyst notes.
CFG tab— The function’s control flow graph as ASCII art. You see immediately whether you’re looking at a simple linear function or a complex loop-with-branches before reading a single instruction.
CFG: 6 basic blocks
┌── ◆ Block 0x004015c2 (12 insns) ──
│  0x004015c2: push     ebp
│  …
└── → 0x004015e9, 0x004015e1
┌── ◆ Block 0x004015e9 (6 insns) ──   ← loop body
│  0x004015e9: mov      al, [ebp-0x3c+ecx]
│  0x004015ef: xor      al, 0x41
│  …
└── → 0x004015e9, 0x004015fb           ← loops back
Patterns tab— Pre-detected behavioral patterns. Available immediately, no AI needed:
[HIGH] xor_decryption_loop  @
0
x004015ed

XOR

loop

on
 memory
with
 backward branch
  Evidence:
xor

byte
 ptr [esi+ecx], al; jne
0
x4015e9
[MED ] stack_string  @ 0x004015c2
  4+ consecutive byte-by-byte stack writes
  Evidence: mov byte ptr [ebp-0x3c], 0x68
Network tab— Live network events in dynamic mode:
connect

connect

192.168
.
1.105
:
4444

0
 bytes
send

send

192.168
.
1.105
:
4444

128
 bytes
recv

recv

192.168
.
1.105
:
4444

64
 bytes
Ask the AI Follow-Up Questions
With a function selected, type questions at the bottom bar:
-
“What protection constant should I look for to confirm it’s RWX?”
-
“Why use NtAllocateVirtualMemory instead of VirtualAlloc?”
-
“What should I look at next to confirm process injection?”
-
“Write a YARA rule for this function’s behavior”
-
“Is the XOR key hardcoded or derived at runtime?”
The AI has the full function context and conversation history. This is closer to having a senior analyst sitting next to you than using a static analysis tool.
Dynamic Mode: What Happens at Runtime
When you run with--mode dynamic, three things happen in parallel as the process executes:
**1. Per-function register snapshots.**Each hooked function firesonEnterandonLeavecallbacks. The JS hook reads all general-purpose registers plus 128 bytes of stack at entry, and re-reads pointer-valued registers at exit to compute a memory diff. The snapshot is fed to Claude as runtime context.
**2. Unpacking detection.**The detector watches VirtualProtect calls. When a region that was RWX becomes R-X, the engine knows unpacking just finished:
[
Unpack
] RWX allocation detected @
0x00870000
  size=
65536
[
Unpack
] *** UNPACKING COMPLETE ***
[
Unpack
] Region :
0x00870000
[
Unpack
] OEP hint:
0x00870010
  new_protect=
0x20
This tells you exactly where to re-disassemble after the stub finishes.
**3. Network capture.**Every connect/send/recv call is captured with the actual bytes. The Network tab fills up as the malware tries to reach its C2:
connect

connect

192.168
.
1.105
:
4444

0
 bytes
send

send

192.168
.
1.105
:
4444

128
 bytes    ← beacon
recv

recv

192.168
.
1.105
:
4444

64
 bytes     ← response
All of this is saved to the database so you can review it after the session ends.
Reporting and Export
After analysis, generate reports directly:
#
HTML
 report (self-contained, dark theme, CFG SVGs embedded)
python
main
.py

--binary
 sample
.exe

--no-tui

--report
# YARA rules for HIGH/CRITICAL functions
python
main
.py

--binary
 sample
.exe

--no-tui

--yara
# JSON export for SIEM/SOAR
python
main
.py

--binary
 sample
.exe

--no-tui

--json-export
#
All
 three, custom output directory
python
main
.py

--binary
 sample
.exe

--no-tui

--report

--yara

--json-export

--out-dir
 ./reports/
The HTML report includes an interactive sidebar with all functions sorted by risk, and each function’s detail page shows:
-
AI summary, MITRE tag, behaviors, parameters
-
Detected patterns sectionwith severity-coded entries
-
Inline CFG SVG— the full control flow graph embedded directly in the page
-
Color-coded disassembly
Architecture Summary
malware
.exe
     │
     ▼
┌────────────────────────────────────────────────────────────┐
│
StaticAnalyzer
 (pefile / pyelftools)                      │
│  →
BinaryInfo
:
arch
,
sections
,
imports
,
strings
,
entropy
   │
└────────────────────┬───────────────────────────────────────┘
                     │
                     ▼
┌────────────────────────────────────────────────────────────┐
│
Disassembler
 (Capstone)                                   │
│  →
Function

objects
:
instructions
,
calls_to
,
strings_ref
   │
│                                                            │
│
Enrichment

pipeline
 (runs on all functions):              │
│  ├──
FlirtMatcher
  →
is_library
,
flirt_match
               │
│  └──
PatternDetector
 →
patterns

[]
                         │
└────────────────────┬───────────────────────────────────────┘
                     │
          ┌──────────┴──────────┐
          │ (static)            │ (dynamic, optional)
          ▼                     ▼
          │             ┌─────────────────────────────┐
          │             │
DebugEngine
 (Frida)        │
          │             │
tracer
.js
      →
API

calls
 │
          │             │
unpack_detector
.js
 →
OEP
   │
          │             │
network_tracer
.js
  →
C2

I
/
O
│
          │             │
hook_function
  →
snapshots
 │
          │             └─────────────┬───────────────┘
          │                           │
          ▼                           ▼
┌────────────────────────────────────────────────────────────┐
│
CFGBuilder
  →
CFG
 (BasicBlock dict)                      │
└────────────────────┬───────────────────────────────────────┘
                     │
                     ▼
┌────────────────────────────────────────────────────────────┐
│
AIAnalyzer
 (Claude claude-opus-
4
-
6
)                       │
│
Input
:
disassembly
 +
imports
 +
strings
 +
patterns
         │
│       +
xrefs
 +
snapshot
 (if dynamic)                      │
│
Output
:
name
,
summary
,
risk
,
MITRE
,
params
,
notes
         │
│
Library

functions
 (FLIRT match) →
skipped
                 │
└────────────────────┬───────────────────────────────────────┘
                     │
                     ▼
┌────────────────────────────────────────────────────────────┐
│
TraceStore
 (SQLite)                                       │
│
sessions
 │
function_traces
 │
api_calls
                    │
│
network_events
 │
detected_patterns
                        │
└────────────────────┬───────────────────────────────────────┘
                     │
                     ▼
┌────────────────────────────────────────────────────────────┐
│
Textual

TUI
                                               │
│  ┌──────────┐  ┌──────────────┐  ┌──────────────────────┐  │
│  │
Function
 │  │
Disassembly
  │  │
[AI Analysis]
[CFG  ]
 │  │
│  │
List
   │  │   +
Regs
     │  │
[Patterns  ]
[Network]
│  │
│  └──────────┘  └──────────────┘  └──────────────────────┘  │
│                                     +
Chat

bar
             │
└────────────────────┬───────────────────────────────────────┘
                     │
                     ▼
┌────────────────────────────────────────────────────────────┐
│
Reporting
                                                 │
│
html_report
.py
   →
.html
 (CFG SVG + patterns embedded)    │
│
yara_generator
.py
 →
.yar
 (AI-generated rules)             │
│
json_export
.py
   →
.json
 (SIEM/SOAR schema v1)            │
└────────────────────────────────────────────────────────────┘
Why Claude?
I tried several models for the structured JSON output. Claude was the only one that consistently:
-
Returns valid JSON without markdown fences leaking through
-
Correctly identifies subtle evasion techniques (NT API usage, timing checks)
-
Writes accurate MITRE ATT&CK technique mappings
-
Provides genuinely useful analyst notes, not just restating the disassembly
-
Handles follow-up questions with full context awareness
-
Integrates pre-detected pattern context into its analysis rather than ignoring it
Theclaude-opus-4-6model has strong assembly comprehension. It correctly identifies x86 calling conventions, recognizes common compiler idioms, and understands the difference between a compiler-generated prologue and a hand-written shellcode stub. When you inject pattern context — "this function has a XOR decryption loop at 0x4015ed" — it builds on that rather than re-deriving it from scratch.
Conclusion
AIDebug is not a replacement for IDA Pro or a seasoned reverse engineer. It’s a force multiplier. FLIRT matching removes the library noise. Pattern detection front-loads the behavioral classification. The CFG makes the structure visible at a glance. And Claude’s contextual analysis fills in the meaning — what the function does, why it matters, and where to look next.
The combination gets you from “unknown packed PE” to a prioritized threat profile in minutes rather than hours.
The full source is athttps://github.com/anpa1200/AIDebug.
If you’re working in threat intelligence, incident response, or malware research — try it on your next sample and let me know what you find.
All analysis in this article was performed in an isolated VM environment on samples used for security research. Always analyze malware in a properly isolated sandbox.