AIDebug 3.1 Full Release Review: From Binary Intake to String Intelligence
A practical, evidence-first walkthrough of AIDebug's complete malware-analysis workflow, including the new occurrence-aware String Intelligence workspace.
- Category: Malware Analysis
- Topics: Malware Analysis, Reverse Engineering, AIDebug, String Analysis, PE Analysis, AI Security, Digital Forensics, Security Tooling
- Source article: 1200km canonical edition
- Published: 2026-08-13
- Preserved media: 13 images, including the dedicated AIDebug 3.1 cover and 12 screenshots reused from the published 1200km malware-analysis guides.
- Canonical edition: This 1200km page is the maintained, self-canonical article.
Ecosystem Fit
This review is the AIDebug platform layer of the 1200km malware-analysis learning path. Start with the Malware Analysis field guide, build an isolated environment with the safe malware-analysis lab guide, then use the PE structure, assembly, and strings-analysis guides for deeper evidence interpretation. The original AIDebug introduction remains useful historical context; this review is the current full-platform companion.
Malware triage rarely fails because analysts lack tools. It fails because evidence becomes fragmented across a file-identification utility, PE parser, strings extractor, disassembler, decompiler, debugger, notebook, and several disconnected exports. The analyst then has to reconstruct which observation came from which artifact and which conclusion was only a hypothesis.
AIDebug brings those early reverse-engineering tasks into one terminal-oriented workflow. It can identify a file independently of its extension, parse PE and ELF artifacts, discover a bounded function set, disassemble code, flag deterministic patterns, build control-flow graphs, inspect PE structures, reconstruct C-like code with Ghidra, preserve local history, and produce review-ready reports. AI is optional and sits after deterministic evidence rather than replacing it.
Version 3.1 adds the largest new analysis surface in this release line: whole-file, occurrence-aware String Intelligence with stable evidence IDs, offsets, encoding context, multi-label classification, conservative IOC parsing, local DLL/API descriptions, and explicitly opt-in AI review. This article reviews that feature and the rest of the platform as one connected analyst workflow.
Release status verified 13 August 2026: the merged AIDebug source identifies itself as 3.1.0 at commit
cd81ef242db0bcea3296970d45c241a4228d2d27. The latest immutable GitHub and PyPI release is still 3.0.0. The 3.1 tag and package have not been published. This review therefore distinguishes the installable 3.0 package from the pinned 3.1 source revision.
Scope and safety: Static inspection does not execute the selected PE or ELF. GDB debug mode launches a local ELF, and Frida dynamic mode instruments a running process. Use execution features only inside an isolated, authorized, network-controlled malware-analysis lab. Screenshots reused from my published guides illustrate interface and workflow shape; they are not validation or detection-accuracy evidence.
Table of contents
- What changed in AIDebug 3.1
- Complete capability map
- Installation and release-aware setup
- The evidence-first analyst workflow
- Optional AI analysis
- Active ELF debugging and Frida instrumentation
- Interpreting AIDebug output
- Resource bounds and analytical limitations
- Recommended end-to-end command sequence
- Release assessment
- Conclusion
- References
- Follow My Work
What changed in AIDebug 3.1
AIDebug 3.0 expanded the PE workspace: TLS callbacks, x64 unwind data, load configuration, Control Flow Guard evidence, Authenticode records, Rich and CodeView metadata, overlays, and managed PE metadata. Version 3.1 adds a separate string-analysis path that works in both the terminal UI and automation-friendly CLI.
The important change is not simply “more strings.” The new model preserves evidence that ordinary flat output discards:
- stable record identifiers;
- original file offsets and mapped addresses where mapping is available;
- ASCII, UTF-8, UTF-16LE, and UTF-16BE encoding identity;
- original byte and character lengths;
- duplicate occurrence locations;
- section context;
- deterministic score, confidence, categories, reasons, and descriptions;
- explicit retained, omitted, filtered, and truncated coverage; and
- separate deterministic and AI findings.
The classifier is multi-label. A Windows path ending in a DLL can remain both a path and a DLL rather than being forced into the first matching category. Related aliases share one evidence family for scoring, so ip_address plus ipv4 does not create artificial confidence by counting the same observation twice.
The merged 3.1 code also hardens the common false-positive boundaries that matter in binary text:
- domains are IDNA-normalized and checked against a packaged offline IANA root-zone snapshot;
- IPv4 and IPv6 candidates must occupy a complete valid token rather than a valid substring inside a version or filename;
- configuration assignments use a conservative full-line grammar;
- unknown DLL and API names are labeled unverified instead of receiving invented descriptions; and
- high entropy is not, by itself, a Base64 finding or evidence of maliciousness.
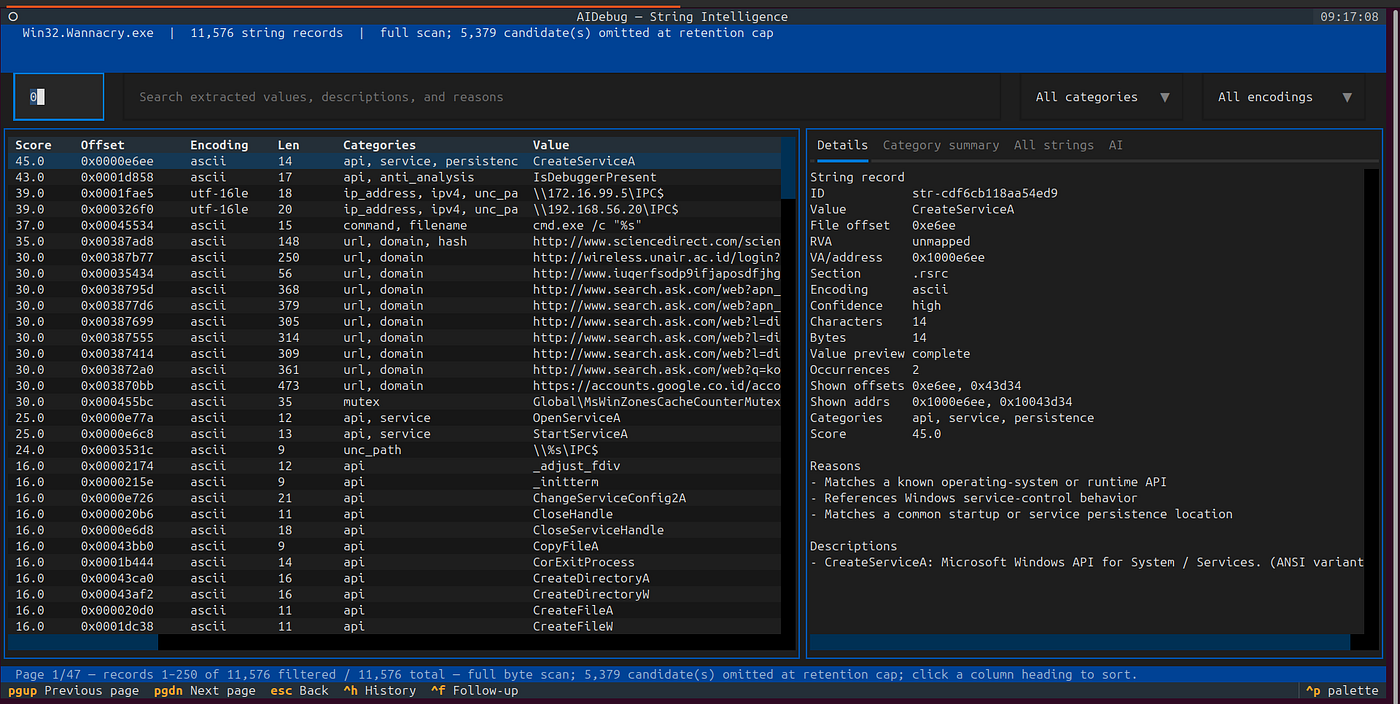
Figure 1 — AIDebug String Intelligence in the published strings-analysis guide. The image demonstrates the workspace layout; the displayed classifications still require evidence review.
Complete capability map
The easiest way to understand AIDebug is as a set of related workspaces around one evidence record.
| Area | What AIDebug provides | Evidence boundary |
|---|---|---|
| File identification | Magic signatures, structured-container checks, text rules, optional local libmagic, and bounded AI fallback | A declared type is a classification result, not proof that every embedded object was parsed |
| Static intake | SHA-256, file size, PE/ELF metadata, sections, imports, exports, strings, symbols, and entry points | Parsing does not prove reachability or runtime use |
| Disassembly | Capstone-backed bounded recursive-descent discovery for supported architecture paths | Indirect, unreachable, packed, stripped, and overlaid code may be missed |
| Pattern detection | Deterministic leads for XOR loops, stack strings, API hashing, RDTSC, syscalls, NOP sleds, null-preserving XOR, and Base64 alphabet references | A pattern is a triage lead, not a malware-family verdict |
| Library identification | Exact import-thunk recognition and heuristic FLIRT-inspired hints | Compact signatures can collide; inferred names require validation |
| Control flow | Basic blocks, predecessors, successors, terminal rendering, and report SVG | A CFG covers only the instructions and functions recovered within bounds |
| Hex workspace | Read-only, paged whole-file byte inspection | Hex display does not interpret a structure automatically |
| PE workspace | Headers, sections, directories, imports, exports, resources, relocations, TLS, unwind data, load configuration, CFG, certificates, debug provenance, overlays, and CLR metadata | Static flags and metadata are not runtime enforcement or attribution |
| String Intelligence | Occurrence-aware extraction, filters, categories, ranking, local DLL/API descriptions, CLI output, and private JSON | Presence does not prove code use, network contact, persistence, or maliciousness |
| Ghidra reconstruction | Per-function and bounded full-discovery C-like reconstruction | Decompiled output is not recovered original source |
| C source analysis | One source file compiled inside the documented Bubblewrap boundary, then statically inspected as a temporary ELF | The compiled artifact is not executed; project-wide builds are outside scope |
| Learning Mode | 100 standalone C cases with source, compiler output, disassembly, Ghidra reconstruction, and provenance | Lessons explain compiler/code relationships, not malware behavior by themselves |
| Optional AI | Function explanation, questions, ATT&CK candidates, and chunked string review across Anthropic, OpenAI, Gemini, or Ollama-compatible endpoints | Model output is a hypothesis and may transmit sensitive evidence |
| GDB debug mode | Local ELF breakpoints, stepping, registers, deltas, disassembly context, and input/output candidates | This executes the target and provides no sandbox by itself |
| Frida dynamic mode | Function/API hooks, register and stack snapshots, memory-transition leads, and bounded network events | Hook readiness and observed coverage vary; this is not packet capture or complete behavior |
| History | SHA-256-indexed SQLite sessions and compatible finding restoration | Local storage is persistent and unencrypted by AIDebug |
| Reporting | HTML, versioned JSON, String Intelligence JSON, YARA candidates, ATT&CK candidates, CFG output, and local history | All detection and technique candidates require analyst validation |
Installation and release-aware setup
Stable published package: AIDebug 3.0
Use this path when you need the version currently published through the verified PyPI workflow:
python3 -m venv .venv
source .venv/bin/activate
python -m pip install --upgrade pip
python -m pip install "1200km-aidebug==3.0.0"
aidebug --version
Install an optional extra only when the corresponding workflow is required:
# LLM provider clients and locally validated YARA generation
python -m pip install "1200km-aidebug[ai]==3.0.0"

# Frida integration
python -m pip install "1200km-aidebug[dynamic]==3.0.0"

# All optional Python integrations
python -m pip install "1200km-aidebug[all]==3.0.0"
Pinned AIDebug 3.1 source
String Intelligence is present in the merged source revision, not the current PyPI artifact. Pin the reviewed commit instead of assuming that a future main checkout has identical behavior:
git clone https://github.com/anpa1200/AIDebug.git
cd AIDebug
git checkout cd81ef242db0bcea3296970d45c241a4228d2d27

python3 -m venv .venv
source .venv/bin/activate
python -m pip install --upgrade pip
python -m pip install -e .
aidebug --version
Use python -m pip install -e ".[ai]", .[dynamic], or .[all] only when those optional integrations are needed. Ghidra, GDB, Bubblewrap, an ELF-capable C compiler, libmagic, and Frida target components are external dependencies used by specific paths rather than the base static workflow.
The evidence-first analyst workflow
The strongest use of AIDebug is not clicking every tab. It is asking a sequence of questions and preserving which layer answered each one:
identify → hash → map structure → extract leads → recover code
         → cross-reference → validate dynamically if required
         → produce bounded findings and next actions
1. Identify the real file type
Do not allow an extension to define the investigation. AIDebug can identify an arbitrary regular file independently of its name:
aidebug --identify /lab/case-001/unknown.bin --offline
The structured result includes the declared type, MIME type, common extensions, confidence, method, evidence, SHA-256, and size. Deterministic checks cover common executable, bytecode, archive, disk-image, Office/OpenDocument/EPUB, document, media, capture, database, registry, event-log, script, and text forms. ZIP-derived formats are inspected through bounded member-name and metadata reads; AIDebug does not extract or execute the archive.
If no deterministic rule matches and AI is enabled, the fallback receives bounded metadata rather than the file body: extension, size, SHA-256, up to 96 header bytes, 32 tail bytes, entropy, and NUL ratio. The result is labeled ai-inference, capped at 60% confidence, and still requires analyst validation. --offline disables that path and returns Unknown when no rule matches.
2. Run deterministic static triage
Open the main terminal interface in offline mode:
aidebug --binary /lab/case-001/sample.exe --offline
The main workflow combines discovered functions, disassembly, deterministic patterns, optional analysis, CFG, history, hex/PE inspection, and the new strings workspace. Offline mode is not a reduced “demo” mode: file parsing, strings, disassembly, patterns, structure inspection, history, and local exports remain available without an API key.
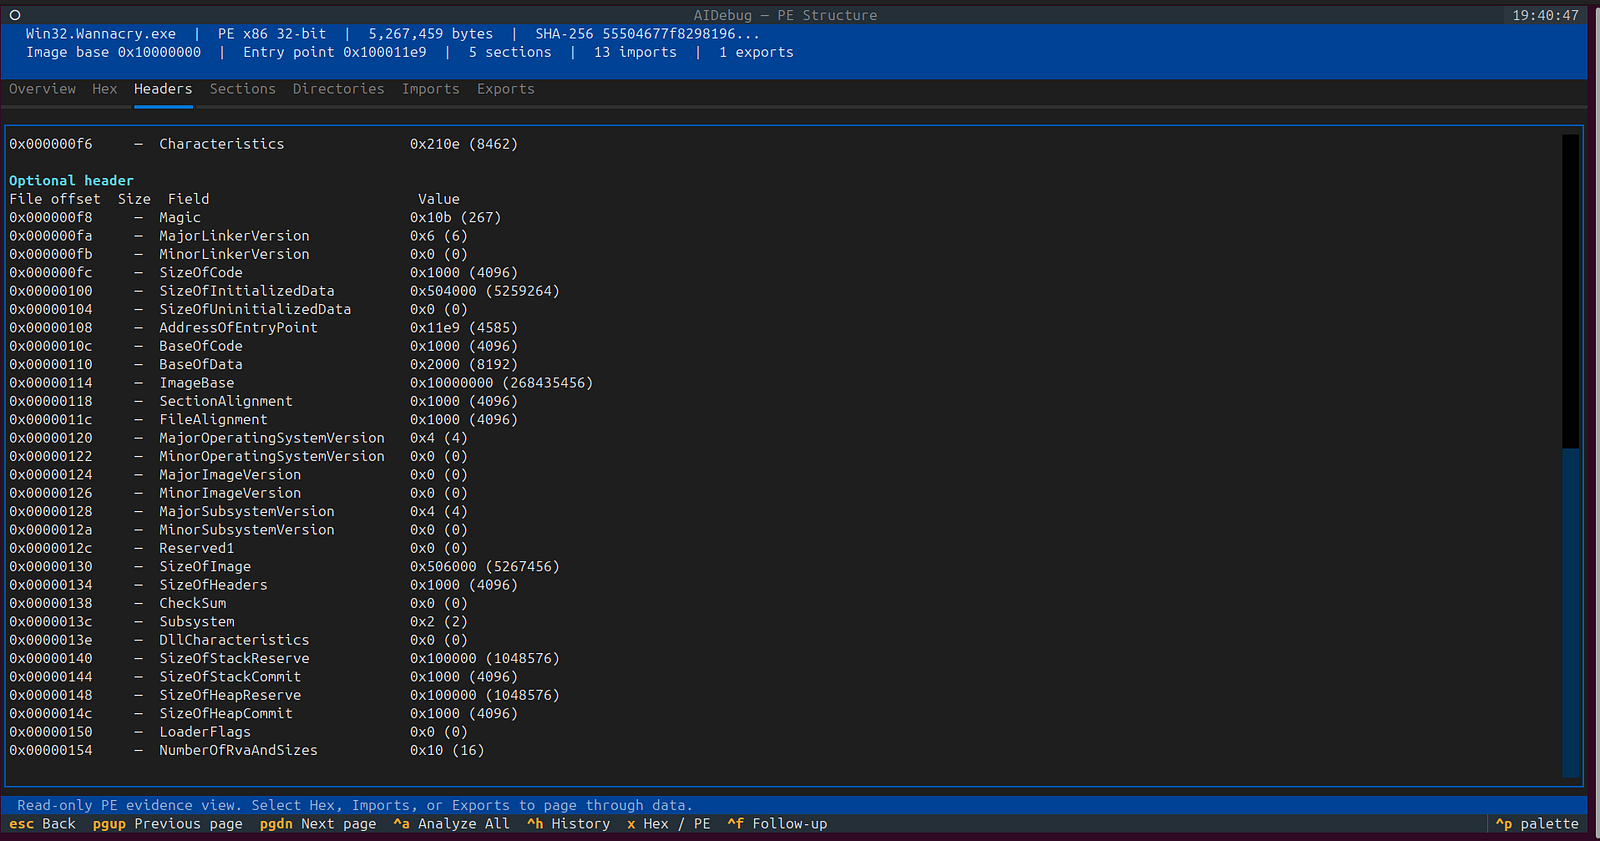
Figure 2 — The published AIDebug terminal interface. Historical screenshots are illustrative and are not accuracy evidence for the 3.1 commit.
For repeatable automation, skip the full-screen interface and create a bounded local evidence set:
mkdir -p reports/case-001

aidebug --binary /lab/case-001/sample.exe \
  --offline --no-tui --report --json-export --yara \
  --out-dir reports/case-001/
The generated YARA material is candidate content. Local compilation and broad-rule probes reduce obvious failures, but they do not establish acceptable false-positive performance. Test every candidate against a suitable benign corpus and representative related samples.
3. Inspect functions, patterns, and control flow
AIDebug starts from supported entry/export and symbol candidates, follows direct control flow within configured bounds, decodes instructions with Capstone, and enriches each recovered function with deterministic pattern and library hints.
The built-in pattern layer recognizes eight broad forms:
| Pattern | Why it is useful | Why it can be wrong |
|---|---|---|
| XOR loop | May locate decoding or data transformation | Ordinary checksums and transformations also use XOR |
| Stack string | May locate runtime-built text | Compilers and benign code write constants to local buffers |
| API hash resolution | May locate dynamic API lookup | Rotate/XOR loops have many legitimate uses |
| RDTSC timing check | May support anti-analysis review | Timing and profiling code also uses RDTSC |
| Direct syscall | May expose lower-level OS interaction | Syscalls are normal on Linux; Windows context changes severity |
| NOP sled | May show padding or alignment | Compiler alignment and patch space can look similar |
| Null-preserving XOR | May indicate shellcode-oriented encoding | The local sequence still needs operand and reachability review |
| Base64 alphabet reference | May identify an encoder or decoder | Merely referencing the alphabet does not prove decoded content or malicious use |
Use the CFG to answer structural questions: Where are the exits? Which branch dominates a call? Is a suspected decoder inside a loop? Does a string cross-reference sit on a reachable path?
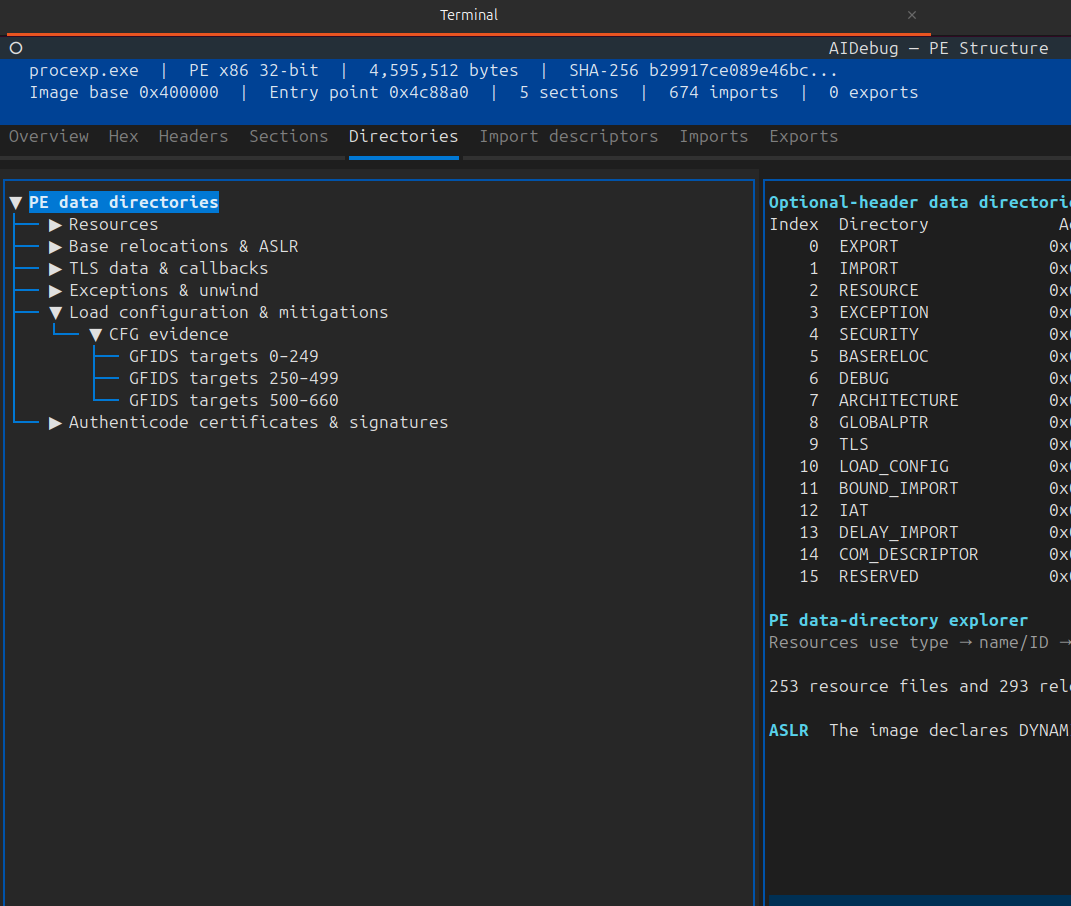
Figure 3 — Function-level control-flow visualization from the published AIDebug material. The graph represents recovered blocks, not guaranteed complete program control flow.
4. Read the PE as a mapped structure
Press X or P on a PE input to open the PE workspace. The important analytical habit is to keep three address vocabularies separate: file offset, relative virtual address (RVA), and virtual address (VA). A string at one file offset, an import slot at an RVA, and an instruction at a VA become useful only when the mappings are explicit.
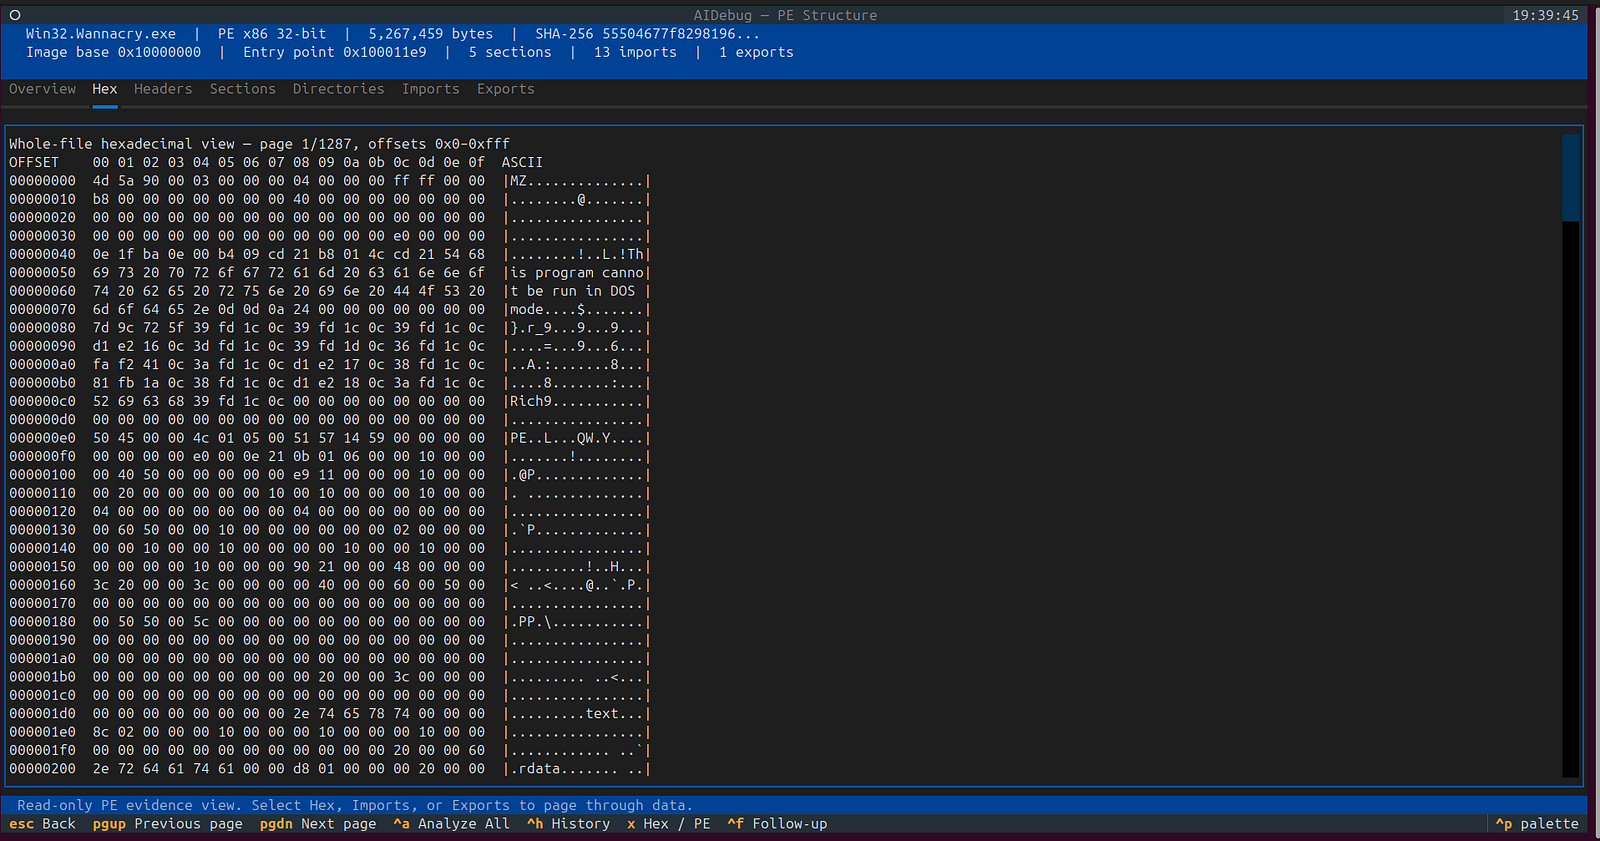
Figure 4 — The whole-file hex view reused from my published PE guide. It shows the exact byte-oriented workspace used to place higher-level parser findings.
The PE workspace covers:
- DOS, NT, COFF, and Optional Header fields;
- section headers, permissions, mapped ranges, and entropy;
- data directories;
- normal and delay imports, IAT/INT evidence, exports, ordinals, and forwarders;
- resources and safe no-overwrite extraction;
- base relocations and structural ASLR evidence;
- TLS directory, template data, index, and callbacks;
- x64 runtime-function and unwind records;
- load-configuration and Control Flow Guard fields;
- Authenticode certificate and image-digest evidence;
- Rich header, Debug Directory, CodeView, PDB, and build-provenance leads;
- overlay offset, size, hash, entropy, preview, and export; and
- CLR header, metadata streams, assemblies, references, resources, and strong-name metadata.
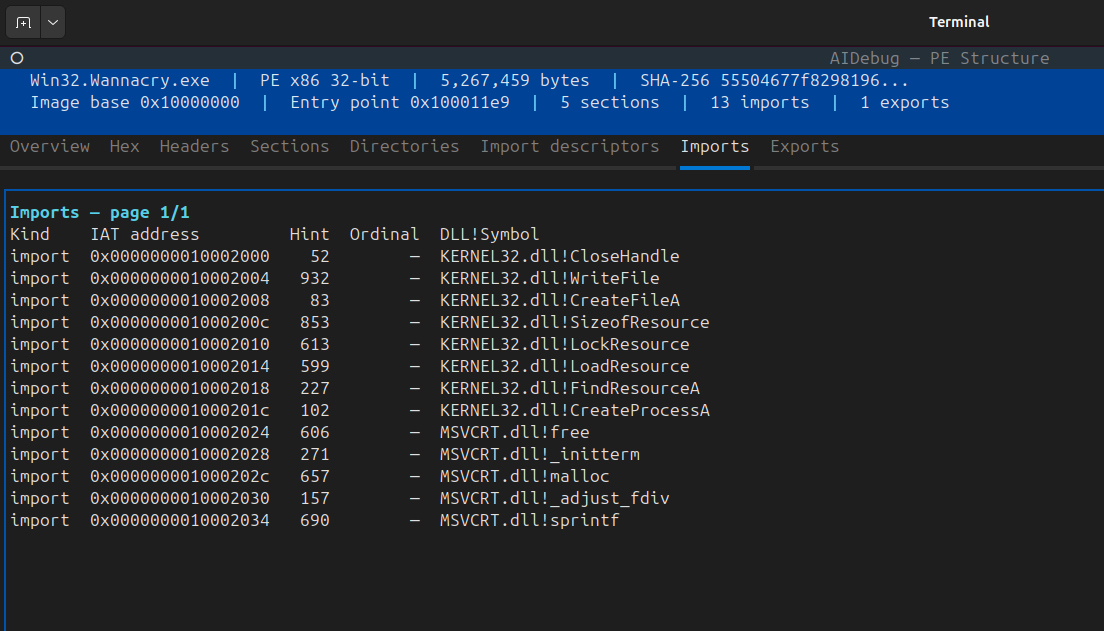
Figure 5 — Import and IAT evidence. An imported API supports a static capability hypothesis; it does not prove that a reachable call executed.
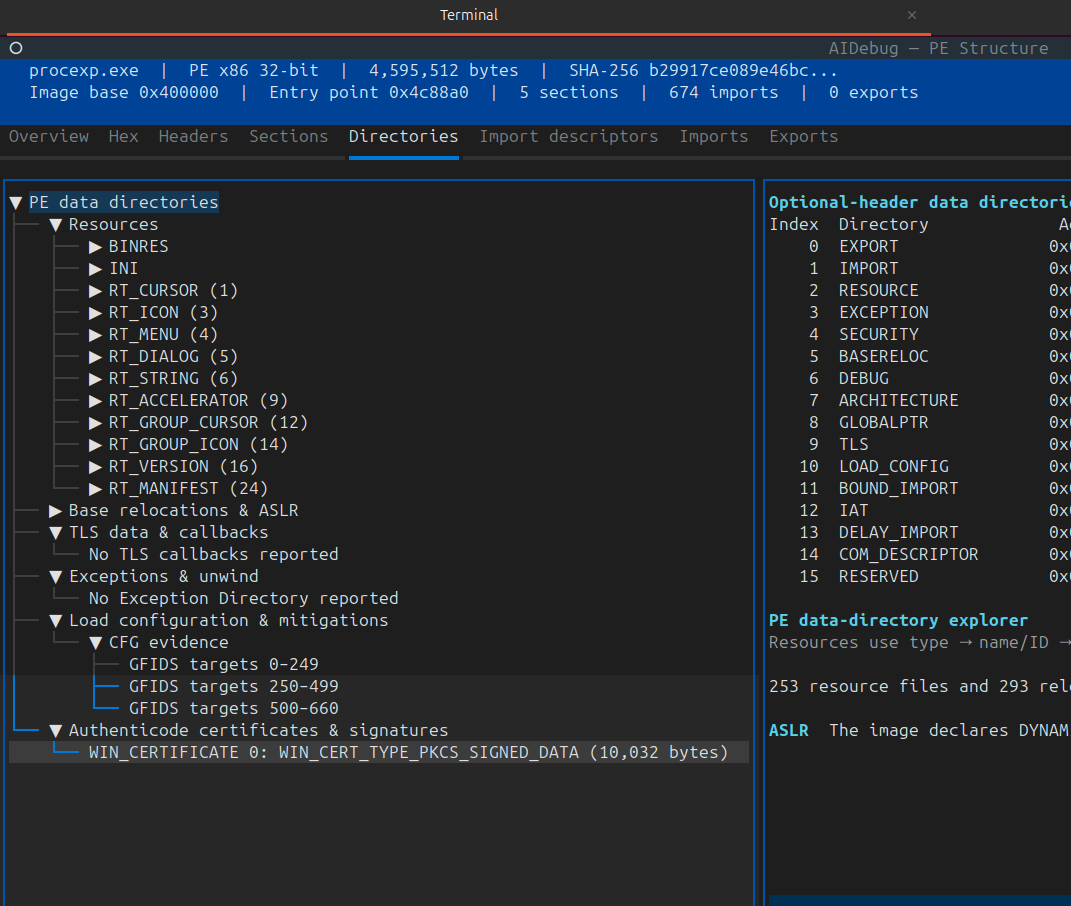
Figure 6 — Static Authenticode evidence. Cryptographic parsing and PE digest comparison are not equivalent to Windows root trust, revocation, reputation, or publisher innocence.
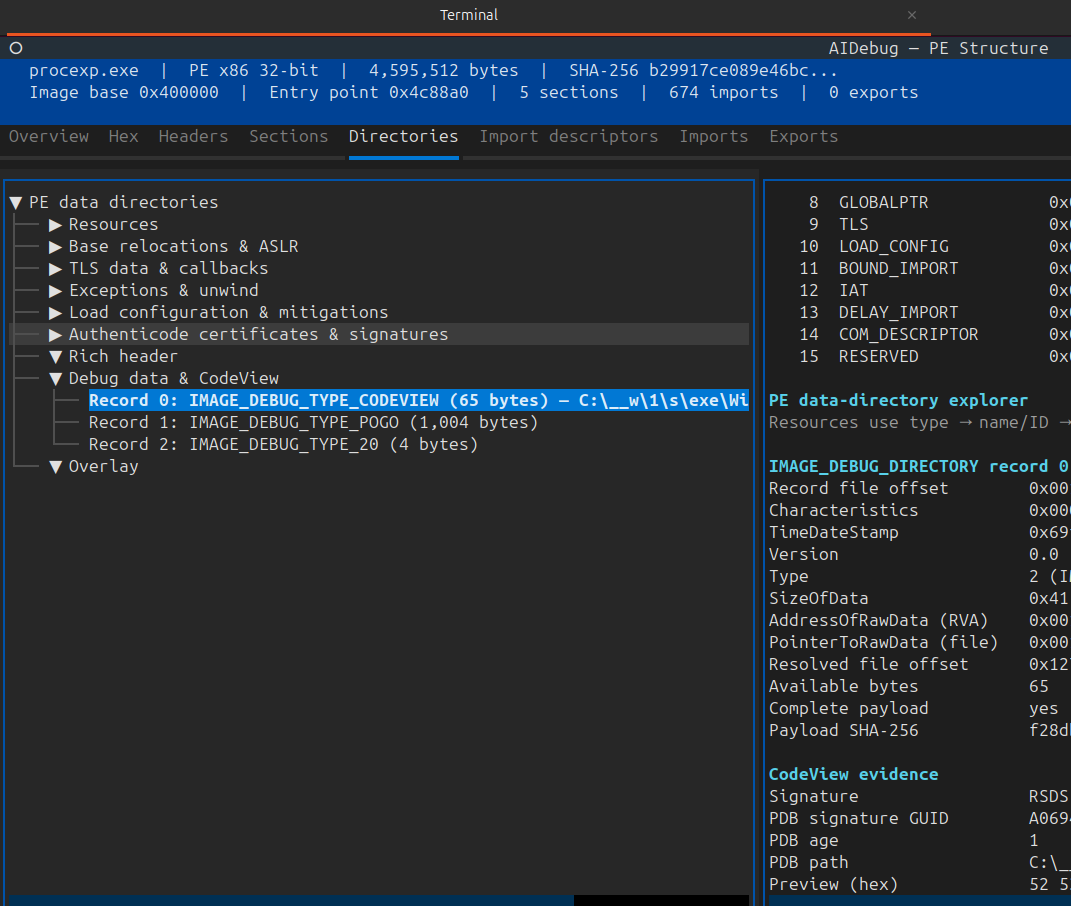
Figure 7 — Debug and overlay evidence. PDB paths, toolchain records, and overlay bytes are provenance and navigation leads, not attribution by themselves.
5. Use String Intelligence
Press S in the main interface or open the workspace directly:
aidebug --binary /lab/case-001/sample.exe --offline --strings
For CLI review and private JSON export:
aidebug --binary /lab/case-001/sample.exe \
  --offline --strings --no-tui \
  --string-encoding all --min-string-length 6 \
  --strings-output reports/case-001/sample-strings.json
The workspace supports minimum-length, encoding, category, and text filters, column sorting, pagination, detail inspection, category summaries, the canonical inventory, and a separate AI tab. Display filters do not rewrite the canonical extraction result.

Figure 8 — The overview preserves where a string was found and how it was encoded. That context is essential when following a lead back into code or a PE section.
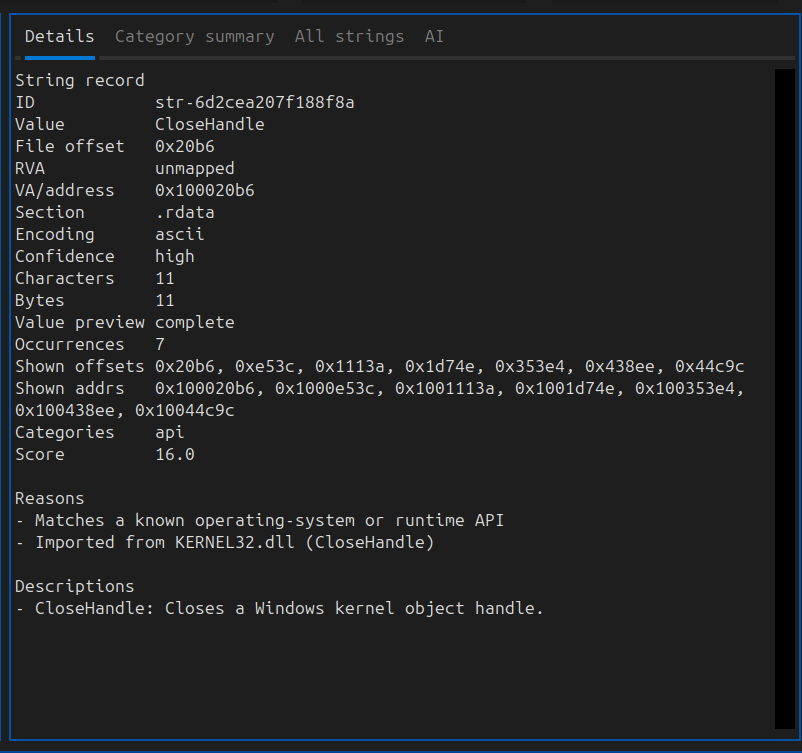
Figure 9 — Category filtering and detail view. Descriptions explain general DLL/API capability; they do not assert invocation or malicious intent.
Treat common categories as questions:
| Category | Question to ask next |
|---|---|
| URL/domain/IP | Is it a complete valid candidate, and is it referenced by reachable network code or observed at runtime? |
| Registry key | Which access mask, value name, data, hive, and code path are associated with it? |
| File path | Is it input, output, configuration, debug residue, a decoy, or an unused library string? |
| DLL/API | Is it an import, a raw candidate, a dynamically resolved symbol, or ordinary framework text? |
| Command/PowerShell | Is the command complete, decoded, reachable, and passed to a process-creation API? |
| Credential/token candidate | Is it a real secret, placeholder, format collision, or stale test material? Protect it before sharing. |
| Hash | Is it a whole-artifact identity, embedded reference, test value, or unrelated digest? |
| Anti-analysis/persistence | Which instructions and runtime events corroborate the static vocabulary? |
The 3.1 source caps the retained inventory at 25,000 records and stores at most 4,096 characters per value. It reports extracted, retained, omitted, and truncated coverage instead of silently presenting a partial list as complete. That distinction is particularly important for installers, runtimes, packed artifacts, and files containing large resource or overlay regions.
6. Reconstruct code with Ghidra
Ghidra headless integration can reconstruct one function or every function recovered within AIDebug's discovery ceiling:
aidebug --binary /lab/case-001/sample.exe \
  --offline --no-tui --decompile

aidebug --binary /lab/case-001/sample.exe \
  --offline --no-tui \
  --decompile-all reports/case-001/reconstruction.c
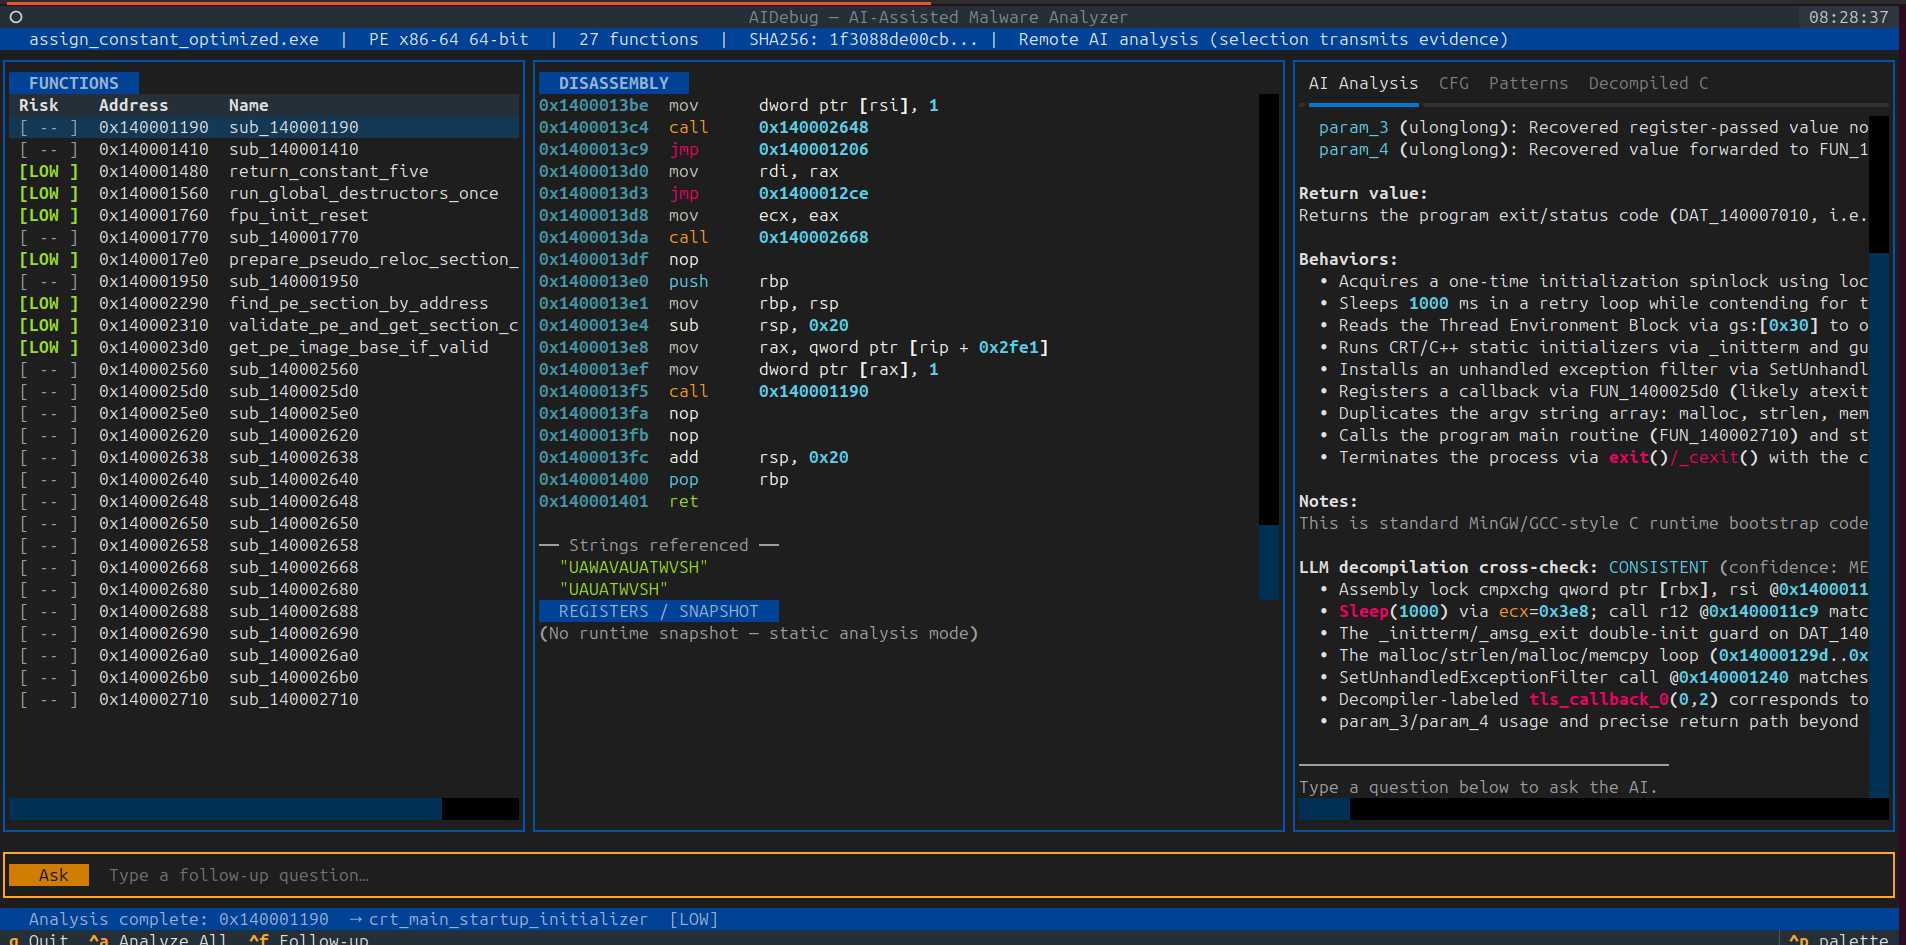
Figure 10 — Ghidra-backed reconstruction in the published assembly guide. C-like output is a model of machine-code behavior, not the original source, types, names, or expressions.
Use reconstruction to accelerate navigation, then return to disassembly for evidence. A misleading inferred type, combined expression, or structured loop can change the apparent meaning of a function. The tool preserves the underlying instructions so the analyst can resolve disagreements.
AIDebug can also analyze a single C translation unit:
aidebug --source /lab/fixtures/example.c --offline --no-tui
This path copies the selected source into a temporary directory, invokes an allowlisted compiler inside the documented Bubblewrap filesystem boundary, confirms the output is ELF, analyzes it, and removes the artifact. It does not execute the compiled program. Multi-file project builds and arbitrary project-local headers are deliberately outside the current boundary.
7. Use Learning Mode
Learning Mode connects source constructs to real compiler output and independent Ghidra reconstruction:
aidebug --learn
aidebug --learn mov-load
aidebug --learn lea-arithmetic
aidebug --learn switch-dispatch
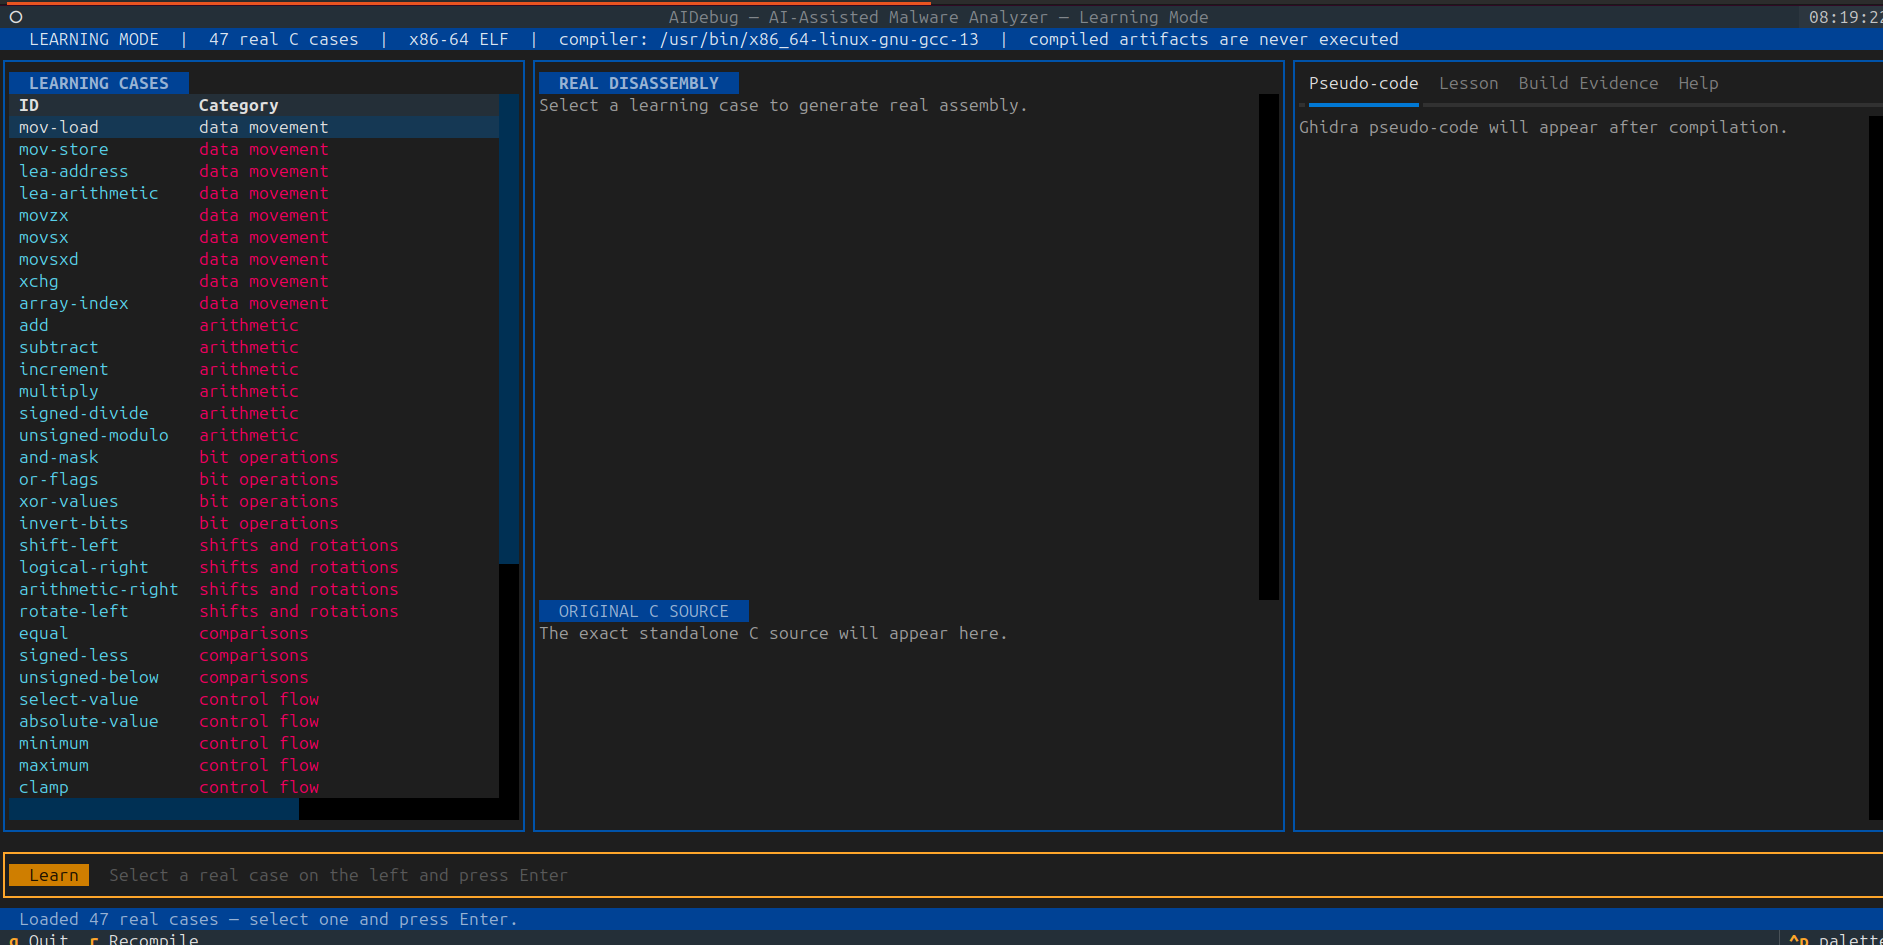
Figure 11 — The catalog contains 100 standalone C cases covering instruction semantics, control flow, buffers, parsers, structures, callbacks, and reverse-engineering patterns.
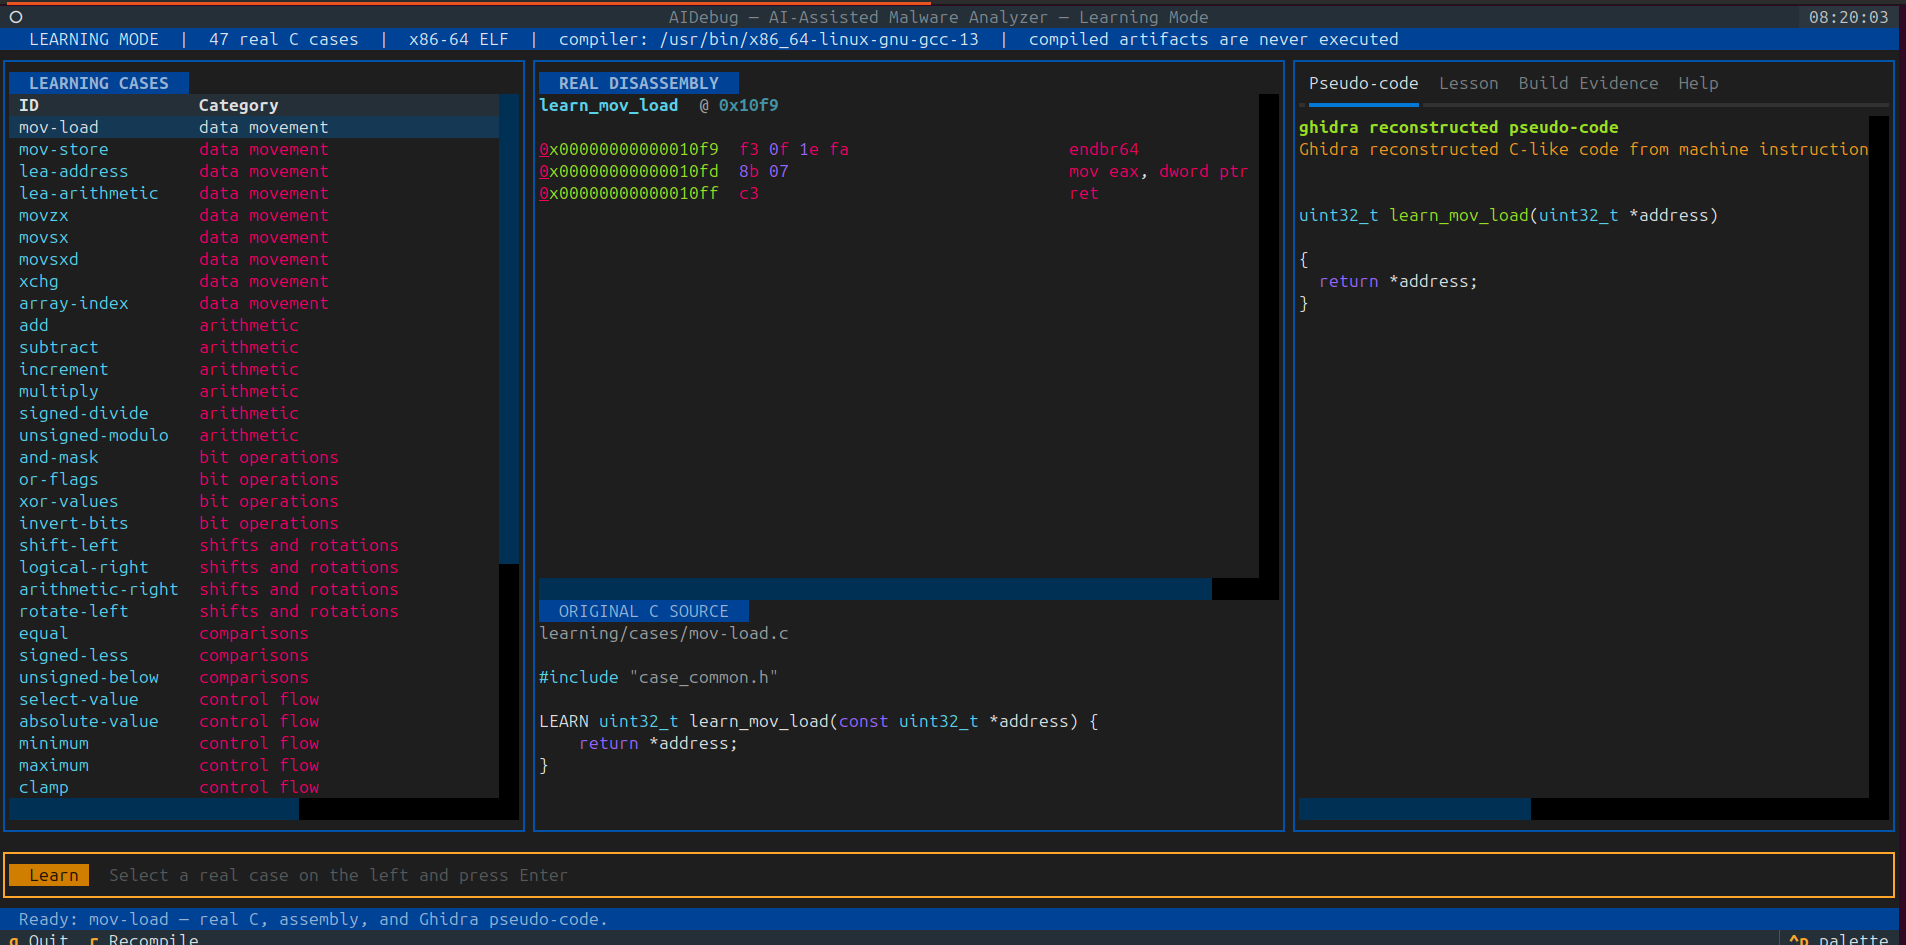
Figure 12 — A selected case places exact source, compiler-generated instructions, and Ghidra pseudo-code side by side. The temporary lesson binary is compiled for inspection and is not executed.
Use --no-tui for text output or --learning-collection for a reviewed external collection. External case directories are validated and may include a schema-versioned collection.json; they are still untrusted input and should be reviewed before compilation.
8. Preserve history and export findings
AIDebug stores session evidence in SQLite under the platform state directory by default. Query by the original file or its SHA-256:
aidebug --history /lab/case-001/sample.exe

aidebug --history \
  0123456789abcdef0123456789abcdef0123456789abcdef0123456789abcdef
Use a controlled per-case database when retention policy requires separation:
aidebug --binary /lab/case-001/sample.exe \
  --offline --db /lab/case-001/aidebug.sqlite
Reports serve different consumers:
| Output | Best use |
|---|---|
| HTML | Human review, case notes, and evidence navigation |
| Versioned AIDebug JSON | Custom adapters and downstream transformation |
| String Intelligence JSON | Canonical retained string records plus optional validated AI annotations and coverage |
| YARA candidates | Detection-engineering seeds after corpus testing |
| ATT&CK candidates | Behavior hypotheses after evidence validation |
| CFG | Function-level structural review |
| SQLite history | Local session continuity and compatible finding restoration |
The JSON is an AIDebug schema, not STIX or a vendor-native SIEM format. Session databases and exports are not encrypted by AIDebug and may contain paths, hashes, strings, disassembly, runtime context, and AI output. Apply case-specific access controls, retention, redaction, and deletion procedures.
Optional AI analysis
AI is an opt-in cross-check. The deterministic workflow remains usable without credentials.
Keep provider configuration outside untrusted sample directories:
mkdir -p "$HOME/.config/aidebug"
touch "$HOME/.config/aidebug/provider.env"
chmod 600 "$HOME/.config/aidebug/provider.env"
export AIDEBUG_ENV_FILE="$HOME/.config/aidebug/provider.env"
Configure one provider with a placeholder value, never a real key in documentation or shell history:
AIDEBUG_LLM_PROVIDER=anthropic
ANTHROPIC_API_KEY=replace_with_your_provider_key

# Alternatives:
# OPENAI_API_KEY=replace_with_your_provider_key
# GEMINI_API_KEY=replace_with_your_provider_key
# OLLAMA_BASE_URL=http://127.0.0.1:11434/v1
If more than one provider credential exists, set AIDEBUG_LLM_PROVIDER explicitly. The supported provider paths are Anthropic, OpenAI, Google Gemini through its OpenAI-compatible endpoint, and Ollama-compatible HTTP(S).
Function analysis may send filename, SHA-256, architecture, OS metadata, imports, bounded disassembly, bounded Ghidra output, referenced strings, cross-references, deterministic patterns, and optional runtime context. Bulk remote analysis requires --accept-ai-cost.
Whole-inventory string review is a separate and larger data boundary:
aidebug --binary /lab/case-001/sample.exe \
  --strings --no-tui --analyze-strings --accept-ai-cost \
  --strings-output reports/case-001/sample-strings-ai.json
Every retained record receives a stable ID and is planned across bounded chunks. Model responses must account for supplied IDs and pass local schema, enum, evidence-reference, entity, and type-specific IOC checks. Failed or unattempted chunks remain visible. Partial coverage forces an unknown aggregate assessment rather than a false low-concern conclusion.
Local Ollama receives special treatment only for literal loopback HTTP(S) endpoints. The local client ignores proxy environment variables and refuses redirects. Non-loopback Ollama endpoints are remote evidence transfers and require the same acknowledgement as other remote providers. Unix-socket endpoints are not supported by this transport.
These controls improve evidence discipline but do not change a provider's retention, training, billing, legal, or regional-processing terms. Strings can contain credentials, customer data, private paths, internal infrastructure, and attacker-authored instructions. Review and minimize the evidence before transmission.
Active ELF debugging and Frida instrumentation
Static analysis asks what the bytes support. Debugging asks what one execution did under specific conditions. AIDebug keeps those evidence classes separate.
GDB-backed ELF debugging
aidebug --binary /lab/case-001/sample.elf \
  --mode debug --breakpoint main
The active debugger supports breakpoints, continue, step, next, finish, register inspection, register changes, function input/output candidates, and local disassembly context. It launches the target under GDB/MI. AIDebug does not sandbox GDB or the inferior, so running unknown code on a normal workstation is unsafe.
Frida dynamic mode
Install the dynamic extra and attach only to an authorized local or lab target:
python -m pip install -e ".[dynamic]"

aidebug --binary /lab/case-001/sample.exe \
  --mode dynamic --pid 4242
The Frida workflows can record function/API hook readiness, bounded register and stack snapshots, selected memory-protection transitions, unpacking leads, and bounded socket/WinInet events. Remote frida-server can be specified with --frida-host for a controlled VM or sandbox.
Dynamic coverage is conditional. A zero-hook count may mean a watched module has not loaded. A missing event may mean the hook was late, the symbol was unavailable, a path did not execute, or the instrumentation failed. Network events are API-level telemetry, not packet capture, TLS decryption, or complete C2 reconstruction. Protection changes and prologue-shaped bytes are unpacking leads, not proof of a recovered original entry point.
Interpreting AIDebug output
The tool is strongest when every output is assigned an evidence level.
| AIDebug output | Safe statement | Unsupported leap |
|---|---|---|
| API/DLL string | “The name is present at this offset.” | “The sample called the API.” |
| Imported API | “The PE declares this import.” | “This capability executed.” |
| High section entropy | “The section has this measured distribution.” | “The file is packed malware.” |
| Pattern match | “This bounded instruction sequence matched the rule.” | “The function is malicious.” |
| ATT&CK candidate | “The evidence may support investigation of this technique.” | “The technique is confirmed.” |
| AI explanation | “The model proposed this interpretation from supplied evidence.” | “The AI proved the behavior.” |
| Ghidra output | “The decompiler reconstructed this C-like representation.” | “This is the original source.” |
| Debugger event | “The event occurred in this instrumented run.” | “The behavior always occurs.” |
| No event | “The observer recorded no matching event within known coverage.” | “The behavior is absent.” |
| YARA candidate | “The rule compiles and survived bounded broad-rule probes.” | “The rule is production-ready.” |
A practical evidence chain looks like this:
observed bytes/import/string
  → deterministic lead
  → code cross-reference and argument recovery
  → controlled runtime validation when needed
  → bounded finding with confidence and alternatives
  → IOC, YARA, ATT&CK, or detection candidate for review
Resource bounds and analytical limitations
Resource guards protect the analyst workstation; they also define coverage.
| Default bound in the 3.1 source | Value |
|---|---|
| Binary size | 128 MiB |
| C source size | 2 MiB |
| Retained string records | 25,000 |
| Stored characters per string | 4,096 |
| Symbols scanned | 100,000 |
| Import/export candidates retained | 50,000 each |
| Functions discovered | 300 |
| Instructions per function | 250 |
| Bulk functions analyzed by default | 25 |
| Dynamic function hooks | 50 maximum |
| Ghidra reconstruction per function | 12,000 characters |
| Persisted runtime/API/network records | 10,000 per category per session |
The important analytical limitations are:
- recursive descent is not exhaustive whole-binary recovery;
- indirect calls, packed code, overlays, stripped symbols, unusual compilers, and unsupported architecture details can reduce discovery;
- static addresses can differ from runtime addresses under ASLR, PIE, or rebasing;
- heuristic library signatures can collide;
- strings can be encrypted, compressed, constructed, fragmented, or absent;
- an IOC-looking string can be dormant, decoy, documentation, or test data;
- decompilation can infer the wrong types and control structures;
- remote AI can be incorrect even when its JSON is valid;
- dynamic instrumentation changes the environment and can miss activity; and
- local reports and history can retain sensitive evidence after an export is deleted.
These are reasons to preserve coverage and uncertainty, not reasons to discard automation. A bounded result is useful when the analyst can see where the bound applied.
Recommended end-to-end command sequence
This sequence keeps the first pass local and moves to higher-risk actions only when the evidence requires them:
# 1. Identify without trusting the extension.
aidebug --identify /lab/case-001/sample.bin --offline

# 2. Produce deterministic reports from the parsed PE/ELF.
aidebug --binary /lab/case-001/sample.bin \
  --offline --no-tui --report --json-export --yara \
  --out-dir reports/case-001/

# 3. Preserve the canonical string inventory.
aidebug --binary /lab/case-001/sample.bin \
  --offline --strings --no-tui --min-string-length 6 \
  --strings-output reports/case-001/sample-strings.json

# 4. Reconstruct recovered functions when Ghidra is available.
aidebug --binary /lab/case-001/sample.bin \
  --offline --no-tui \
  --decompile-all reports/case-001/reconstruction.c

# 5. Review prior sessions by immutable identity.
aidebug --history /lab/case-001/sample.bin
After those steps, decide whether a specific unresolved question justifies remote AI, GDB execution, or Frida instrumentation. Do not turn optional capabilities into a ritual. The next action should be the smallest one capable of confirming or rejecting the current hypothesis.
Release assessment
AIDebug 3.1 is a meaningful source-level release because String Intelligence is integrated with the same evidence model as the rest of the tool: bounded input, stable identity, location context, explicit coverage, deterministic first-pass classification, separate optional AI, and review-oriented output.
The release's strongest design choices are:
- deterministic offline analysis remains the default safe baseline;
- PE structure, strings, disassembly, CFG, and reconstruction can be correlated in one workflow;
- string records preserve occurrence and coverage data instead of flattening everything into a set;
- partial AI review fails closed to
unknown; - local Ollama classification considers the actual endpoint boundary;
- source analysis and learning cases are compiled for inspection without executing the result; and
- output language consistently separates candidates from confirmed behavior.
The main release caveat is operational rather than conceptual: 3.1.0 is merged but not yet available as an immutable GitHub tag or PyPI distribution. Until the version-matched release workflow completes, users must either stay on the published 3.0.0 package or deliberately pin the reviewed 3.1 commit. This review is limited to that merged commit and does not claim later development work.
Conclusion
AIDebug does not eliminate reverse engineering. It reduces the cost of building the first defensible map of an artifact.
The analyst can start with immutable file identity, place evidence inside PE or ELF structure, organize strings without losing offsets, follow cross-references into assembly, inspect control flow, compare Ghidra reconstruction with machine instructions, and move to controlled execution only when a question cannot be answered statically. Reports then carry the distinction between observed evidence, deterministic leads, model suggestions, runtime observations, and remaining unknowns.
That distinction is the real value of the release. A malware-analysis tool becomes trustworthy not when it produces the most labels, but when it makes clear what each label means, what evidence supports it, where coverage stopped, and what the analyst should validate next.
References
- AIDebug repository
- AIDebug 3.1 release notes in source
- AIDebug safety model
- AIDebug validation plan
- AIDebug releases
- 1200km-aidebug on PyPI
- Strings Analysis for Malware Analysis: Turning Binary Text into Defensible Hypotheses
- PE File Structure for Malware Analysis: A Practical Guide
- Assembly for Malware Analysis: A Practical x86/x64 Guide
- AI-Powered Malware Debugger That Explains Every Function It Sees
- Microsoft, Windows API documentation
- IANA, Root Zone Database
- Capstone Engine documentation
- NSA, Ghidra
- Frida documentation
- GDB documentation
- MITRE, ATT&CK
- VirusTotal, YARA documentation
Follow My Work
I publish practical cybersecurity research, CTI workflows, detection engineering notes, malware-analysis projects, AI-security research, open-source tools, labs, and technical guides.