AdversaryGraph v4.0: I Added a Full Malware Analysis Workbench to My Self-Hosted CTI Platform
This article documents an earlier product version or a time-bound state. It is retained for provenance and is not current product guidance. Open current AdversaryGraph documentation.
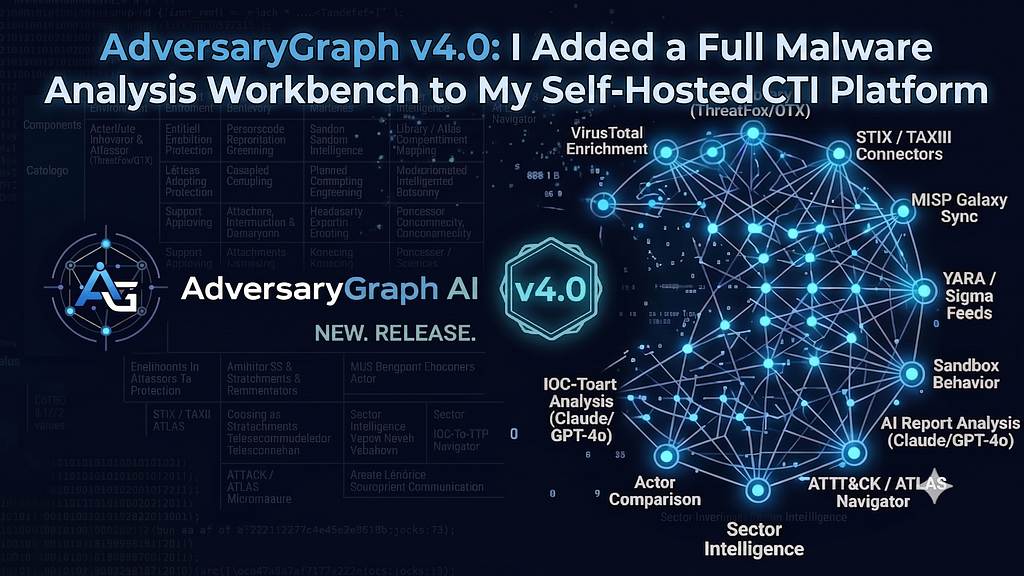
- Category: CTI
- Source article: https://infosecwriteups.com/adversarygraph-v4-0-i-added-a-full-malware-analysis-workbench-to-my-self-hosted-cti-platform-8dfbf1db2c9e
- Published: 2026-06-26
- Preserved media: 21 image(s), including cover images, screenshots, diagrams, and infographics where present.
- Preserved technical blocks: 25 code/configuration block(s).
Ecosystem Fit
This page mirrors the original Medium RSS article into the 1200km.com Docusaurus ecosystem. The article flow, images, screenshots, infographics, and technical blocks are preserved from the Medium feed.
Static triage, string extraction, AI full analysis, ATT&CK pivots, IOC enrichment, and detection engineering — all from one self-hosted workbench.
Malware analysis usually starts with a simple question:
What does this file do?
The problem is that the answer rarely lives in one place.
You upload a sample to one tool for hash reputation. You open another tool for strings. You use a disassembler for functions. You check imports somewhere else. You copy indicators into a CTI platform. You build ATT&CK notes in a spreadsheet. You write detection ideas in a separate editor. By the time you are done, the evidence trail is spread across tabs, logs, screenshots, and memory.
AdversaryGraph v4.0 is my attempt to close that gap.
This release turns AdversaryGraph from a CTI-to-detection workbench into a self-hosted malware analysis platform. It adds an integrated MalwareGraph service, case-based malware workflows, AI-assisted static and dynamic analysis, an IDA-style function debugger, clickable IOCs and ATT&CK pivots, and a new Knowledge Library for sector intelligence.
GitHub:
Release:
Release AdversaryGraph v4.0.0 · anpa1200/adversarygraph
Malware Analysis Guide:
adversarygraph/docs/malware-analysis-guide.md at main · anpa1200/adversarygraph
Table of Contents
- What AdversaryGraph Is
- Principles of Malware Research
- Static Analysis: What Can Be Learned Without Running the File
- Dynamic Analysis: What Must Be Observed at Runtime
- Why v4.0 Matters
- What Is New in v4.0
- AI-Assisted Malware Understanding
- Knowledge Library
- Architecture
- MalwareGraph as a Standalone Tool
- Malware Analysis Module Workflow
- Safety and Separated Dynamic Workflow
- Installation
- Example Workflow
- API Surface
- Security Model
- Release Validation
What AdversaryGraph Is
AdversaryGraph is a self-hosted CTI and detection engineering workbench.
The original goal was to keep analyst work connected:
report / log / IOC / malware sample
        ->
AI-assisted extraction and analyst review
        ->
ATT&CK mapping, IOC enrichment, actor comparison
        ->
detection drafts, reports, STIX/OpenCTI handoff
Version 4.0 adds malware samples as first-class evidence.
A file is no longer just an attachment or an external reference. It becomes a case. Its hashes, strings, imports, functions, ATT&CK leads, IOC candidates, AI notes, debug traces, and analyst decisions stay linked inside the same workspace.
Principles of Malware Research
Malware research is not only about deciding whether a file is good or bad.

The practical goal is to build an evidence-backed explanation:
- what the file is
- how it starts execution
- what code paths matter
- what capabilities it exposes
- what infrastructure or indicators it references
- what ATT&CK techniques are supported by evidence
- what still needs validation
- what defenders can detect or hunt
That distinction matters. A hash reputation hit is useful, but it does not explain behavior. A suspicious string is useful, but it does not prove execution. A decompiler view is useful, but it can be wrong when headers are malformed, code is packed, functions are misidentified, or control flow is intentionally confusing.
Good malware research moves through evidence layers:
file identity
  -> structural facts
  -> code and data artifacts
  -> behavior hypotheses
  -> runtime validation
  -> CTI and detection outputs
AdversaryGraph v4.0 is built around this model. It treats every result as part of an analyst workflow, not as a final answer by itself.
The platform separates three kinds of output:
- facts: hashes, file size, sections, imports, strings, entropy, runtime events
- hypotheses: possible family, possible ATT&CK technique, possible purpose of a function
- decisions: analyst-accepted IOCs, confirmed techniques, detection ideas, report text
AI belongs mostly in the second layer. It can connect evidence and explain likely meaning, but the analyst still needs to confirm whether the evidence is sufficient.
Static Analysis: What Can Be Learned Without Running the File

Static analysis studies the sample as data.
It is usually the safest starting point because it does not execute the malware. It can answer important questions quickly:
- Is this a PE, ELF, script, archive, document, or unknown blob?
- What are the hashes and file identifiers?
- Does the file look packed or obfuscated?
- Which imports and APIs are visible?
- Which strings, paths, domains, URLs, registry keys, mutexes, or commands appear?
- Are there embedded files, overlays, sections, or resources?
- Does the entrypoint point to normal code, a stub, a packed region, or something suspicious?
- Which ATT&CK techniques are suggested by the static artifacts?
The strength of static analysis is repeatability. The same bytes produce the same facts, and the analyst can review those facts without giving the sample a chance to act.
The weakness is coverage. Static analysis can miss behavior hidden behind:
- packing
- encryption
- dynamic API resolution
- anti-disassembly tricks
- malformed headers
- environment checks
- dead code
- delayed execution
- second-stage downloads
That is why the v4 workflow records validation gaps explicitly. If the platform can extract a string that looks like a command-and-control URL, that is useful. But if no code path proves the string is used at runtime, the system should say so.
Dynamic Analysis: What Must Be Observed at Runtime

Dynamic analysis studies what happens when the sample is allowed to execute in a controlled environment.
It is useful when the static view is incomplete or misleading. Runtime execution can show:
- process creation
- file writes and deletes
- registry changes
- network attempts
- DNS lookups
- API calls
- memory allocation and unpacking
- loaded modules
- injected code
- persistence attempts
- command execution
- branch decisions that only appear under specific conditions
The strength of dynamic analysis is proof of behavior. If a sample writes a file, opens a socket, resolves an API, or creates a process during a controlled run, the analyst has stronger evidence than a static guess.
The weakness is risk and incompleteness. Malware can detect sandboxes, require command-line arguments, wait for user interaction, sleep for long periods, check locale, check domain membership, or only run the malicious branch after a specific trigger.
That is why AdversaryGraph makes dynamic analysis explicit and policy-gated. Dynamic analysis is not a casual button. It requires configuration and analyst acknowledgement because runtime execution changes the threat model.
The intended workflow is:
static triage
  -> identify hypotheses and gaps
  -> prepare isolated runtime profile
  -> run or step selected behavior
  -> compare runtime evidence against static hypotheses
  -> update confidence, tags, IOCs, and next steps
The important part is the feedback loop. Dynamic analysis should not produce an isolated report that sits next to the static report. It should answer the questions static analysis could not prove.
Why v4.0 Matters
Most malware analysis tools are good at producing facts. The harder problem is turning those facts into reviewed intelligence.
For example:
- A string extractor can find URLs.
- A hash lookup can return reputation.
- A disassembler can show functions.
- A sandbox can produce runtime events.
- A CTI platform can store IOCs.
- ATT&CK Navigator can show techniques.
But an analyst still has to connect all of it.
AdversaryGraph v4.0 focuses on that connection layer.
Every extracted entity becomes actionable:
- hashes route to IOC Library and VirusTotal lookup
- IPs, domains, and URLs route to IOC Investigation
- ATT&CK technique IDs open Navigator
- actor and family leads open APT Library search
- CVEs open Knowledge Library
- accepted techniques can feed comparison and detection workflows
The goal is not to replace IDA Pro, Ghidra, CAPE, OpenCTI, or a SIEM. The goal is to keep the analyst’s reasoning chain intact.
What Is New in v4.0
The release has four major parts.
1. Malware Analysis Workbench

The new Malware Analysis page provides a case-based workflow for samples and archives.
It supports:
- raw executable uploads
- password-protected ZIP uploads
- extracted archive target selection


- first-pass static triage

- hash checking and feed enrichment


- strings, ASCII, and hex preview


- static unpacking


- runtime unpack planning

- obfuscation analysis

- AI full analysis

- debug sessions
- dynamic analysis workflows
- generated reports and workflow graph output
The first analysis view shows practical triage data:
- file type
- magic bytes
- SHA256 and other hashes
- entropy
- packer signals
- PE metadata
- extracted targets
- obfuscation hints
- hash reputation and feed results
This is designed for the first 10 minutes of a malware case: identify what you have, what is suspicious, and where to go next.
2. AI-Assisted Malware Understanding
AdversaryGraph v4.0 uses AI as analyst assistance, not as a verdict engine.
The AI workflows can help with:
- string classification
- IOC extraction
- ATT&CK technique hypotheses
- family leads
- behavior summaries
- suspicious function explanations
- next-step recommendations
- validation gaps
- detection ideas
The important word is hypotheses.
AI output is stored and displayed as untrusted analyst-assistance data. The UI repeatedly reminds the user that operational conclusions need validation. This matters because malware analysis often contains ambiguity: dead code, malformed headers, packer artifacts, import tricks, and static disassembly gaps.
The tool should make those gaps visible instead of hiding them.
3. Dynamic Analysis and AI Feedback Loops
Dynamic analysis is policy-gated and disabled by default.
To enable runtime execution, the deployment must explicitly set:
MALWAREGRAPH_ENABLE_DYNAMIC_DEBUG=true
The request must also set:
dynamic_analysis=true
runtime_debug_disclaimer_accepted=true
This is intentional. Malware samples should not execute casually on analyst infrastructure.
The Dynamic Analysis page now supports an AI feedback loop:
- Prepare an isolated runtime session.
- Load the full function workflow.
- Step one function or runtime point.
- Run AI against the new evidence.
- Record what changed: hypothesis, evidence, remaining gaps, next actions, confidence.
- Continue until the workflow completes or the analyst stops the loop.
This turns AI from a one-shot summary into a review cycle.
For example, if static analysis says:
The entrypoint appears to be 0x00400107, but runtime control flow is unproven.
The feedback loop can preserve that as a validation gap and drive the next step:
Disassemble and step the real entrypoint.
Resolve the IAT call target.
Confirm whether the call reaches msvcrt!printf.
Check whether execution touches another section or second stage.
The output is a history of evidence, not just a paragraph.
4. IDA-Style AI Debugger View
The debugger mode was rebuilt around function-level analysis.
It now behaves more like an analyst workspace:
- function trace list
- current function view
- graph view
- step function
- run all functions
- stop function run
- registers
- memory regions
- API hooks
- IOC and ATT&CK leads
- decompilation pane
- AI debug summary
Each function can be tagged:
- normal
- suspicious
- malicious
The AI assistant can explain:
- what the function appears to do
- why it is suspicious or normal
- which APIs or strings matter
- whether it looks like entrypoint logic, unpacking, C2, persistence, execution, or benign wrapper code
- what should be checked next
The whole workspace also gets a full AI debug summary:
- overall malware purpose
- behavior summary
- entrypoint assessment
- normal vs suspicious/malicious function counts
- suspicious functions
- ATT&CK techniques
- IOCs
- validation gaps
- recommended next steps
This is not a replacement for a professional reverse-engineering tool. It is a connected layer around function evidence so that the analyst can move from code facts to CTI and detection outputs without losing context.
OllyDbg CPU View

Malware Analysis Technology Stack
This is the actual stack used by the current implementation. The debugger view is IDA/OllyDbg-style, but IDA, Ghidra, and RetDec are not embedded.

Knowledge Library
v4.0 also adds a Knowledge Library.
It is a searchable, markdown-rendered repository for intelligence articles. The first dataset is focused on NVIDIA and AI infrastructure security:
- CVEs
- PSIRT advisories
- GHSA records
- threat actor profiles
- vendor reports
- research notes
- strategy documents
The important part is deep-linking.
When a Sector Pack mentions a CVE, the CVE opens Knowledge Library search. When a pack mentions a threat actor, the actor opens APT Library. When a technique is listed, it opens Navigator. These are small workflow details, but they reduce copy-paste and preserve analytic flow.
Architecture
AdversaryGraph v4.0 runs as a Docker Compose stack:
- React / Vite frontend
- FastAPI backend
- PostgreSQL
- Redis
- Celery
- MalwareGraph service
- isolated MalwareGraph internal Docker network
The Malware Analysis module is not just a React page attached to the old CTI application. It is a separate malware workflow built into AdversaryGraph through a service boundary.
At a high level, the module has five layers:
Analyst UI
  -> Malware Analysis, Dynamic Analysis, Debugger, String Analyzer, IOC pivots
AdversaryGraph API
  -> auth, request validation, case context, MalwareGraph proxy, CTI routing
MalwareGraph analysis service
  -> sample intake, first analysis, strings, unpacking, decompilation,
     debug workspace, dynamic workflow state, AI malware summaries
Storage and queues
  -> PostgreSQL, Redis, Celery, local artifacts, analysis records
Optional isolated runtime profile
  -> disposable sandbox/debug container or VM profile, fake internet,
     telemetry capture, runtime evidence collection
The frontend does not talk directly to MalwareGraph. Requests go through the AdversaryGraph backend:
frontend
  -> /api/malwaregraph/*
  -> FastAPI proxy
  -> MalwareGraph internal service
The MalwareGraph service is not exposed on the host by default. It runs on an internal network and is intended to keep sample handling separated from the main application surface.
That split is important. The normal CTI platform should not be the component that directly handles malware execution decisions. AdversaryGraph owns the investigation workspace, user workflow, CTI pivots, ATT&CK mapping, IOC review, and report generation. MalwareGraph owns malware-specific processing and returns structured evidence that the platform can display and route.
The architecture follows a simple separation of responsibilities:
React UI
  -> analyst workflow, case navigation, debugger panes, report views
FastAPI backend
  -> authentication boundary, API proxy, CTI workflows, enrichment routing
MalwareGraph service
  -> sample handling, static analysis, dynamic/debug workflow state, decompilation data
PostgreSQL and Redis
  -> application state, task coordination, cached analysis context
Celery workers
  -> long-running jobs, enrichment tasks, report generation, background processing
The main application owns the analyst experience. MalwareGraph owns the malware-specific processing. The proxy boundary keeps the frontend from directly reaching the malware service and gives the backend one place to enforce policy, logging, and request shape.
MalwareGraph as a Standalone Tool
MalwareGraph can also run as a standalone malware-analysis workbench.
In standalone mode, it is useful when an operator wants the malware analysis backend without the full AdversaryGraph CTI workspace. It can expose its own API for upload, job status, analysis artifacts, report output, and optional enrichment connectors.
The important design requirement is that standalone MalwareGraph still produces the same graph-ready result shape used by AdversaryGraph:
analysis job
  -> sample identity
  -> files and extracted targets
  -> hashes and IOCs
  -> strings and decoded artifacts
  -> functions and code evidence
  -> behaviors
  -> ATT&CK candidates
  -> AI assistance
  -> validation gaps
  -> report artifacts
That means standalone results can later be imported into AdversaryGraph without converting a flat report by hand.
The standalone service model is:
malware-api
  -> upload, job status, artifact download, result API
Integrated mode uses the same underlying MalwareGraph capability, but AdversaryGraph adds the analyst-facing CTI layer. Every hash, URL, domain, IP, ATT&CK technique, family lead, behavior, and function can become a clickable object in the wider investigation.
Malware Analysis Module Workflow
The malware workflow is case-oriented:
case
  -> sample
  -> extracted files
  -> first analysis
  -> enrichment
  -> decompilation
  -> debug workspace
  -> dynamic steps
  -> AI summaries
  -> report and CTI pivots
malware-worker-static
  -> metadata, hashes, file type, entropy, imports, sections, strings,
     YARA-style matches, packer hints, safe extraction
malware-worker-re
  -> disassembly metadata, decompilation, function list, call graph,
     function tags, debugger notes
malware-worker-ai
  -> prompt construction, string classification, behavior summary,
     ATT&CK mapping, IOC normalization, report draft
malware-storage
  -> quarantined samples, generated artifacts, reports, evidence
optional malware-sandbox
  -> dynamic execution profile, debug stepping, telemetry collection
That structure is important because malware research is rarely linear. An analyst may start from a hash, jump to strings, inspect a function, return to imports, check runtime behavior, then update the summary. The platform keeps those artifacts under the same case so the investigation can move without losing context.
AI providers are also behind the backend and MalwareGraph workflow instead of being treated as a direct frontend feature. This keeps prompts tied to the evidence currently visible in the case: file facts, strings, imports, function summaries, runtime steps, and analyst-selected context.
The design goal is not to hide complexity. The goal is to make the complexity navigable:
- static facts stay visible
- dynamic evidence is labeled as runtime evidence
- AI text is labeled as analyst assistance
- validation gaps stay attached to the case
- IOCs and ATT&CK leads can pivot into the wider CTI workspace
Safety and Separated Dynamic Workflow
The default MalwareGraph workflow is static-only.
That is a deliberate safety decision. Static analysis can inspect bytes, headers, strings, imports, entropy, and code metadata without giving the sample a chance to run. Dynamic analysis changes the risk model because it executes or emulates behavior from an untrusted file.
For that reason, dynamic workflow support is separated and gated:
normal AdversaryGraph containers
  -> frontend, API, database, Redis, worker
MalwareGraph static analysis service
  -> sample intake, static triage, strings, decompilation, AI summaries
isolated dynamic profile
  -> disposable runtime boundary for execution, debug stepping,
     telemetry capture, fake internet or blocked network
Dynamic analysis requires explicit operator configuration:
MALWAREGRAPH_ENABLE_DYNAMIC_DEBUG=true
The analyst request must also explicitly ask for dynamic analysis and accept the runtime-debug disclaimer. This prevents a static triage action from accidentally becoming an execution action.
The intended safety posture is:
- samples are not mounted into the main AdversaryGraph containers
- MalwareGraph runs behind an internal service boundary
- the frontend never talks directly to the malware service
- static workers should have no outbound internet by default
- runtime execution should run only in a disposable sandbox, VM, microVM, or equivalent isolated profile
- dynamic runs should not have access to PostgreSQL, Redis, the host LAN, metadata services, or production networks
- fake internet, sinkhole, or blocked-network modes are preferred over unrestricted outbound access
- each dynamic run should have CPU, memory, process, file-size, and time limits
- dynamic artifacts are copied out as evidence, not mounted back into trusted application containers
- the runtime boundary should be reset after every sample
A plain Docker container is useful for packaging and process separation, but it should not be treated as a complete malware containment boundary by itself. For real malware, dynamic execution belongs in a disposable sandbox profile with no route to production assets.
This is why the UI marks dynamic evidence separately from static evidence. If a result came from runtime execution, it should be labeled as runtime evidence. If a result came from AI interpretation, it should be labeled as analyst assistance. If a behavior is only inferred from strings or imports, it should remain a hypothesis until runtime or code-path evidence supports it.
Installation
Clone the repository:
git clone https://github.com/anpa1200/adversarygraph.git
cd adversarygraph
Create an environment file:
cp .env.example .env
Configure at least one AI provider:
ANTHROPIC_API_KEY=
OPENAI_API_KEY=
GEMINI_API_KEY=
MINIMAX_API_KEY=
LOCAL_LLM_BASE_URL=http://host.docker.internal:11434/v1
LOCAL_LLM_API_KEY=local
LOCAL_LLM_MODEL=llama3.1:8b
Optional enrichment:
VIRUSTOTAL_API_KEY=
THREATFOX_AUTH_KEY=
OTX_API_KEY=
Start the stack:
docker compose up -d
Open:
http://localhost:3000
Check service health:
docker compose ps
curl http://localhost:3000/
Inside the app, open Malware Analysis and create a case.
Example Workflow
A typical v4.0 malware investigation looks like this:
- Create a case with a case name and case ID.
- Upload a raw sample or password-protected ZIP.
- Review first-analysis triage.
- Check hash reputation and feeds.
- Inspect strings and file preview.
- Run AI string classification.
- Unpack if entropy or packer hints suggest a wrapper.
- Run AI full analysis on the original or unpacked target.
- Open the debugger workspace.
- Step through functions.
- Run full AI debug summary.
- Review normal/suspicious/malicious function tags.
- Use the AI feedback loop to close validation gaps.
- Pivot IOCs and ATT&CK leads into AdversaryGraph.
- Export detection and reporting artifacts.
The key difference is continuity.
The sample, the functions, the ATT&CK leads, the IOCs, and the report all belong to the same case.
API Surface
The MalwareGraph proxy exposes endpoints for:
GET  /api/malwaregraph/health
GET  /api/malwaregraph/llm/providers
POST /api/malwaregraph/llm/complete
GET  /api/malwaregraph/analyses
POST /api/malwaregraph/analyses
GET  /api/malwaregraph/analyses/{job_id}
GET  /api/malwaregraph/analyses/{job_id}/report
GET  /api/malwaregraph/analyses/{job_id}/workflow-graph
GET  /api/malwaregraph/analyses/{job_id}/strings
GET  /api/malwaregraph/analyses/{job_id}/files/preview
POST /api/malwaregraph/analyses/{job_id}/unpack
POST /api/malwaregraph/analyses/{job_id}/unpack/runtime
POST /api/malwaregraph/analyses/{job_id}/obfuscation-analysis
POST /api/malwaregraph/analyses/{job_id}/ai-full-analysis
POST /api/malwaregraph/analyses/{job_id}/decompilation
POST /api/malwaregraph/analyses/{job_id}/debug-workspaces
GET  /api/malwaregraph/debug-workspaces/{session_id}
POST /api/malwaregraph/debug-workspaces/{session_id}/step
POST /api/malwaregraph/debug-workspaces/{session_id}/ai-assistant
POST /api/malwaregraph/runtime-debug-sessions/{session_id}/step
There are also Knowledge Library endpoints:
GET  /api/knowledge/articles
GET  /api/knowledge/articles/{id}
GET  /api/knowledge/stats
POST /api/knowledge/seed
Security Model
Malware analysis tools need clear boundaries.
AdversaryGraph v4.0 follows a conservative default:
- static analysis is default
- dynamic analysis is disabled unless explicitly enabled
- runtime debug requires explicit analyst acknowledgement
- MalwareGraph runs on an isolated internal network
- AI output is treated as analyst assistance, not a verdict
- findings must be validated before operational use
For real malware, run this in a disposable environment. Do not connect a dynamic-analysis deployment to production networks, production databases, or shared infrastructure.
What This Release Is Not
AdversaryGraph v4.0 is not:
- a SIEM
- an EDR
- an attribution engine
- a fully automated malware verdict system
- a replacement for IDA Pro, Ghidra, x64dbg, CAPE, or Cuckoo
- a replacement for OpenCTI or MISP
It is a workbench for the middle of the analysis process: where raw evidence becomes reviewed CTI, ATT&CK mappings, IOCs, detection ideas, and reports.
Release Validation
The release includes:
- version set to 4.0.0
- MalwareGraph integrated into the Docker Compose stack
- React Malware Analysis dashboard
- AI full analysis workflows
- dynamic analysis workflow
- AI feedback loop
- IDA-style AI debugger view
- Knowledge Library
- NVIDIA Sector Pack deep-links
- release notes and release summary
- production frontend build validation
- backend test validation
Current CI on main is green.
Final Thoughts
The point of v4.0 is not to make malware analysis magical.
The point is to make the evidence chain harder to lose.
Analysts still need to validate. They still need to check imports, disassembly, runtime behavior, IOCs, ATT&CK mappings, and detection logic. But the workspace should help them preserve that reasoning instead of scattering it across tools.
That is what AdversaryGraph v4.0 adds: a connected path from malware sample to CTI and detection engineering.
If you work with self-hosted CTI, detection engineering, or malware triage, this release is the first version of AdversaryGraph where the malware workflow is a real part of the platform.
GitHub:
https://github.com/anpa1200/adversarygraph
Release:
https://github.com/anpa1200/adversarygraph/releases/tag/v4.0.0
Documentation:
/adversarygraph-docs/Project hub:
/adversarygraph/Medium: