
Artificial intelligence is now present in almost every discussion about cybercrime, state activity, fraud, phishing, malware, vulnerability research, and autonomous intrusion. The difficult analytical problem is no longer finding claims. It is separating observed attacker behavior from forecasts, controlled demonstrations, provider-abuse telemetry, vendor narrative, and repeated coverage of the same campaign.
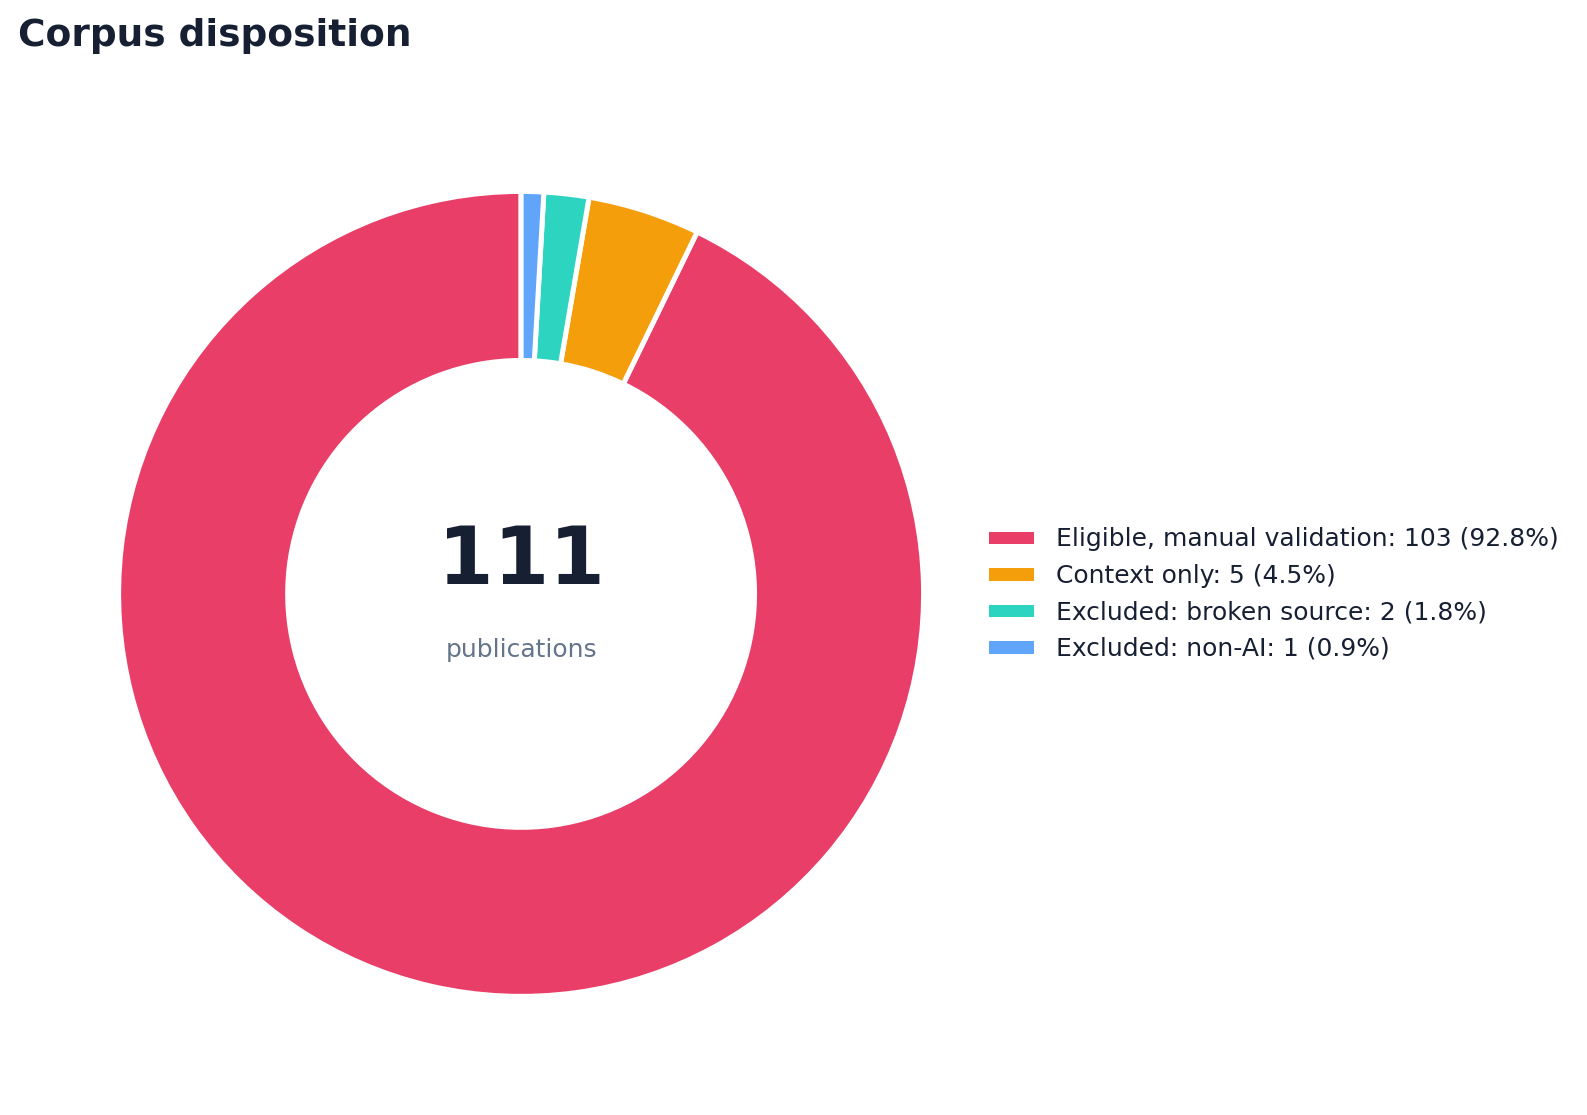
This study converts 116 retrieved source records into 111 deduplicated publications and a normalized research dataset. The main statistical denominator is 103 publications assessed as relevant to attacker use of AI but still requiring analyst validation. Five contextual publications are kept outside the denominator, two broken source pages are excluded, and one non-AI report is excluded. The result is not an incident census. It is a map of what the collected evidence discusses, how often topics co-occur, and where the source base is mature or weak.
The companion interactive dashboard contains more than 30 widgets, heatmaps, ranked distributions, and a filterable publication explorer. The searchable References library links all 108 usable publications through normalized discovery facets. The underlying dataset README, CSV tables, SQLite database, and Excel workbook make every chart reproducible from the published normalized snapshot.
Scope and evidence boundary: The unit of analysis is a publication, not an incident, victim, intrusion, account, prompt, or malware sample. A publication can cover multiple incidents, and one incident can appear in multiple publications. All extracted tags, metrics, IOCs, actors, ATT&CK candidates, countries, sectors, CVEs, providers, and models require human validation against the canonical publisher source or the private working evidence record. At this published snapshot, all 111 analyst-review rows remain uncompleted. No chart proves attribution, successful exploitation, provider-specific abuse, or global prevalence.
Table of contents
- Executive findings
- Research question and evidence model
- Corpus construction and quality
- Temporal and source landscape
- How AI is described in cyberattacks
- Intrusion lifecycle and ATT&CK coverage
- Threat actors, targets, sectors, and geography
- LLM providers, models, and malicious-AI brands
- Attack vectors, infrastructure, data, and impact
- Quantitative metrics, IOCs, and CVEs
- Cross-dimensional analysis
- What defenders should do with these findings
- Explore the connected research ecosystem
- Limitations and reproducibility
- Conclusion
- References
- Follow My Work
Executive findings
The corpus produces seven defensible high-level findings:
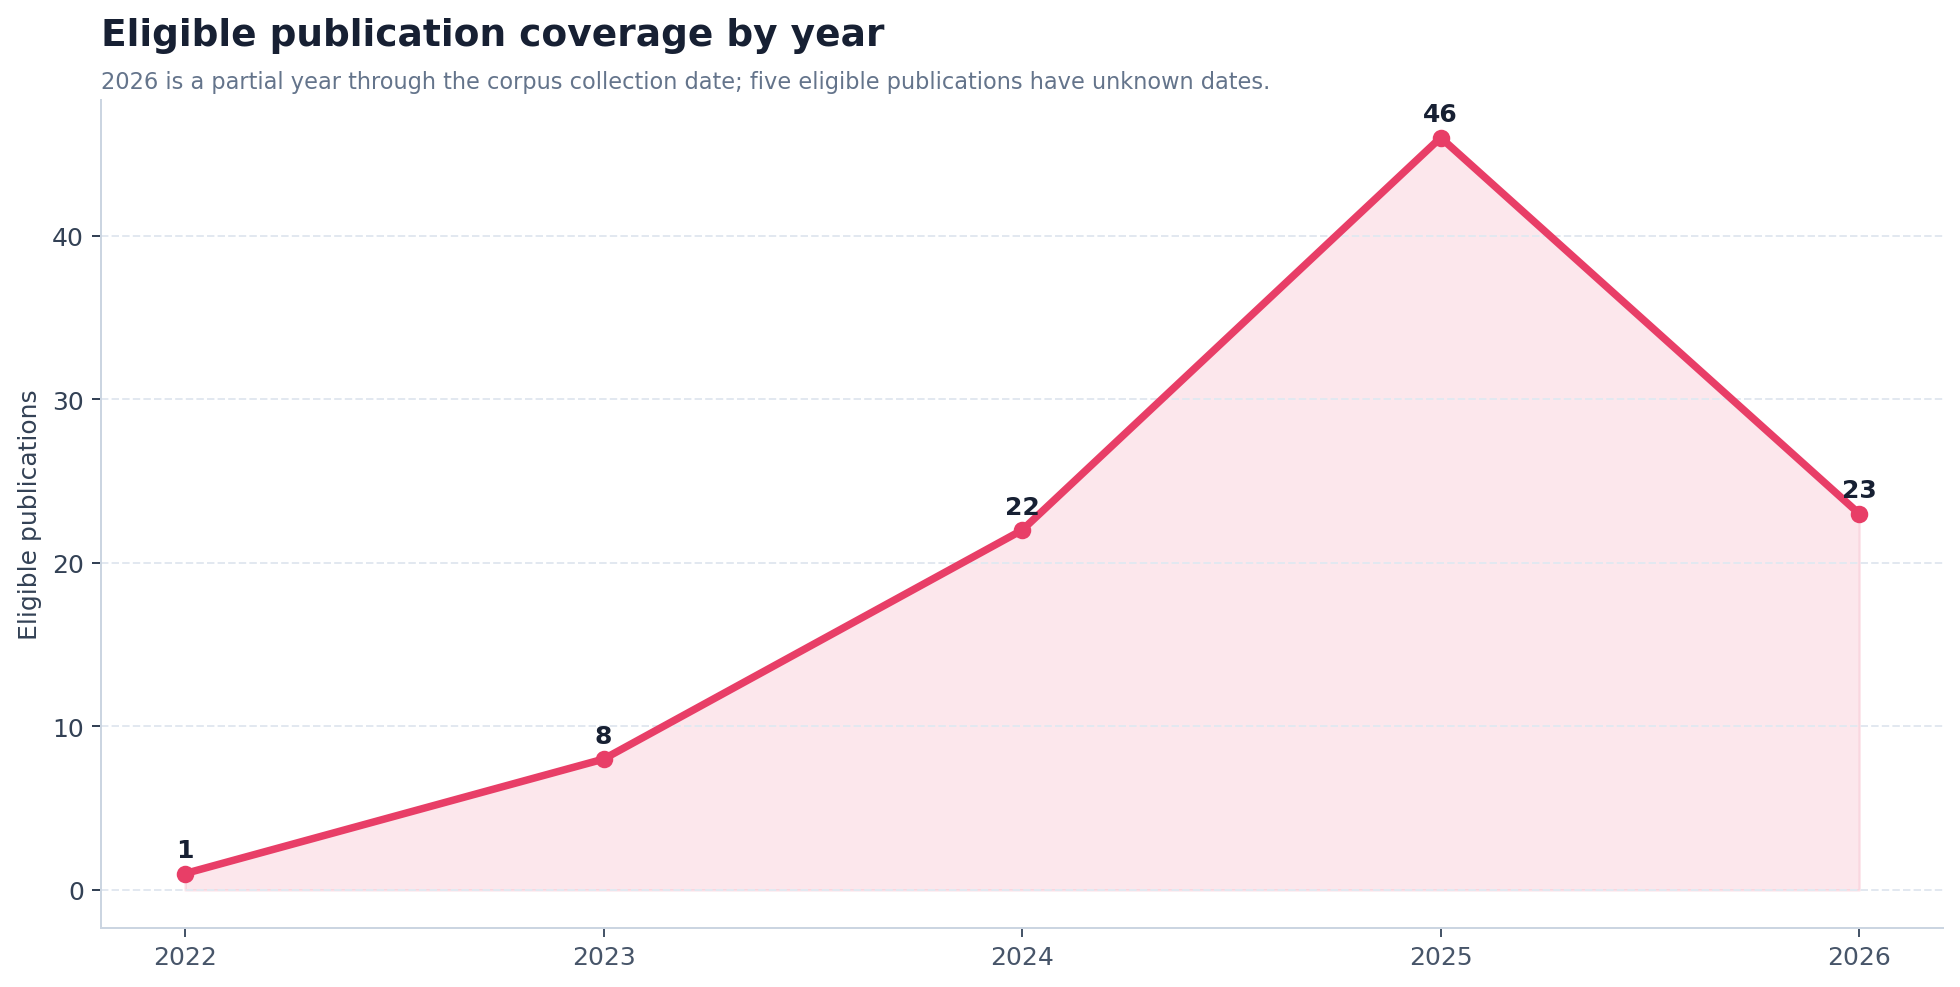
- Reporting is concentrated in 2024–2026. Of 100 eligible publications with a known year, 46 are dated 2025. This is publication volume, influenced by collection scope and publisher activity; it is not a measured growth rate for attacks.
- AI is described across the full intrusion lifecycle. Actions on Objectives appears in 90 publications, Exploitation in 77, Delivery in 75, and Reconnaissance in 47. The breadth supports treating AI as a cross-workflow accelerator rather than a single technique.
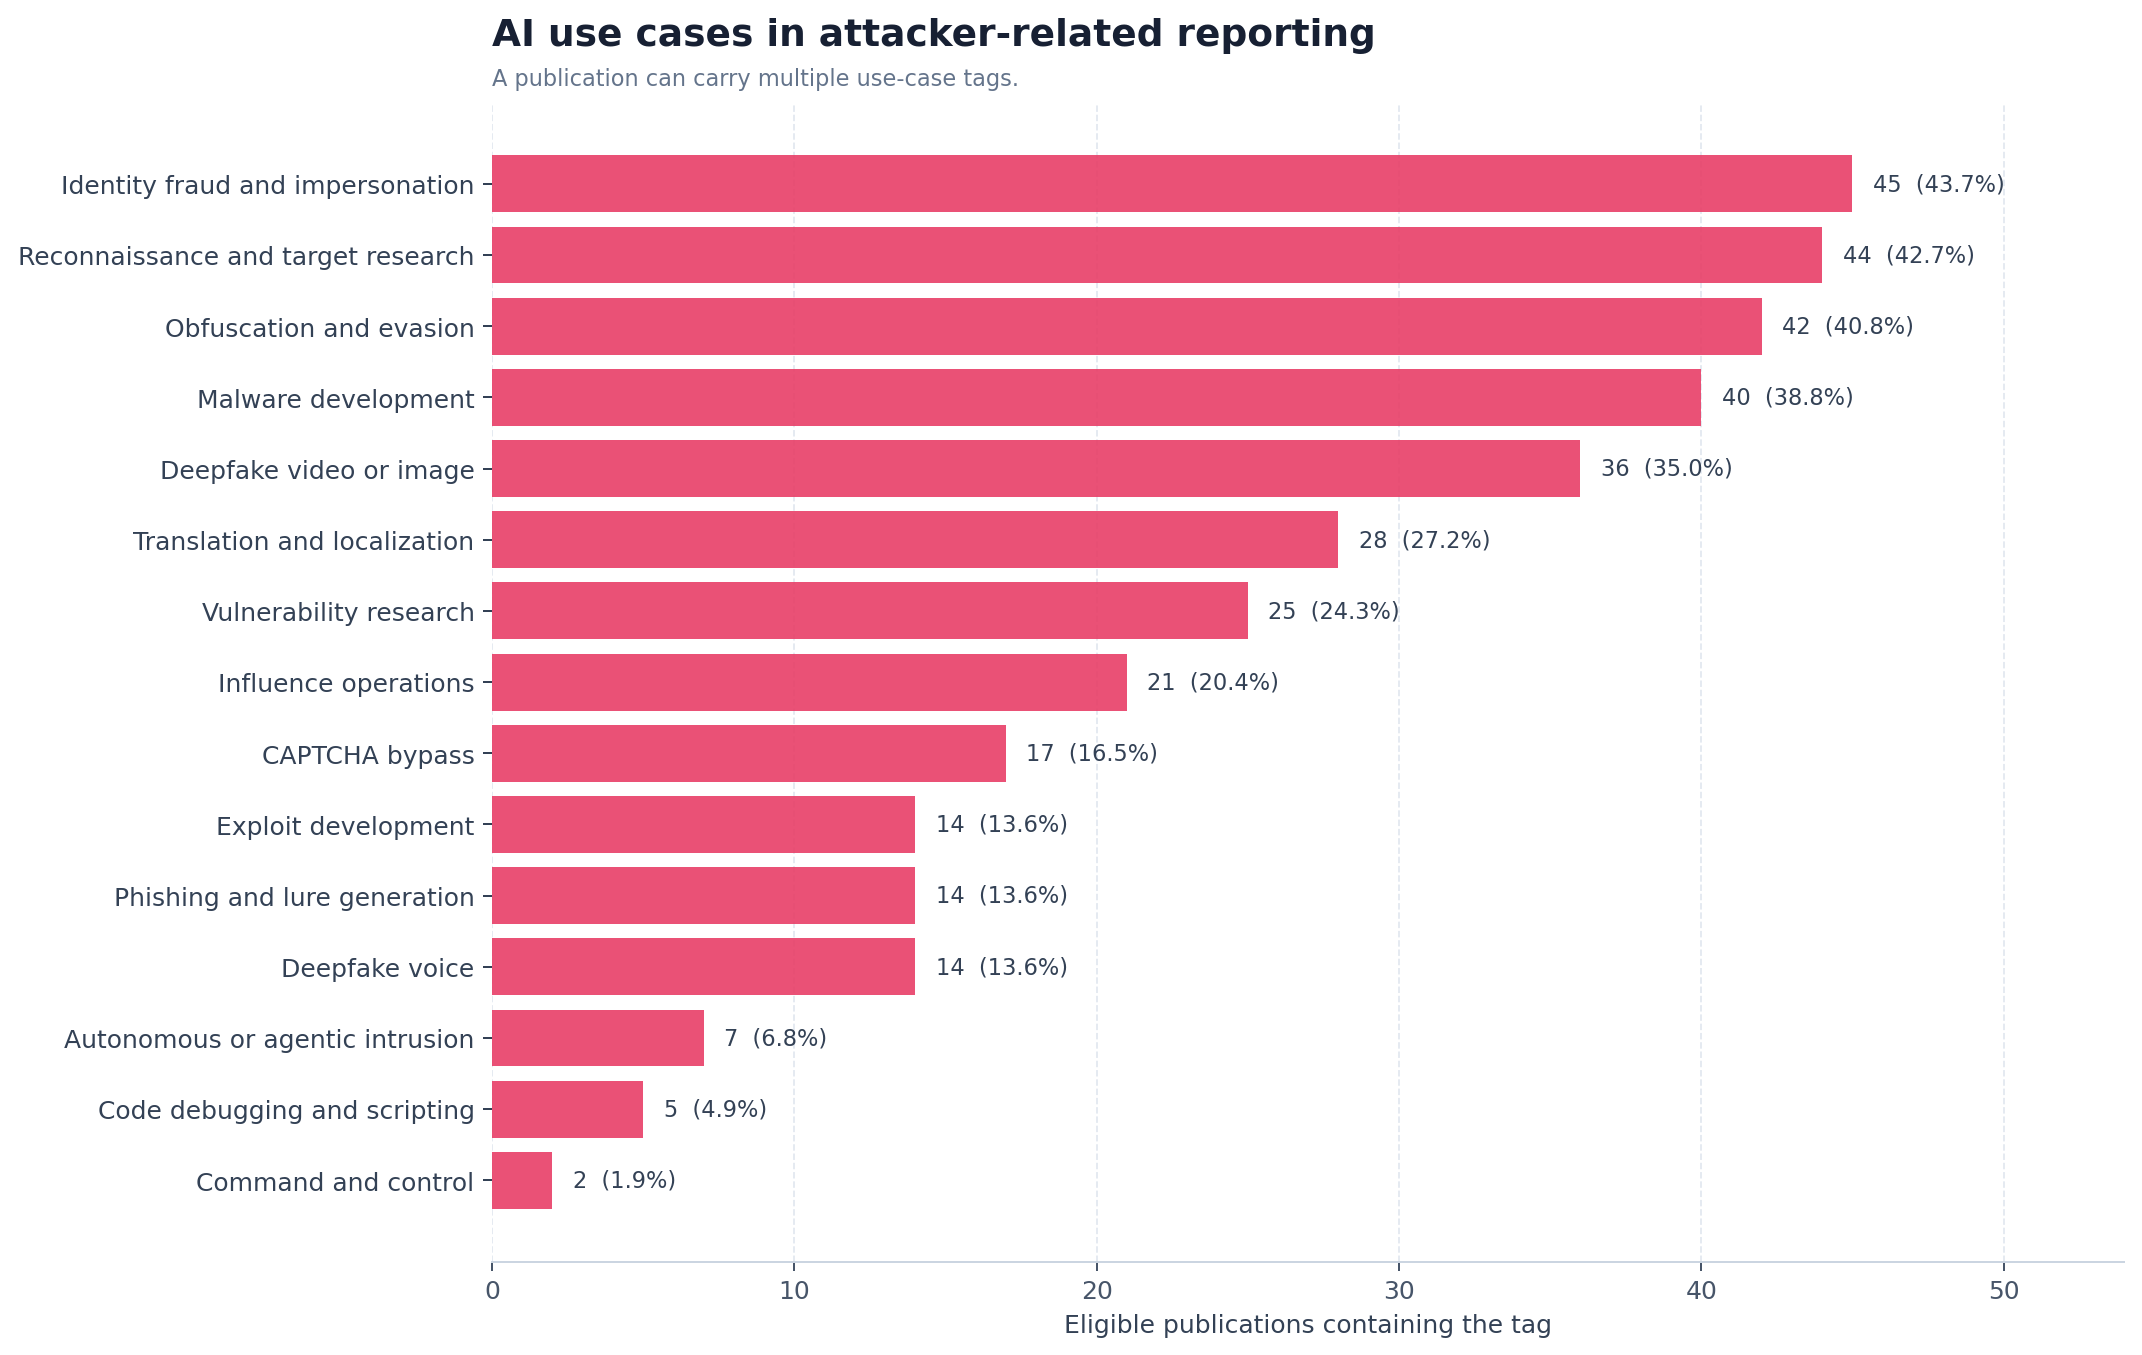
- Identity and research dominate the use-case vocabulary. Identity fraud and impersonation appears in 45 eligible publications (43.7%), and reconnaissance/target research appears in 44 (42.7%). Obfuscation/evasion appears in 42 and malware development in 40.
- Initial Access is the leading ATT&CK tactic mention. It appears in 81 publications (78.6%), followed by Impact in 59 and Execution in 55. These are candidate mappings extracted from source text, not validated ATT&CK assignments for 81 distinct attacks.
- Government and financial services dominate sector mentions. Government appears in 53 publications (51.5%) and Financial Services in 48. This measures reporting attention and contextual references, not unique victims.
- Provider mentions are highly visible but easy to misread. OpenAI is named in 50 eligible publications, Anthropic in 33, and Google in 20. These counts include research, defensive discussion, provider telemetry, experiments, and product references. They do not mean 50 confirmed attacks used OpenAI.
- The corpus is rich in extractable observables but uneven in comparable outcomes. It contains 483 IOC candidate mentions and 919 unvalidated metric candidates. Only 29 eligible publications contain IOC candidates and 69 contain at least one quantitative candidate; the values use heterogeneous definitions and include extraction false positives, so they cannot be pooled as one loss, dwell-time, or blast-radius estimate.
Research dashboard
| Measure | Result | Interpretation |
|---|---|---|
| Archived source records | 116 | Downloaded HTML, PDF, or provenance-preserving proxy records |
| Deduplicated publications | 111 | Five companion-format duplicate groups collapsed |
| Main statistical denominator | 103 | Eligible with manual validation required |
| Context-only publications | 5 | Retained for background, excluded from main percentages |
| Excluded publications | 3 | Two broken pages and one non-AI source |
| Eligible tag mentions | 4,862 | Source-linked, machine-extracted occurrences; copied excerpts remain private |
| Tag dimensions | 23 | Actor, use case, sector, TTP, provider, impact, and other classes |
| Unique normalized tag values | 530 | Deduplicated within tag type |
| Unvalidated metric candidates | 919 | Percentages, duration, cost, blast-radius, and breakout-time strings; false positives remain |
| IOC candidate mentions | 483 | Hashes, defanged domains, and IPv4 strings requiring validation |
Research question and evidence model
The central question is:
How does the collected 2022–2026 research describe AI use in attacker activity, and where does that evidence concentrate across use cases, intrusion stages, actors, targets, technologies, and measurable outcomes?
This is a descriptive corpus study. It does not estimate the fraction of all cyberattacks that use AI. There is no known sampling frame containing every attack or every report, and publication practices differ across governments, vendors, providers, researchers, and incident-response firms.
Unit of analysis
| Unit | Used here? | Meaning |
|---|---|---|
| Publication | Yes | One deduplicated report, article, advisory, paper, or provider-abuse report |
| Source record | Provenance only | One downloaded representation; HTML/PDF companions can map to one publication |
| Incident or campaign | No | Not consistently normalized across all sources |
| Tag co-mention | Yes | Two normalized concepts appearing in the same publication |
| Victim or affected organization | No | Not consistently disclosed or uniquely countable |
| IOC candidate | Yes, separately | A machine-extracted observable requiring analyst validation |
Interpretation vocabulary
- Observed means the normalized dataset directly contains the publication, tag, or candidate value; the private working record also retains the evidence excerpt used during extraction.
- Source-reported means the underlying publisher makes the claim; this study does not independently reproduce it.
- Inferred means a pattern is derived from publication co-mentions or normalized categories.
- Unconfirmed means the data cannot establish incident uniqueness, malicious use, attribution, exploitation, or causality.
Corpus construction and quality
The private archive began with 116 retrieved source records. A content and metadata audit collapsed five companion-format pairs—HTML and PDF representations of the same publication—into 111 publication entities. The private source records retain the local files and extraction excerpts; the public provenance layer retains source IDs, canonical URLs, retrieval methods, hashes, duplicate decisions, content quality, and publication relationships without exposing archive paths.
The analytical dataset then records one row per publication and long-form tables for tags, metrics, and IOCs. The private working records retain evidence spans and excerpts so an analyst can move from a chart value back to the exact source context. The public exports retain source IDs, normalized values, confidence, extraction methods, and offsets, but intentionally omit copied excerpts and local archive paths.
Inclusion rules
- Eligible with manual validation (103): material centrally relevant to attacker use, abuse, simulation, or operational implications of AI.
- Context only (5): adjacent AI-security or background material useful for framing but excluded from main percentages.
- Excluded broken source (2): source pages that did not preserve usable research content.
- Excluded non-AI (1): a source that did not support the research question.
Extraction quality is not claim validity
All 4,862 eligible tag occurrences are machine-extracted. High textual match confidence can show that a phrase exists near evidence, but it cannot prove the phrase describes a real malicious action, the named actor performed it, the provider enabled it, or the CVE was exploited with AI. Manual review remains mandatory.
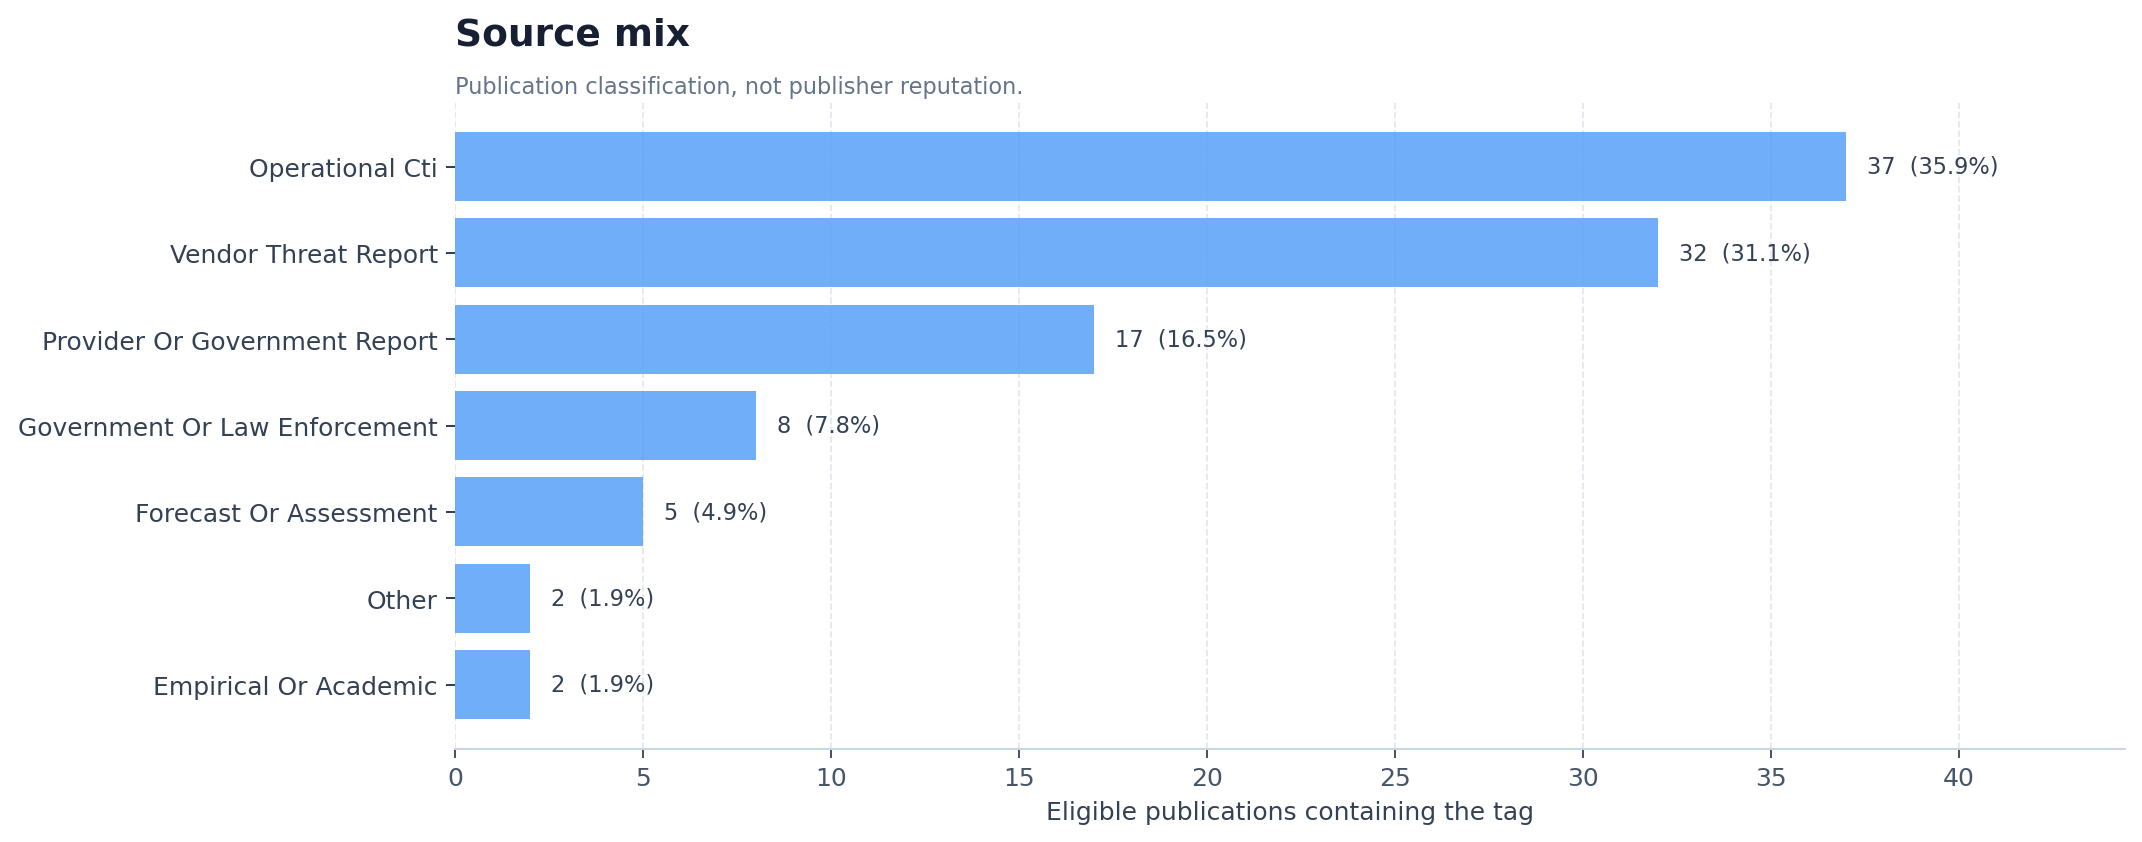
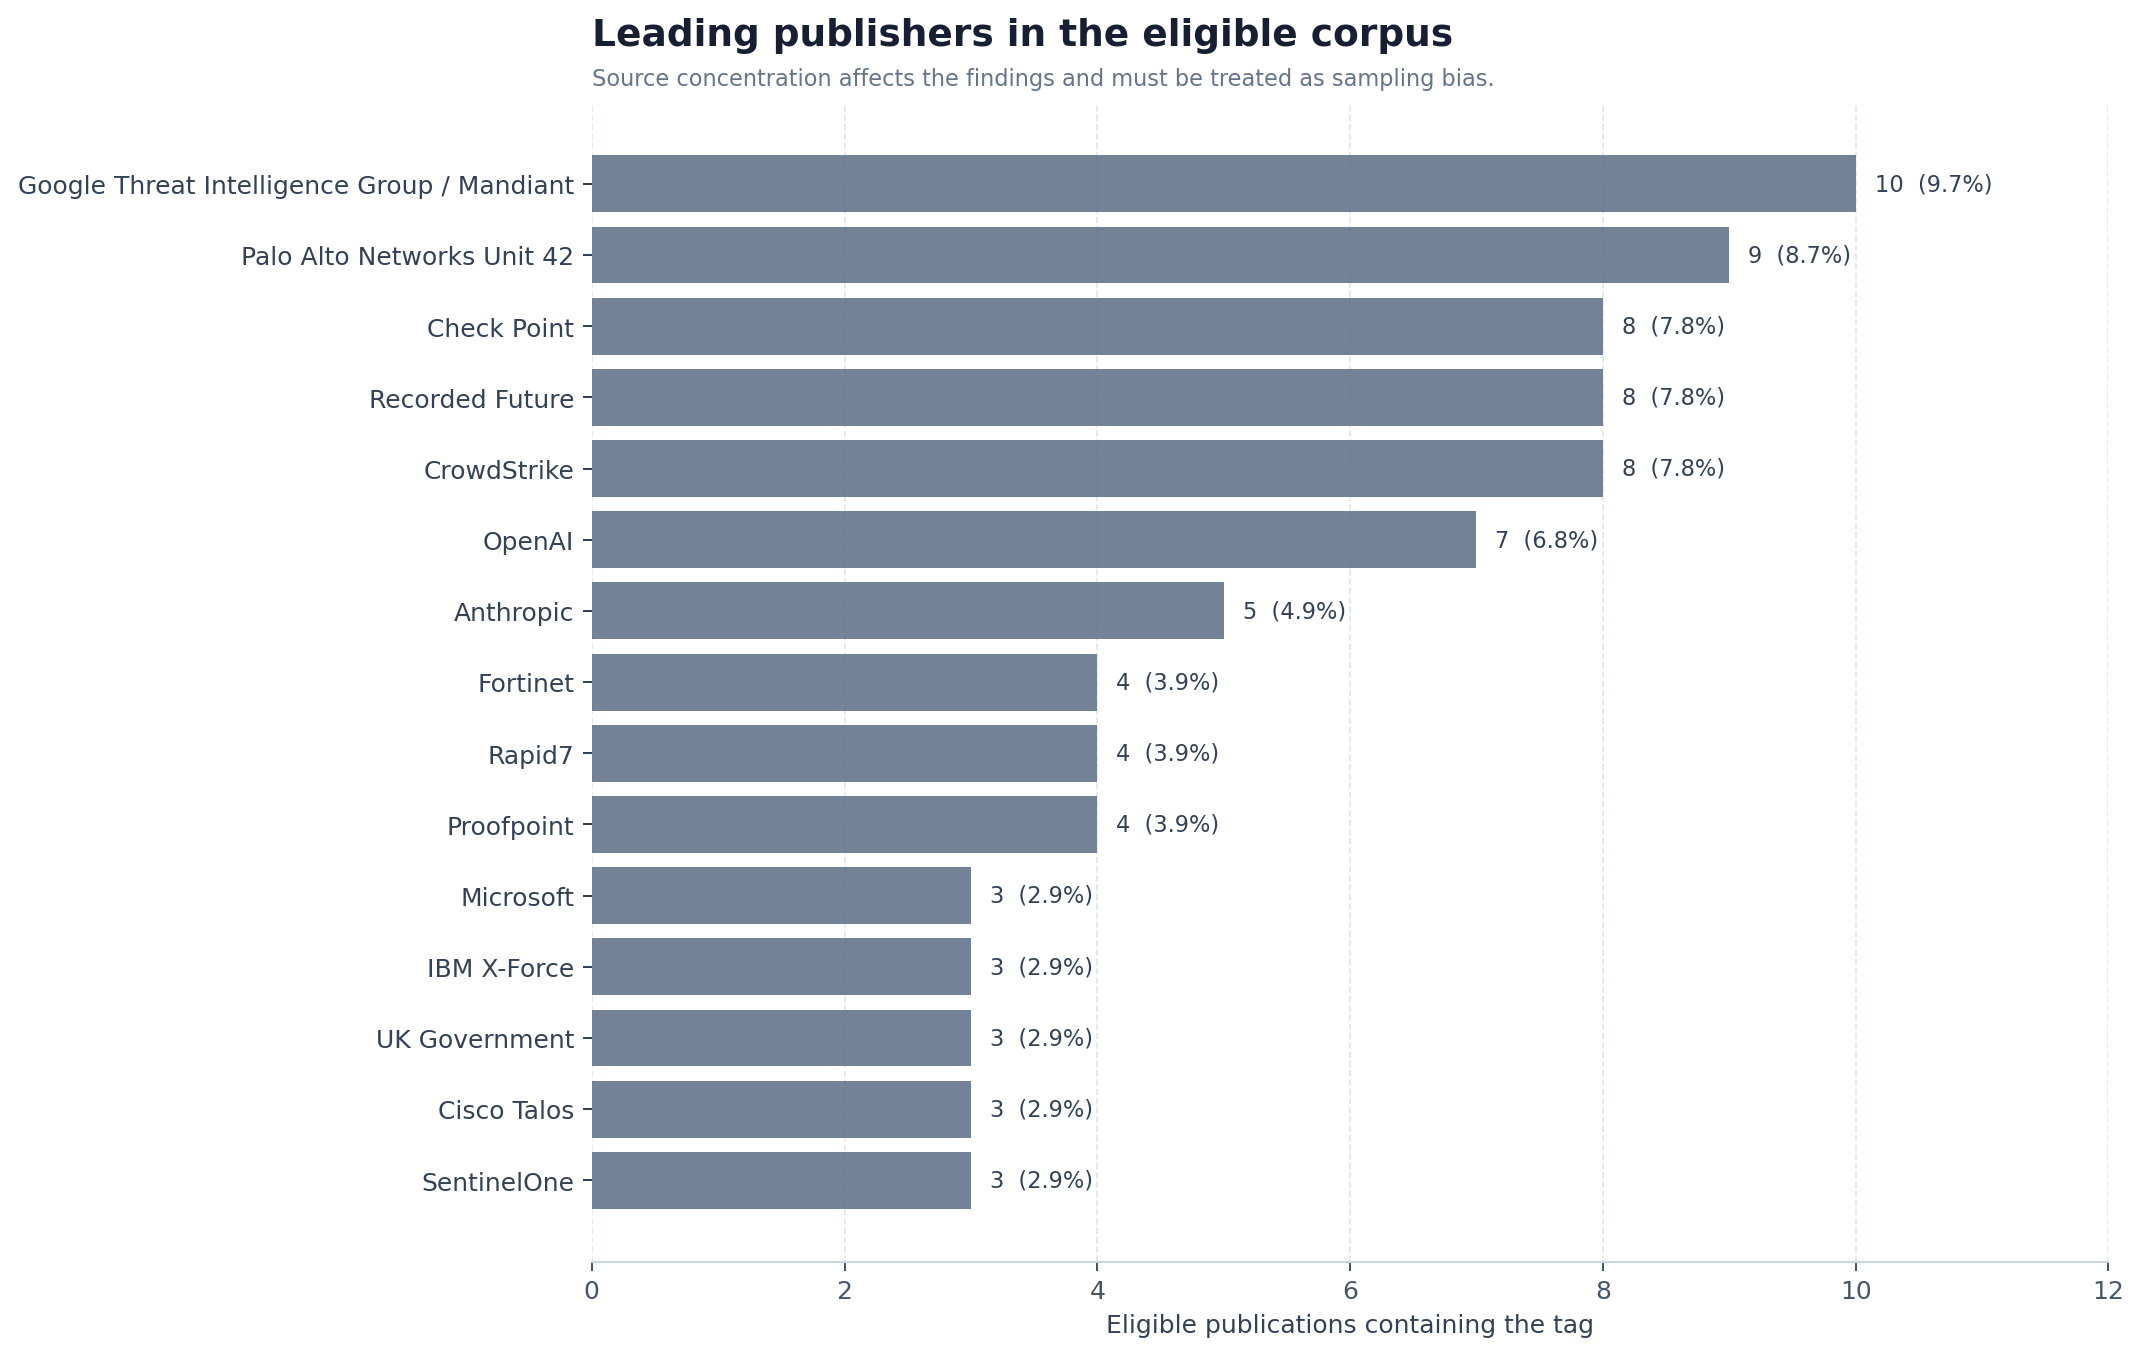
The publisher distribution also reveals sampling bias. Google Threat Intelligence Group/Mandiant, Unit 42, Recorded Future, Check Point, CrowdStrike, OpenAI, and Anthropic contribute multiple records. Their visibility, disclosure policies, research priorities, and product telemetry shape the corpus.
Temporal and source landscape
| Year | Publications | Share of eligible corpus |
|---|---|---|
| 2022 | 1 | 1.0% |
| 2023 | 8 | 7.8% |
| 2024 | 22 | 21.4% |
| 2025 | 46 | 44.7% |
| 2026 | 23 | 22.3% |
The curve rises sharply through 2025, but it must not be read as an attack-growth curve. At least four alternative mechanisms can produce the same shape: greater publisher attention, more provider transparency reports, an expanding collection strategy, and real change in attacker experimentation. The corpus does not identify their separate effects. The 2026 count is also partial through the collection date, and three eligible publications have no resolved year.
How AI is described in cyberattacks
AI use cases
| AI use case | Publications | Share of eligible corpus |
|---|---|---|
| Identity fraud and impersonation | 45 | 43.7% |
| Reconnaissance and target research | 44 | 42.7% |
| Obfuscation and evasion | 42 | 40.8% |
| Malware development | 40 | 38.8% |
| Deepfake video or image | 36 | 35.0% |
| Translation and localization | 28 | 27.2% |
| Vulnerability research | 25 | 24.3% |
| Influence operations | 21 | 20.4% |
| CAPTCHA bypass | 17 | 16.5% |
| Deepfake voice | 14 | 13.6% |
| Exploit development | 14 | 13.6% |
| Phishing and lure generation | 14 | 13.6% |
| Autonomous or agentic intrusion | 7 | 6.8% |
| Code debugging and scripting | 5 | 4.9% |
| Command and control | 2 | 1.9% |
The leading pattern is not a single autonomous attack. It is the use of AI to reduce friction in familiar activities: identity impersonation, target research, evasion, malware development, localization, and vulnerability work. Autonomous or agentic intrusion appears in only seven eligible publications (6.8%), while identity fraud appears in 45 (43.7%) and target research in 44 (42.7%). This supports a bounded conclusion: the collected literature more often describes augmentation of existing attacker workflows than fully autonomous end-to-end compromise.
Use the References library to inspect the 45-publication identity-fraud slice rather than treating the aggregate as an incident count.
AI technology families
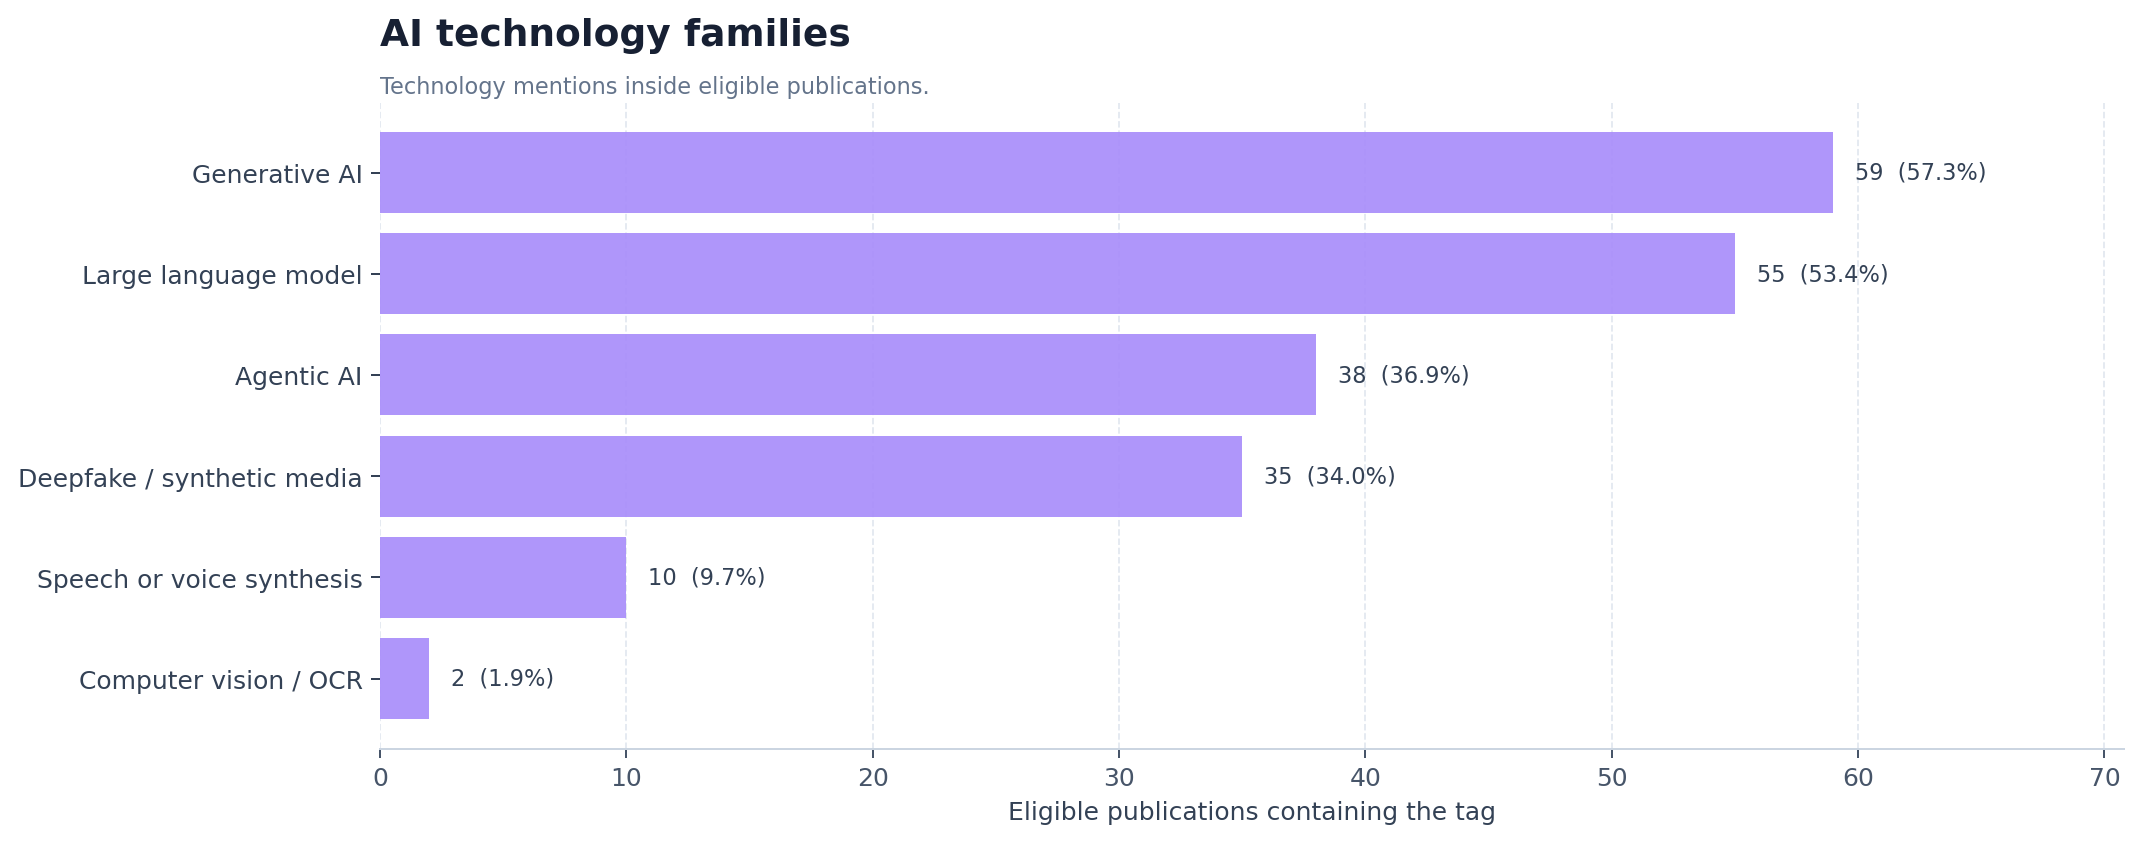
Generative AI and large language models dominate the technology vocabulary, while agentic AI appears in 38 publications and deepfake/synthetic media in 35. These categories overlap. A report can discuss an LLM-driven agent, generative malware assistance, and synthetic identity material simultaneously.
Intrusion lifecycle and ATT&CK coverage
Cyber Kill Chain
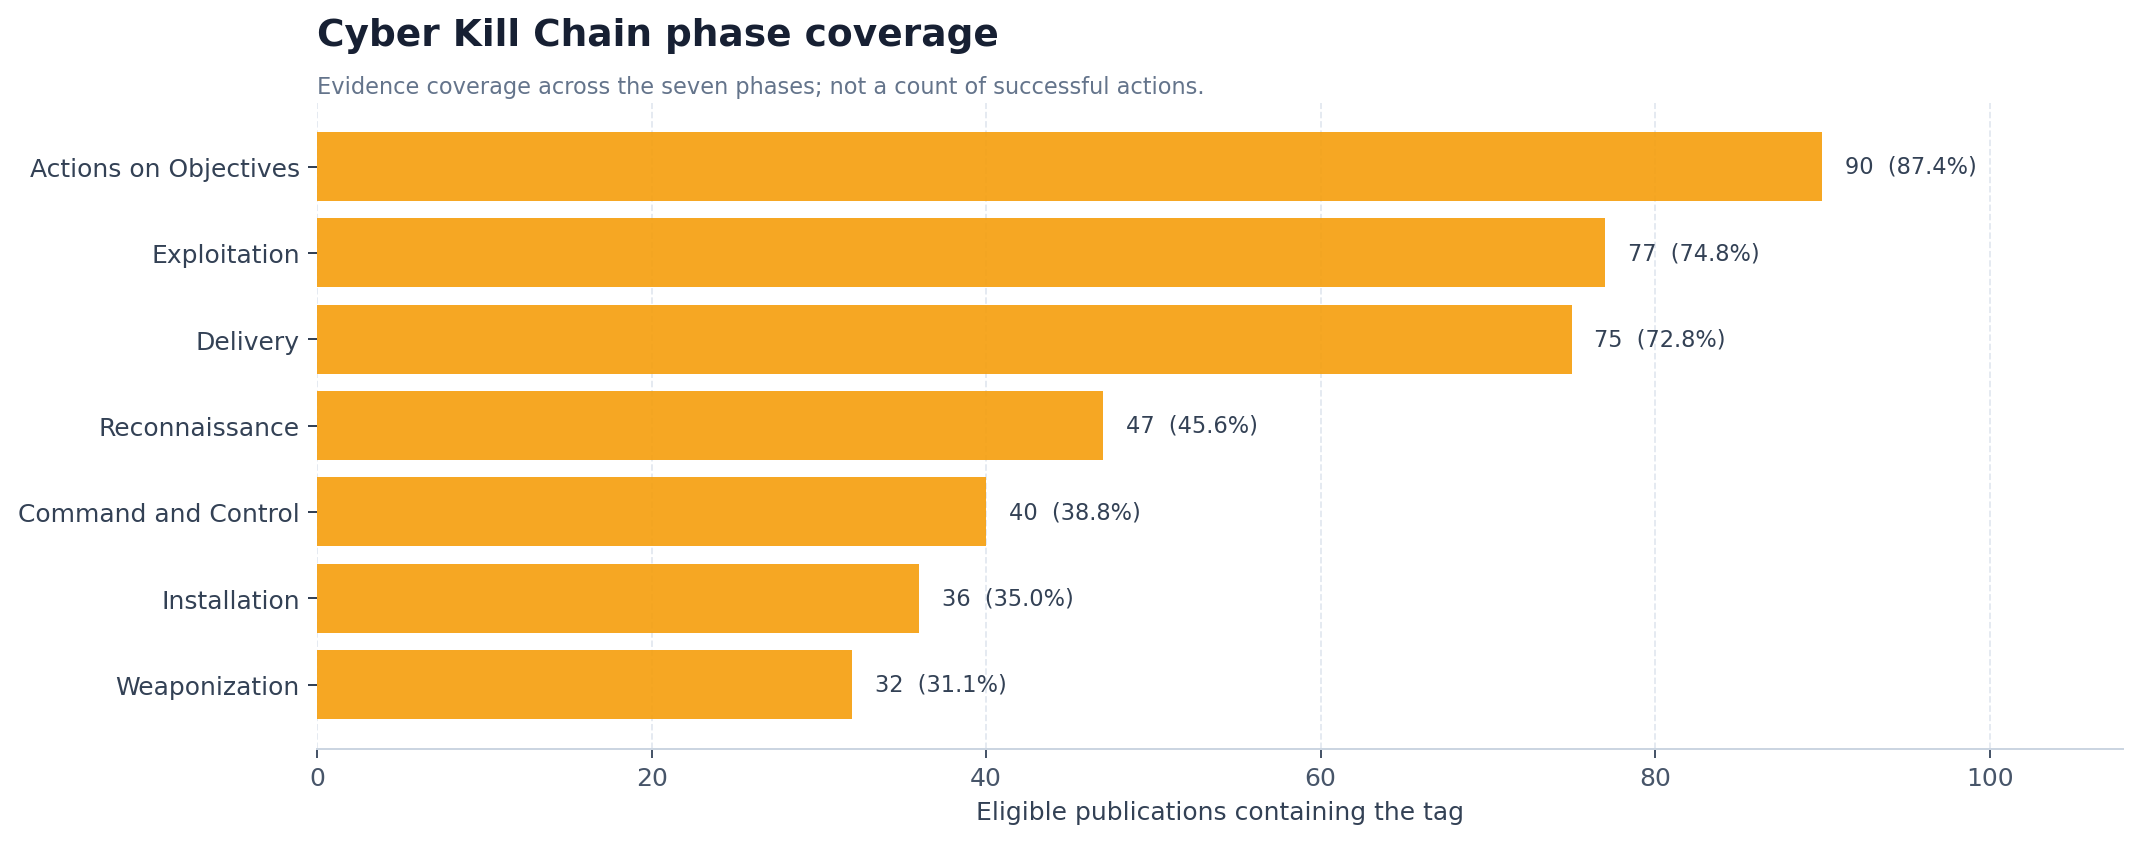
All seven Cyber Kill Chain phases are represented. Actions on Objectives, Exploitation, and Delivery are the most frequently covered. Weaponization is the least represented at 32 publications, but even that is present in nearly one-third of the eligible corpus. This breadth argues against designing “AI attack detection” as one alert category. Defenders need evidence across identity, email, endpoint, network, cloud, SaaS, and fraud telemetry.
ATT&CK tactic candidates
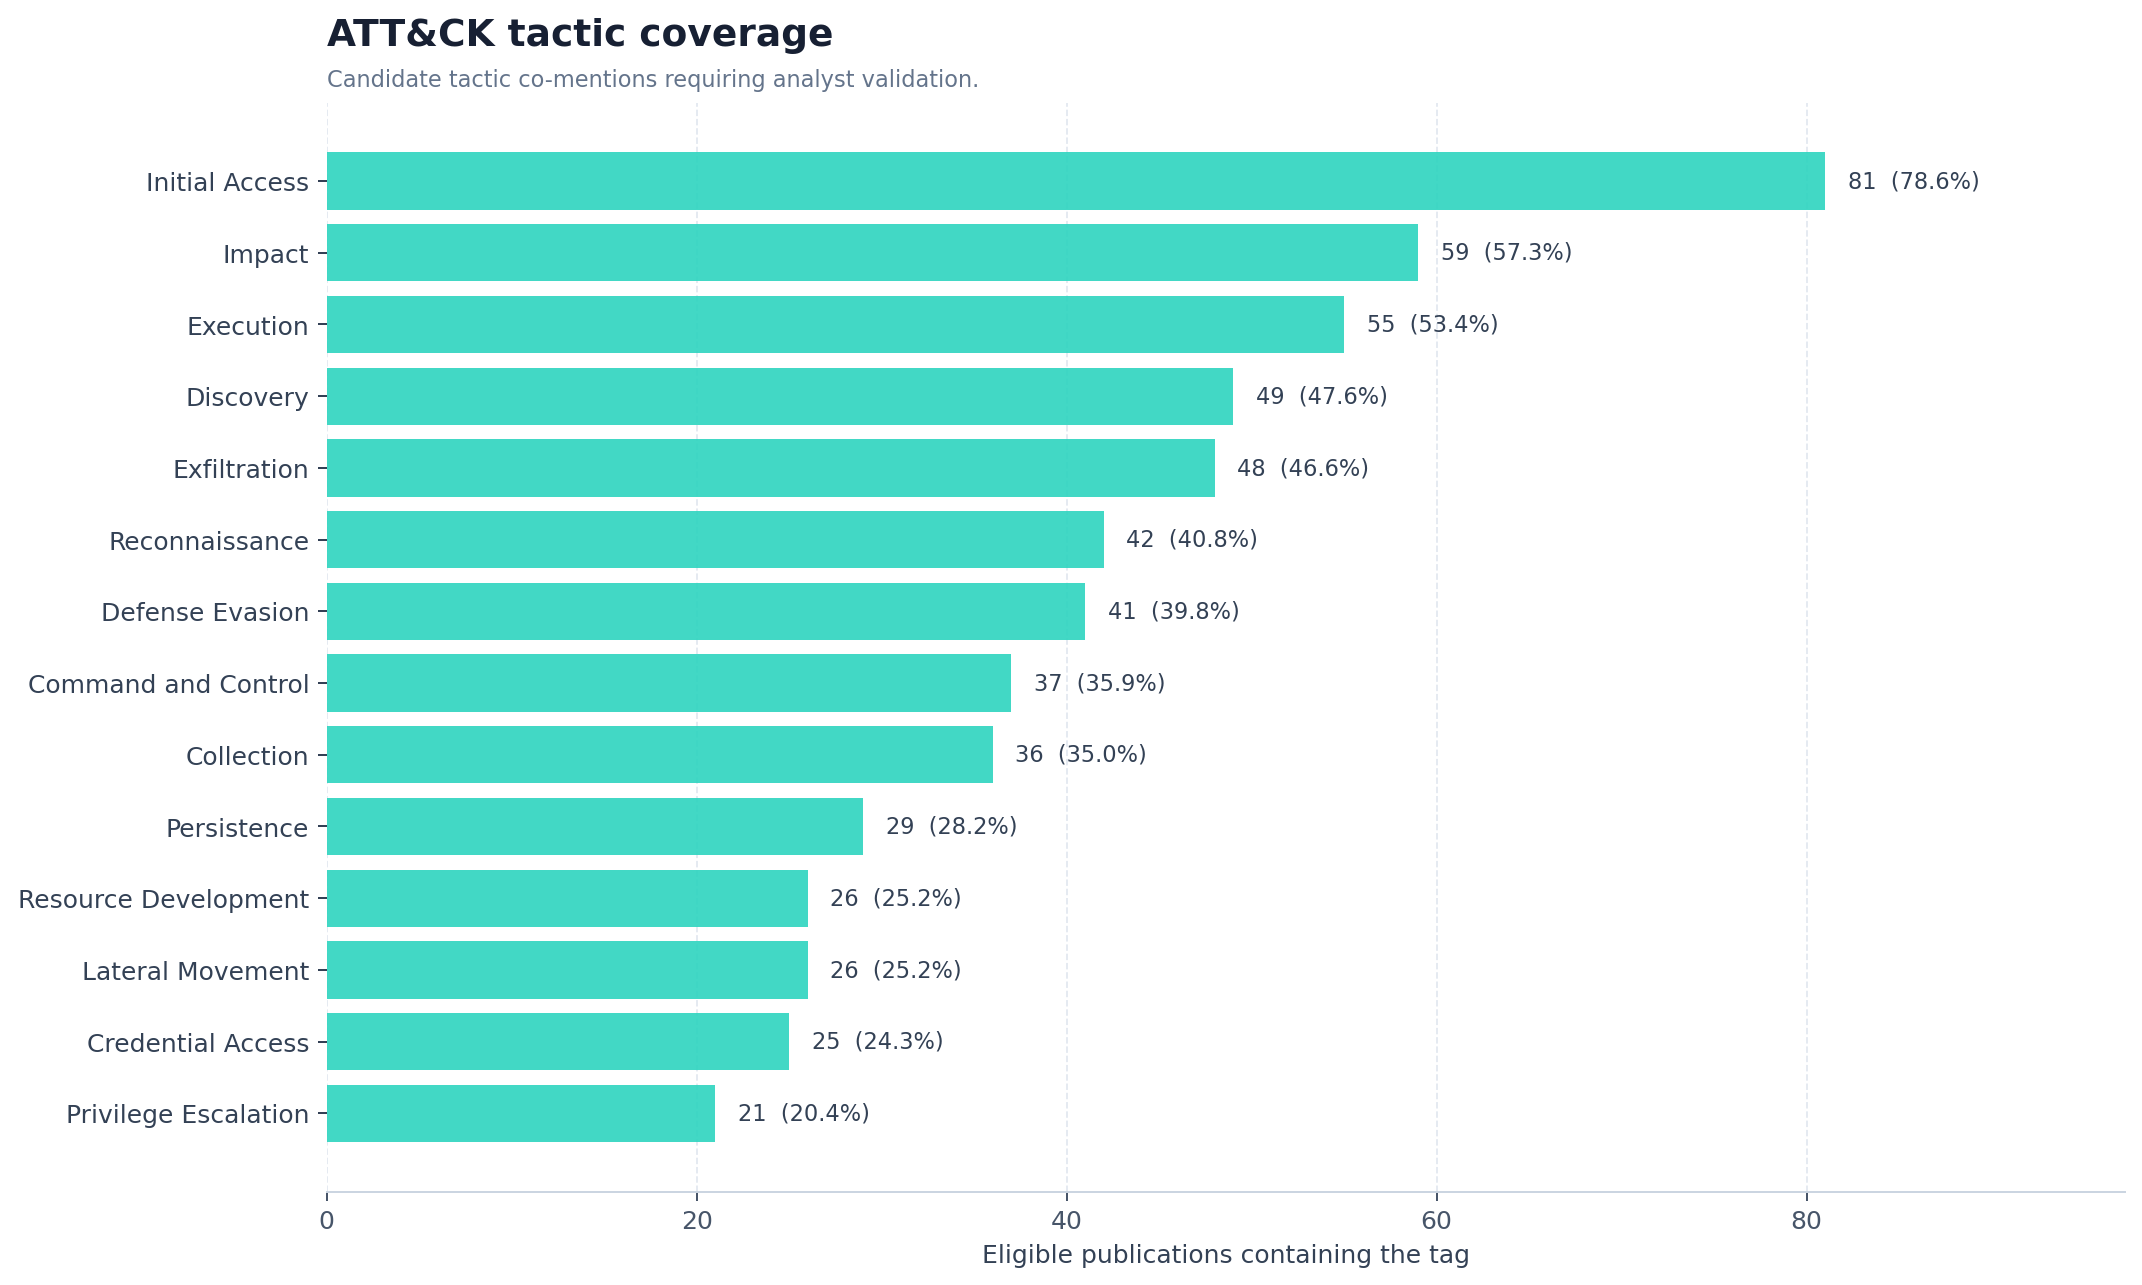
ATT&CK tactic tags are behavioral leads. They should be promoted into a defensive mapping only after the analyst validates the described behavior, actor, target, and evidence. Initial Access dominates because the corpus contains substantial social engineering, identity fraud, credential theft, vishing, phishing, and fake-site research.
The eligible source set is available as an Initial Access reference pivot, and the ATT&CK knowledge matrix provides the behavior-first context needed before operational mapping.
TTP families
| TTP family | Publications | Share of eligible corpus |
|---|---|---|
| Data exfiltration | 48 | 46.6% |
| Command and control | 37 | 35.9% |
| Deepfake impersonation | 34 | 33.0% |
| Malware generation | 33 | 32.0% |
| Defense evasion | 32 | 31.1% |
| Credential theft | 29 | 28.2% |
| Obfuscation | 25 | 24.3% |
| Spearphishing | 25 | 24.3% |
| Voice phishing / vishing | 25 | 24.3% |
| PowerShell execution | 23 | 22.3% |
| Supply-chain compromise | 21 | 20.4% |
| Business email compromise | 18 | 17.5% |
| Credential harvesting | 18 | 17.5% |
| CAPTCHA bypass | 17 | 16.5% |
| Prompt injection | 16 | 15.5% |
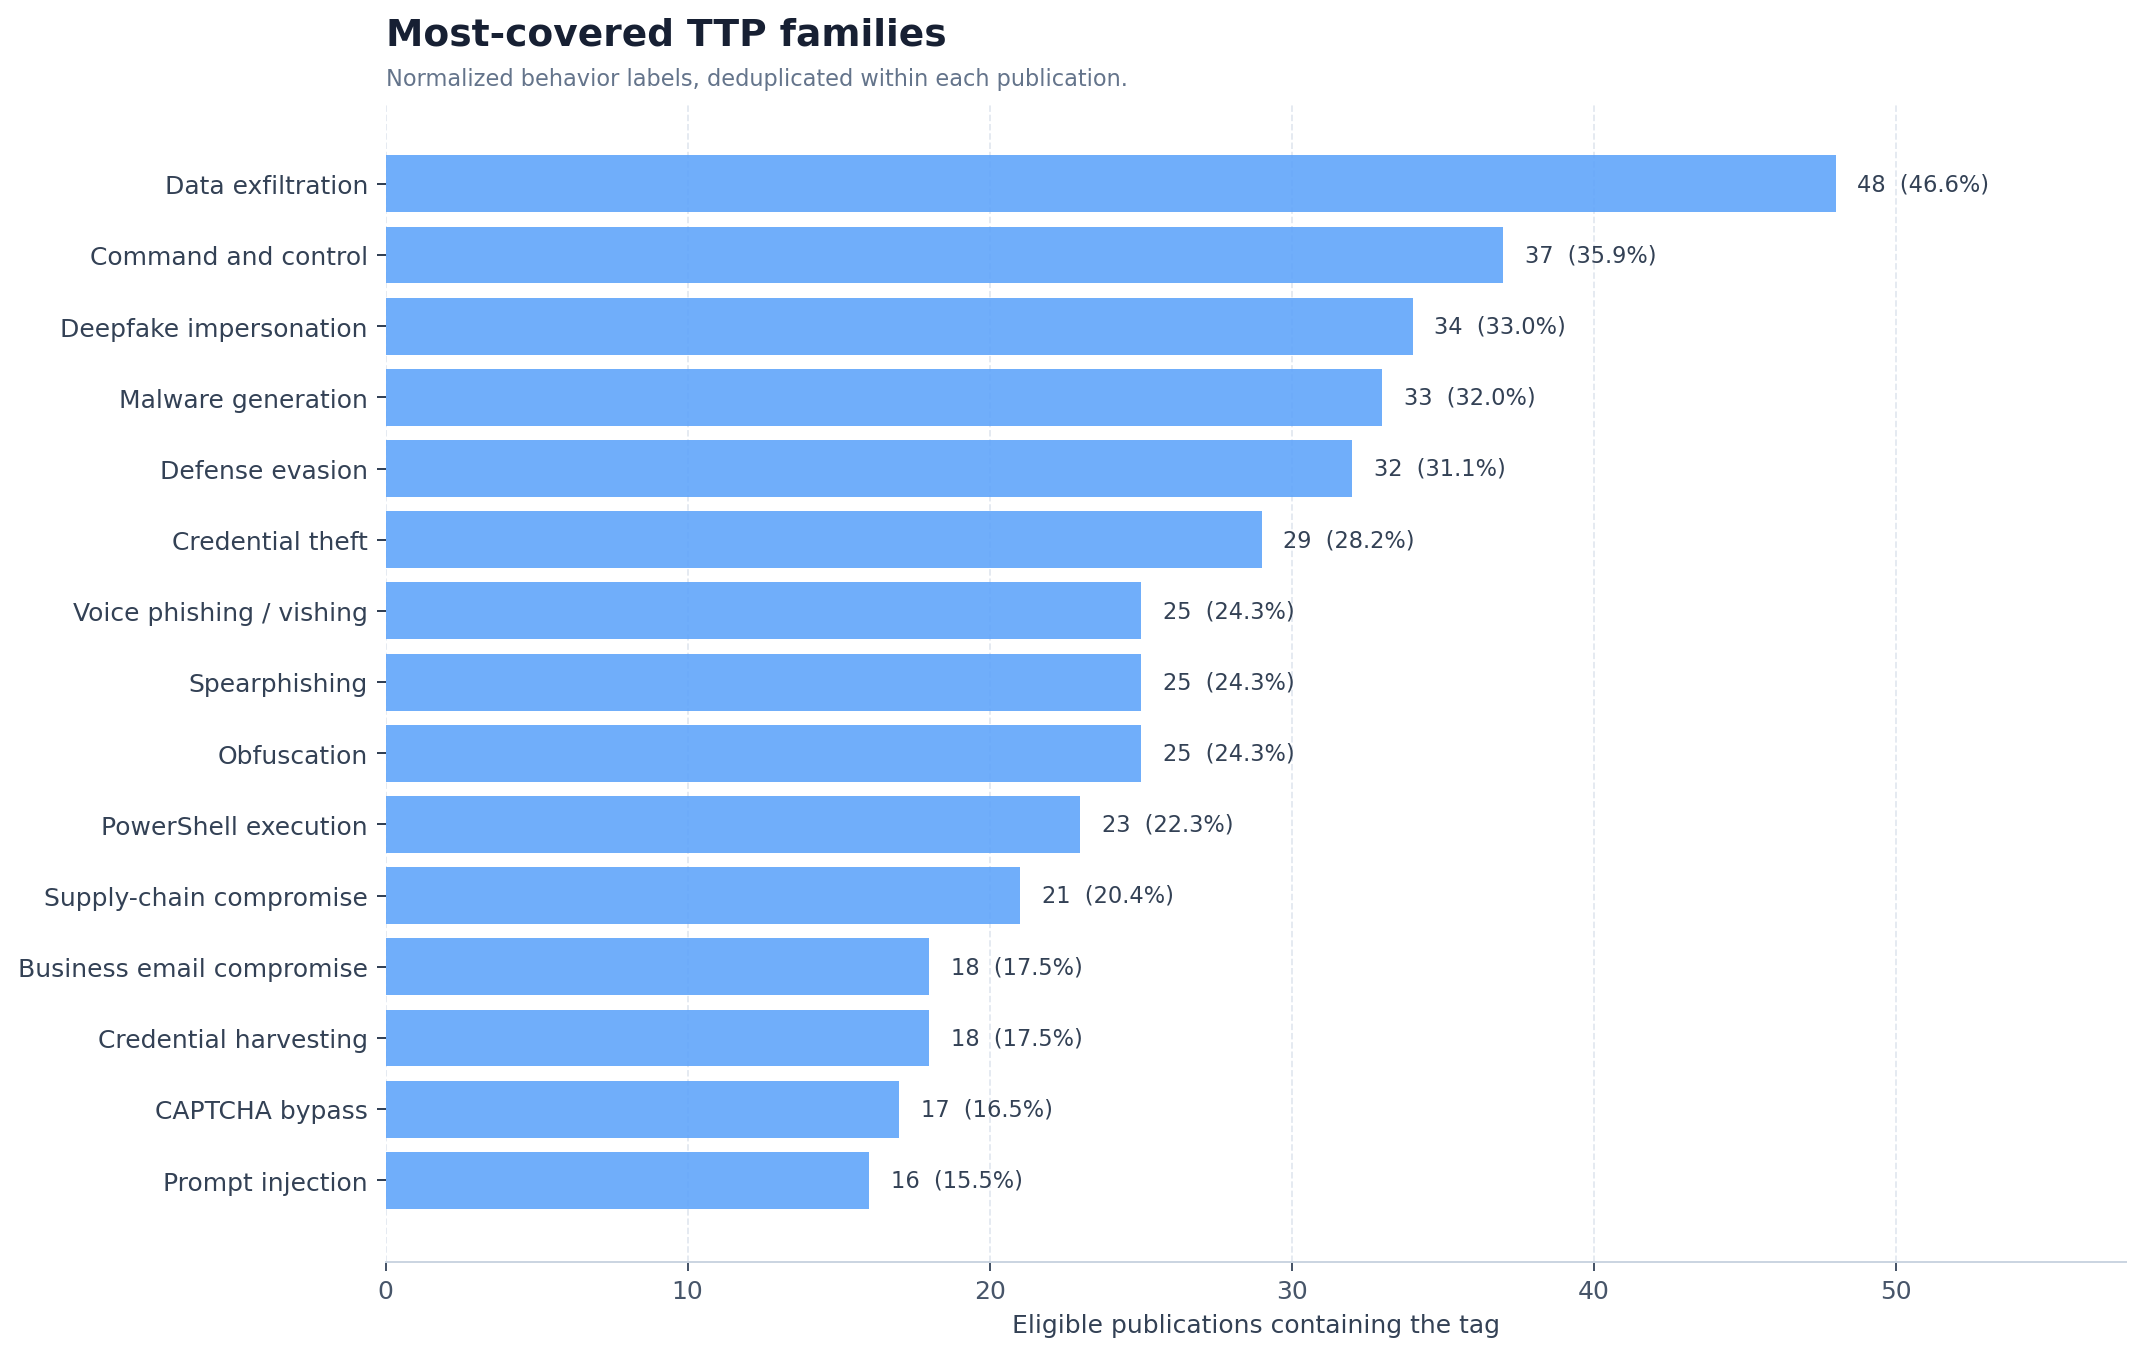
Data exfiltration is the leading normalized TTP family, appearing in 48 publications (46.6%). Command and control, deepfake impersonation, defense evasion, malware generation, and credential theft follow. These values measure corpus coverage, not the conditional probability that an AI-assisted intrusion will use each behavior.
Threat actors, targets, sectors, and geography
Named threat groups
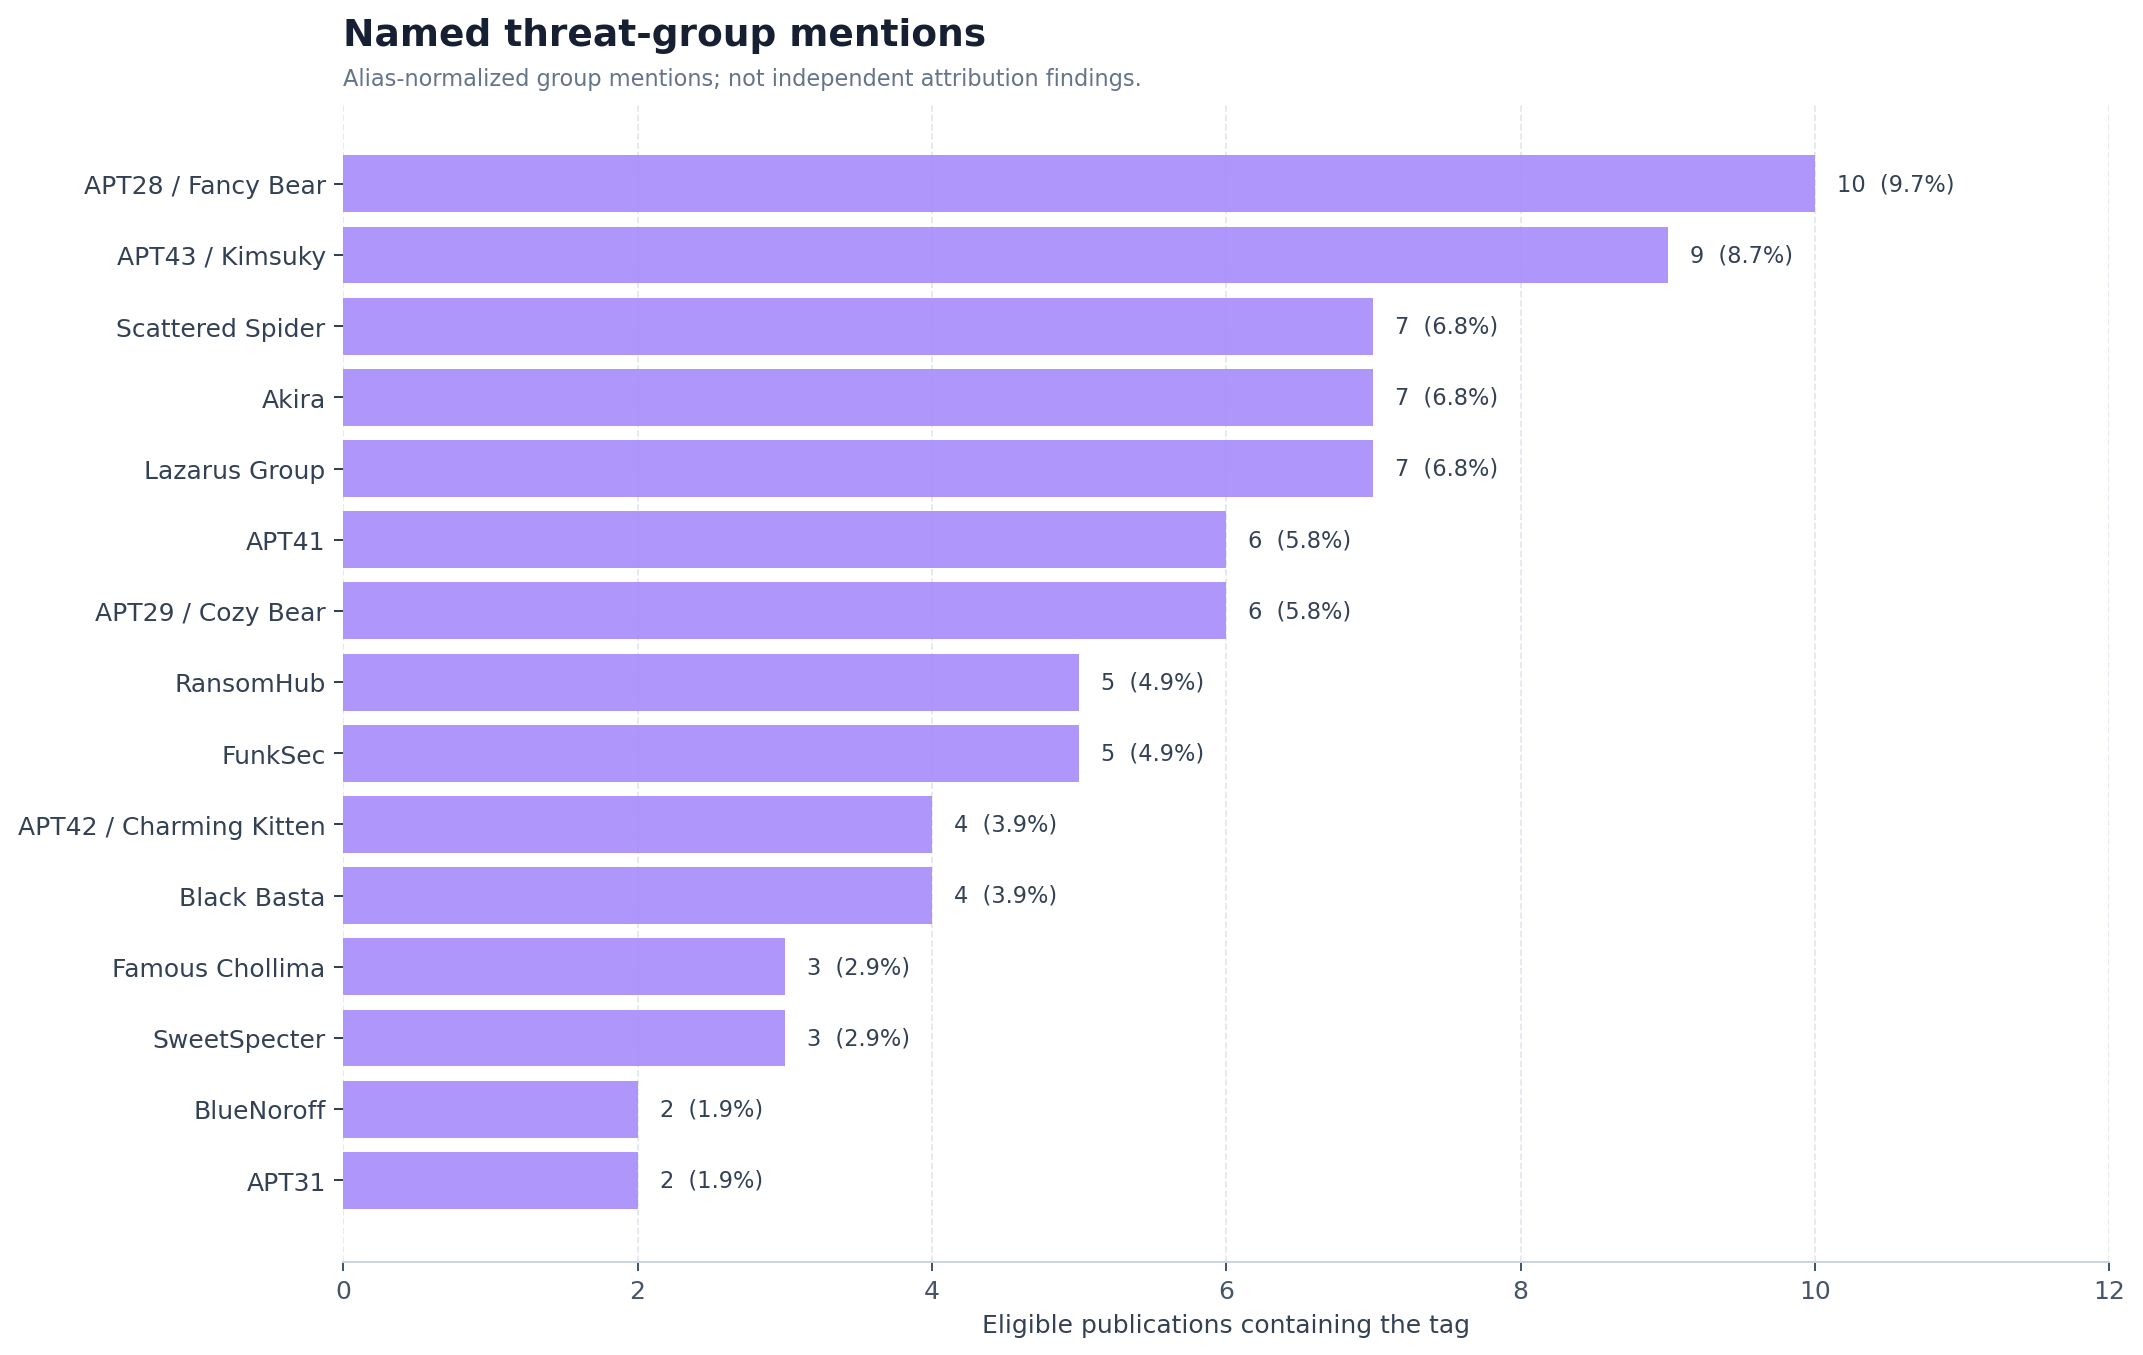
APT28/Fancy Bear appears in 10 eligible publications, APT43/Kimsuky in nine, and Akira in seven. The names can describe attribution, comparison, historical background, or a source publisher’s own assessment. They must not be transformed into attribution facts without evidence-level review and alias resolution.
Sectors and target personas
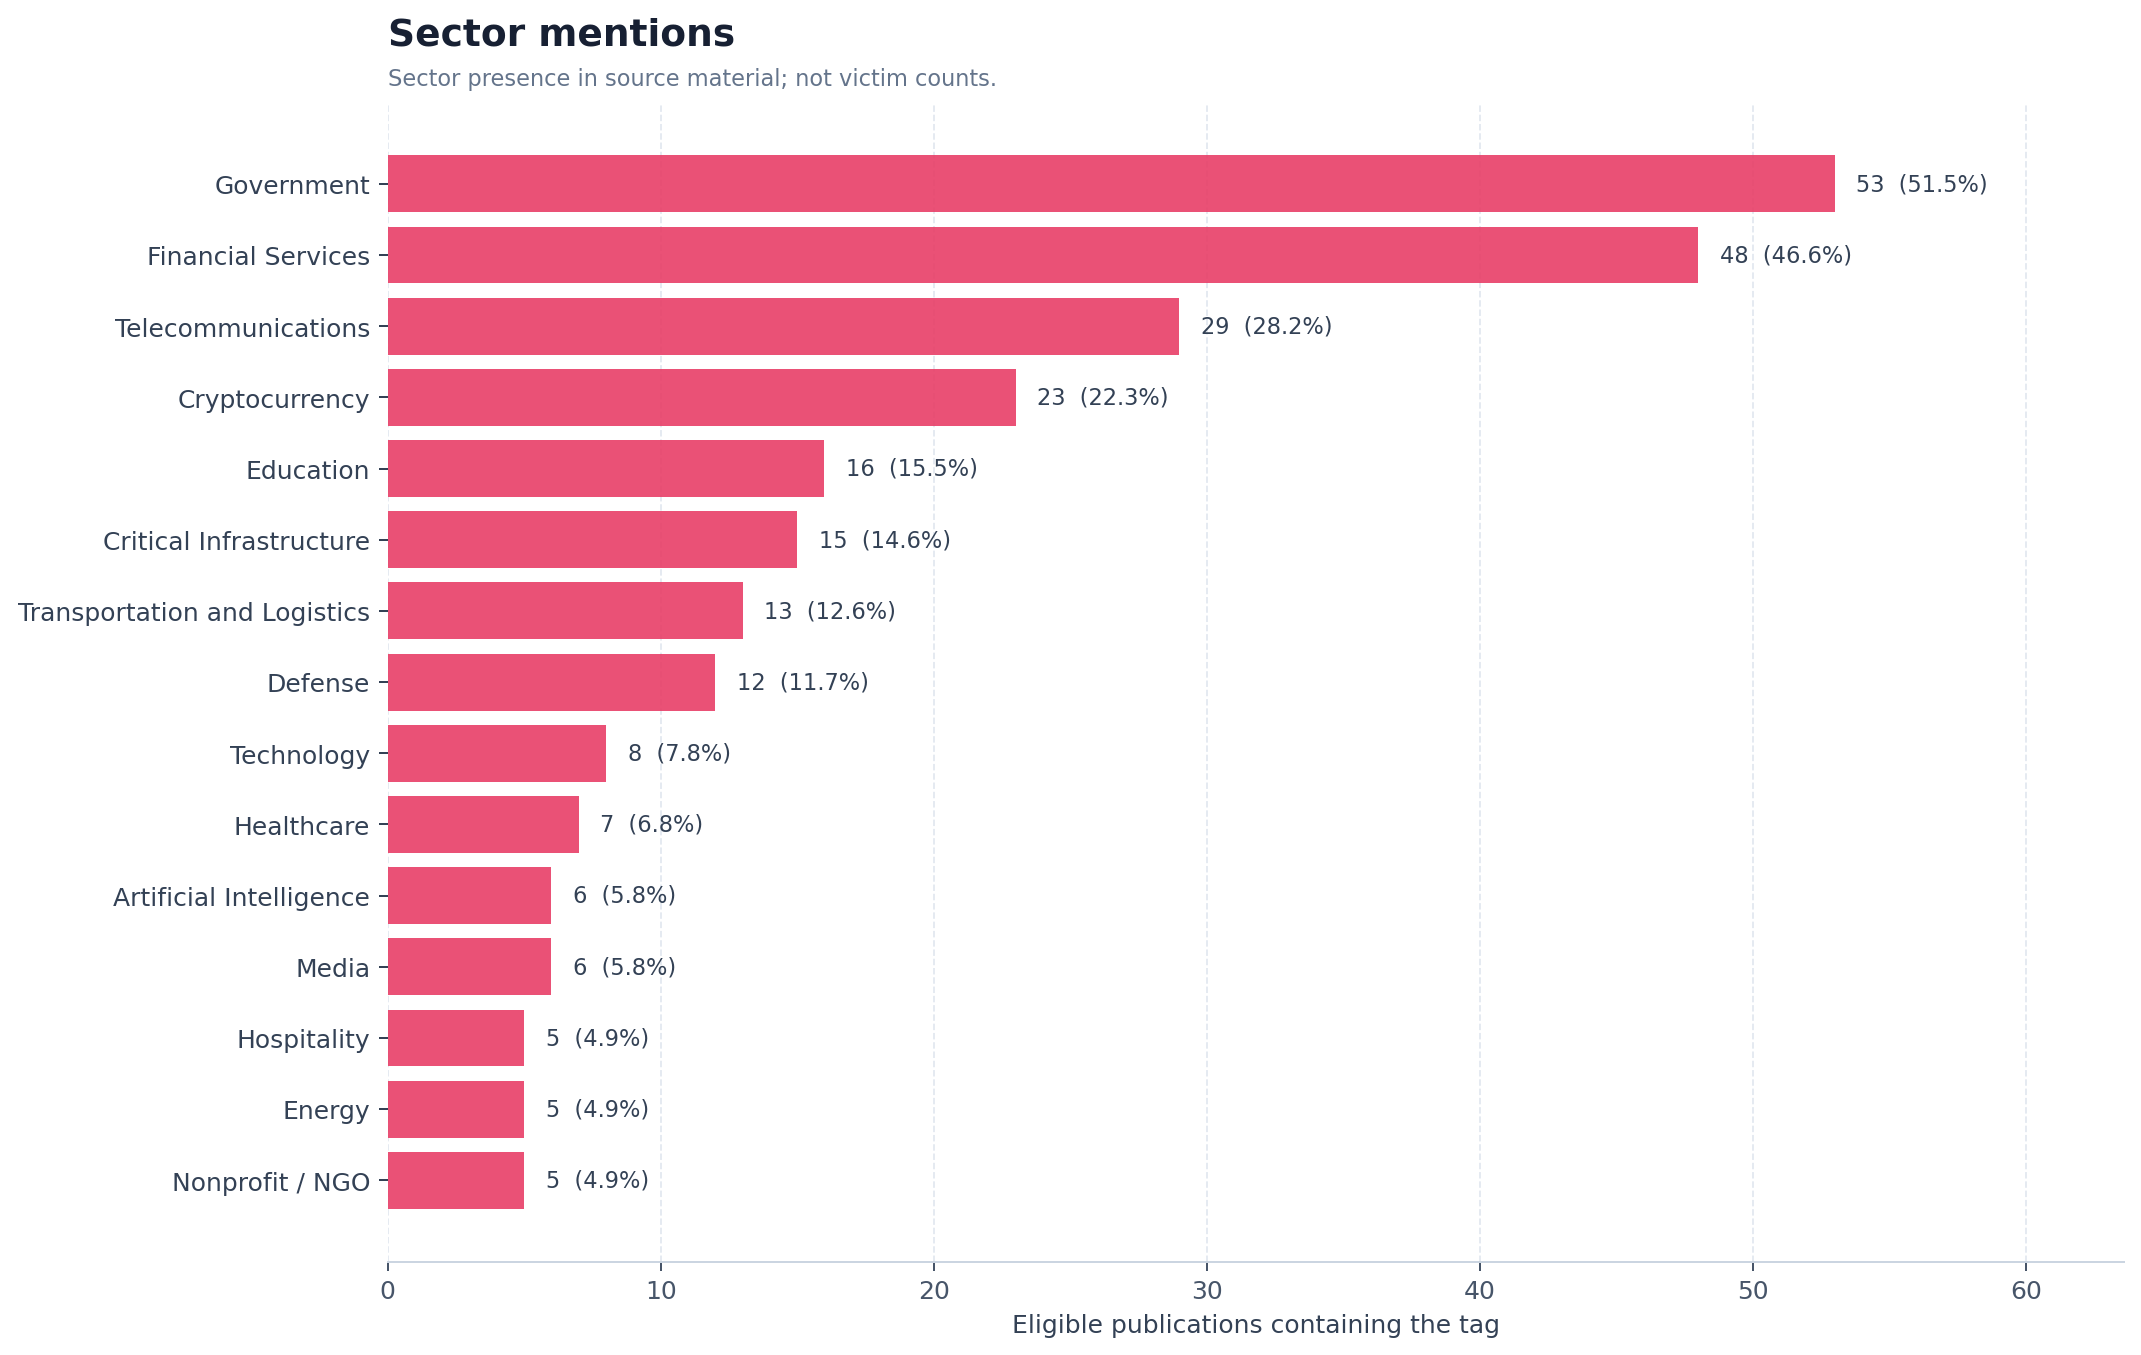
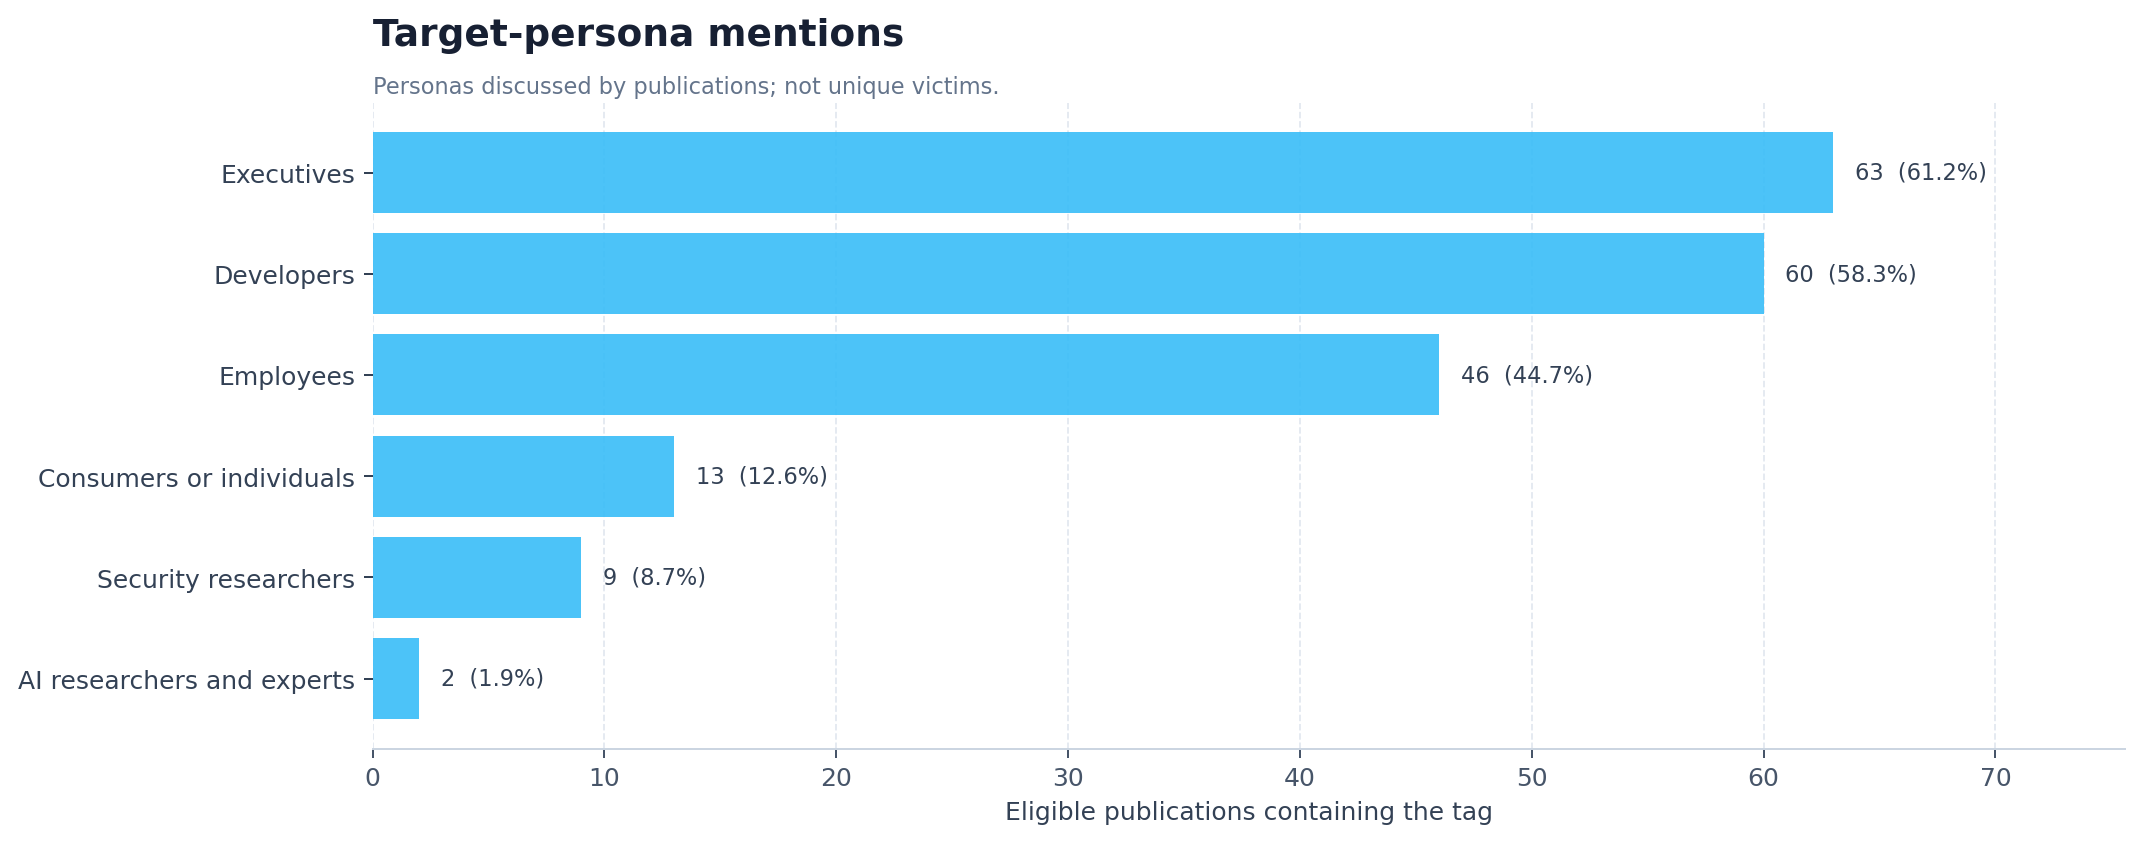
Government, financial services, telecommunications, cryptocurrency, education, and critical infrastructure lead the sector vocabulary. Executives, developers, and employees lead the target-persona vocabulary. This combination is consistent with a research landscape focused on access, identity, code, financial abuse, and high-value social engineering. It does not establish unique victim counts or sector-specific attack rates.
Geography
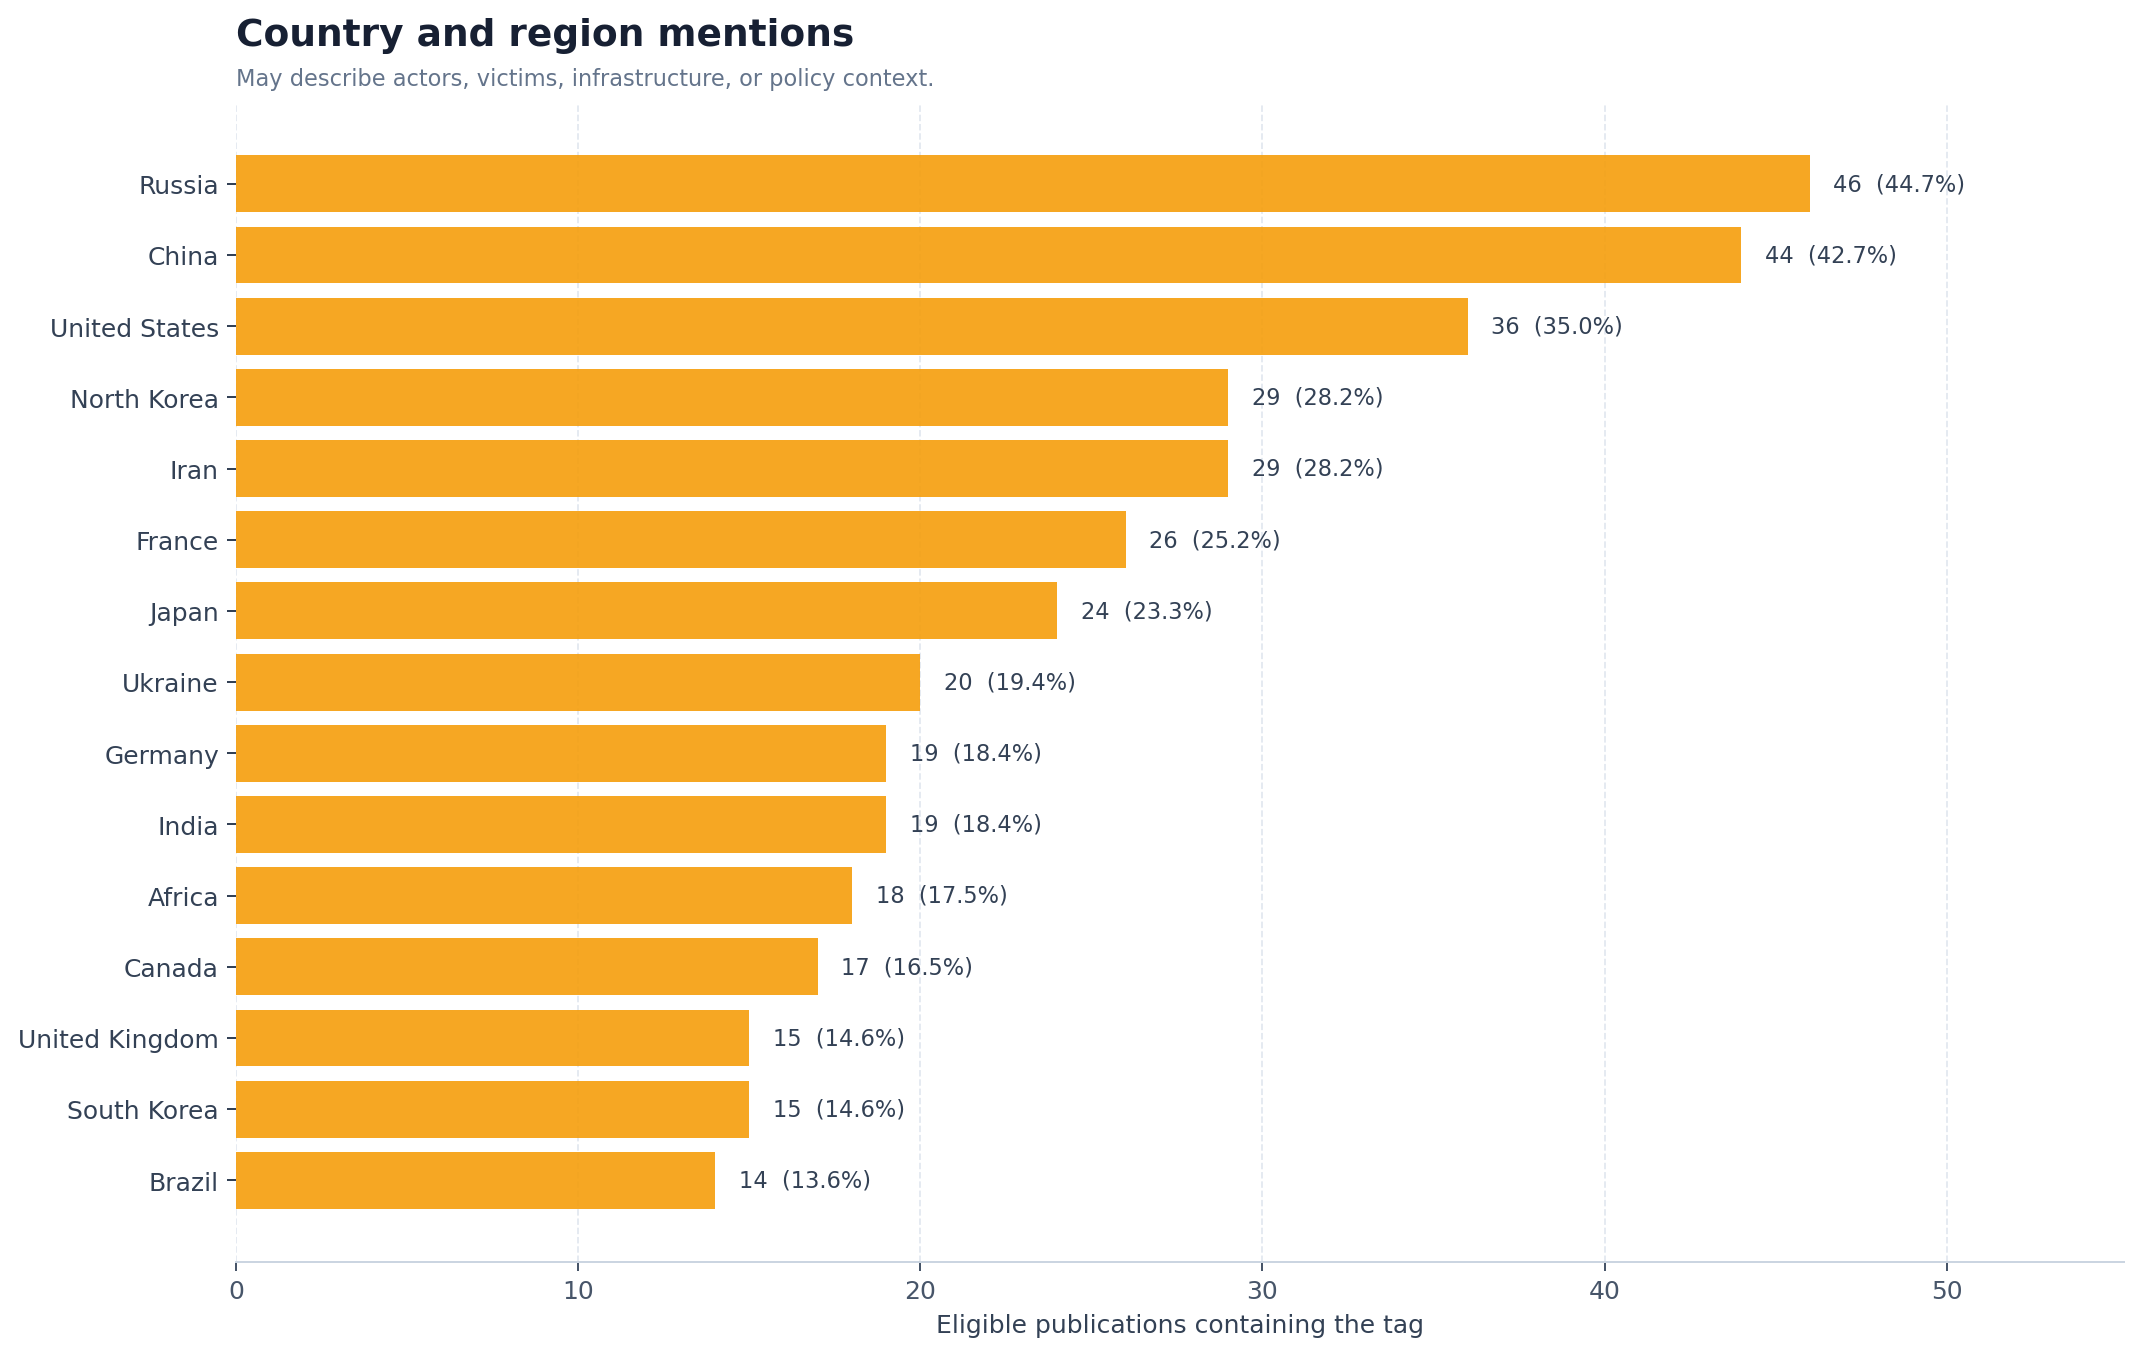
Russia, China, the United States, North Korea, and Iran are the most frequently named countries in the eligible corpus. A country mention can refer to an actor’s alleged origin, a victim, infrastructure, law enforcement, a publication’s regional scope, or policy context. The country field is therefore unsuitable for a “most attacked country” ranking without relation-level coding.
LLM providers, models, and malicious-AI brands
Provider and model mentions
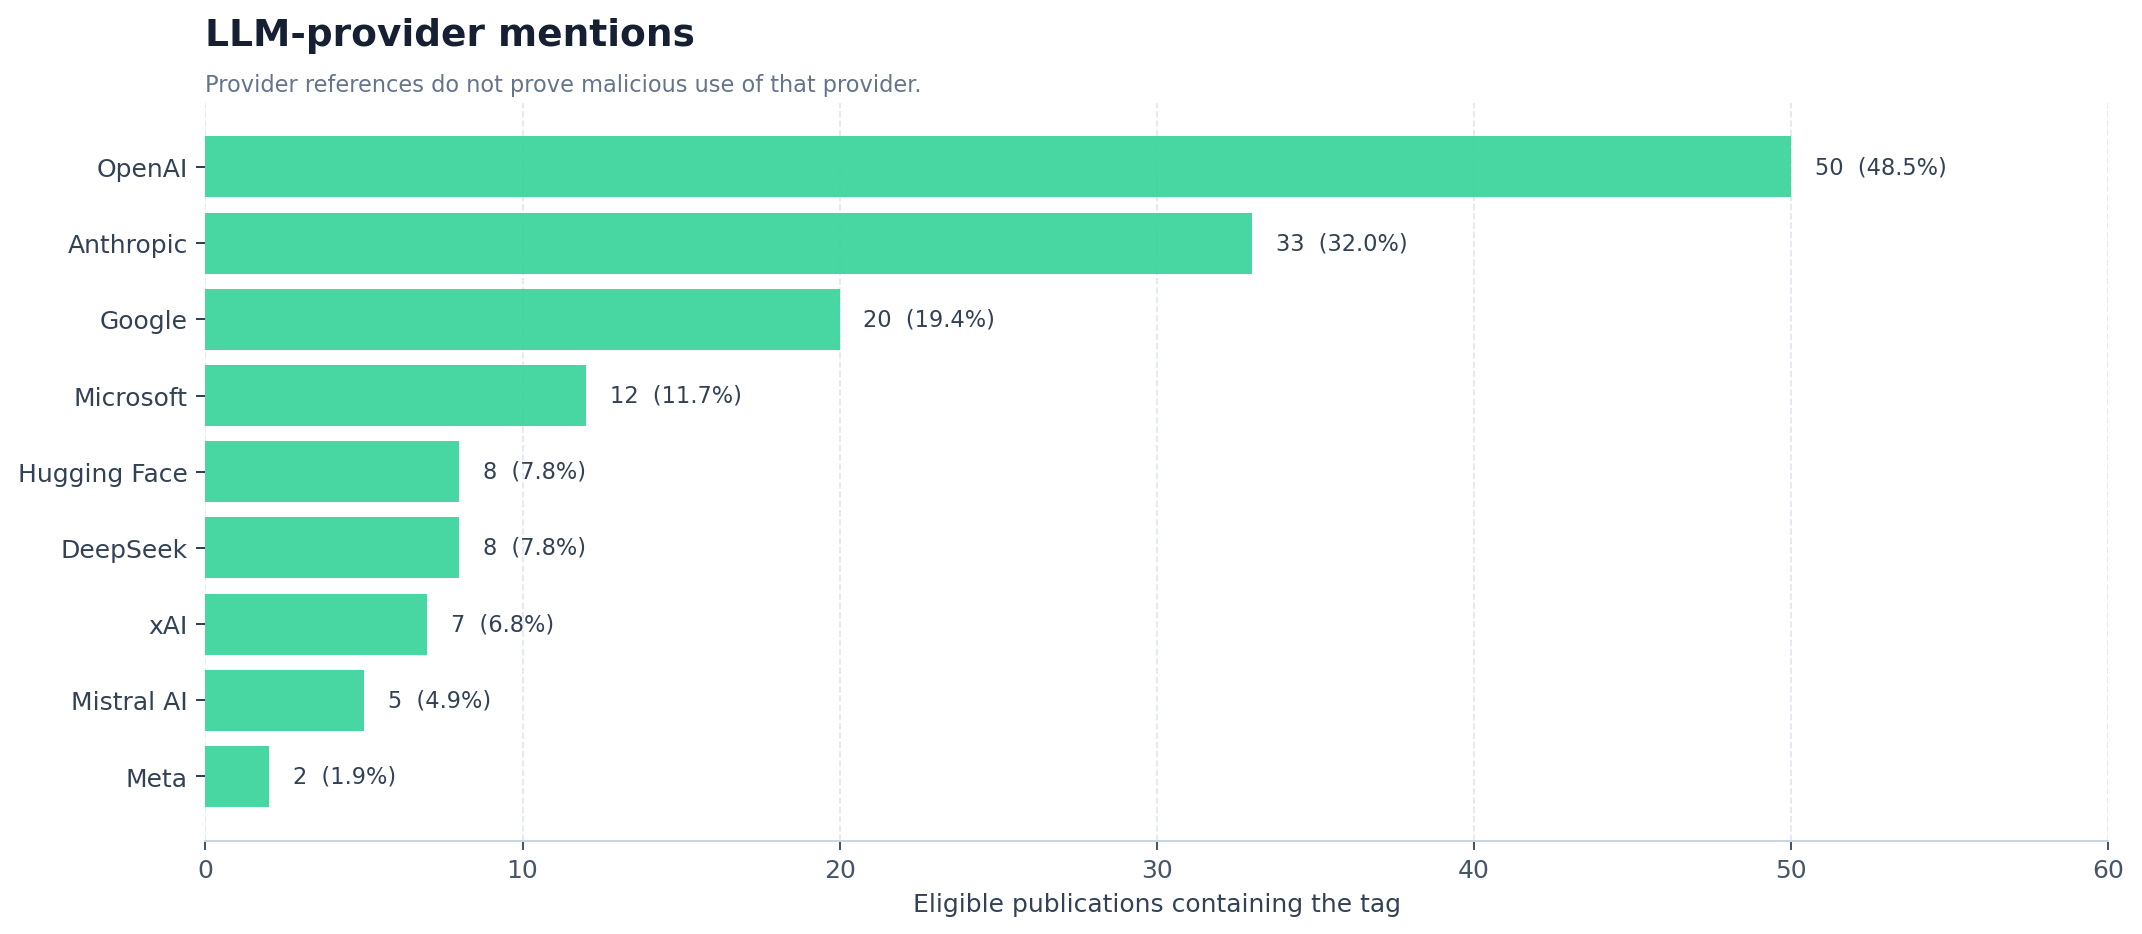
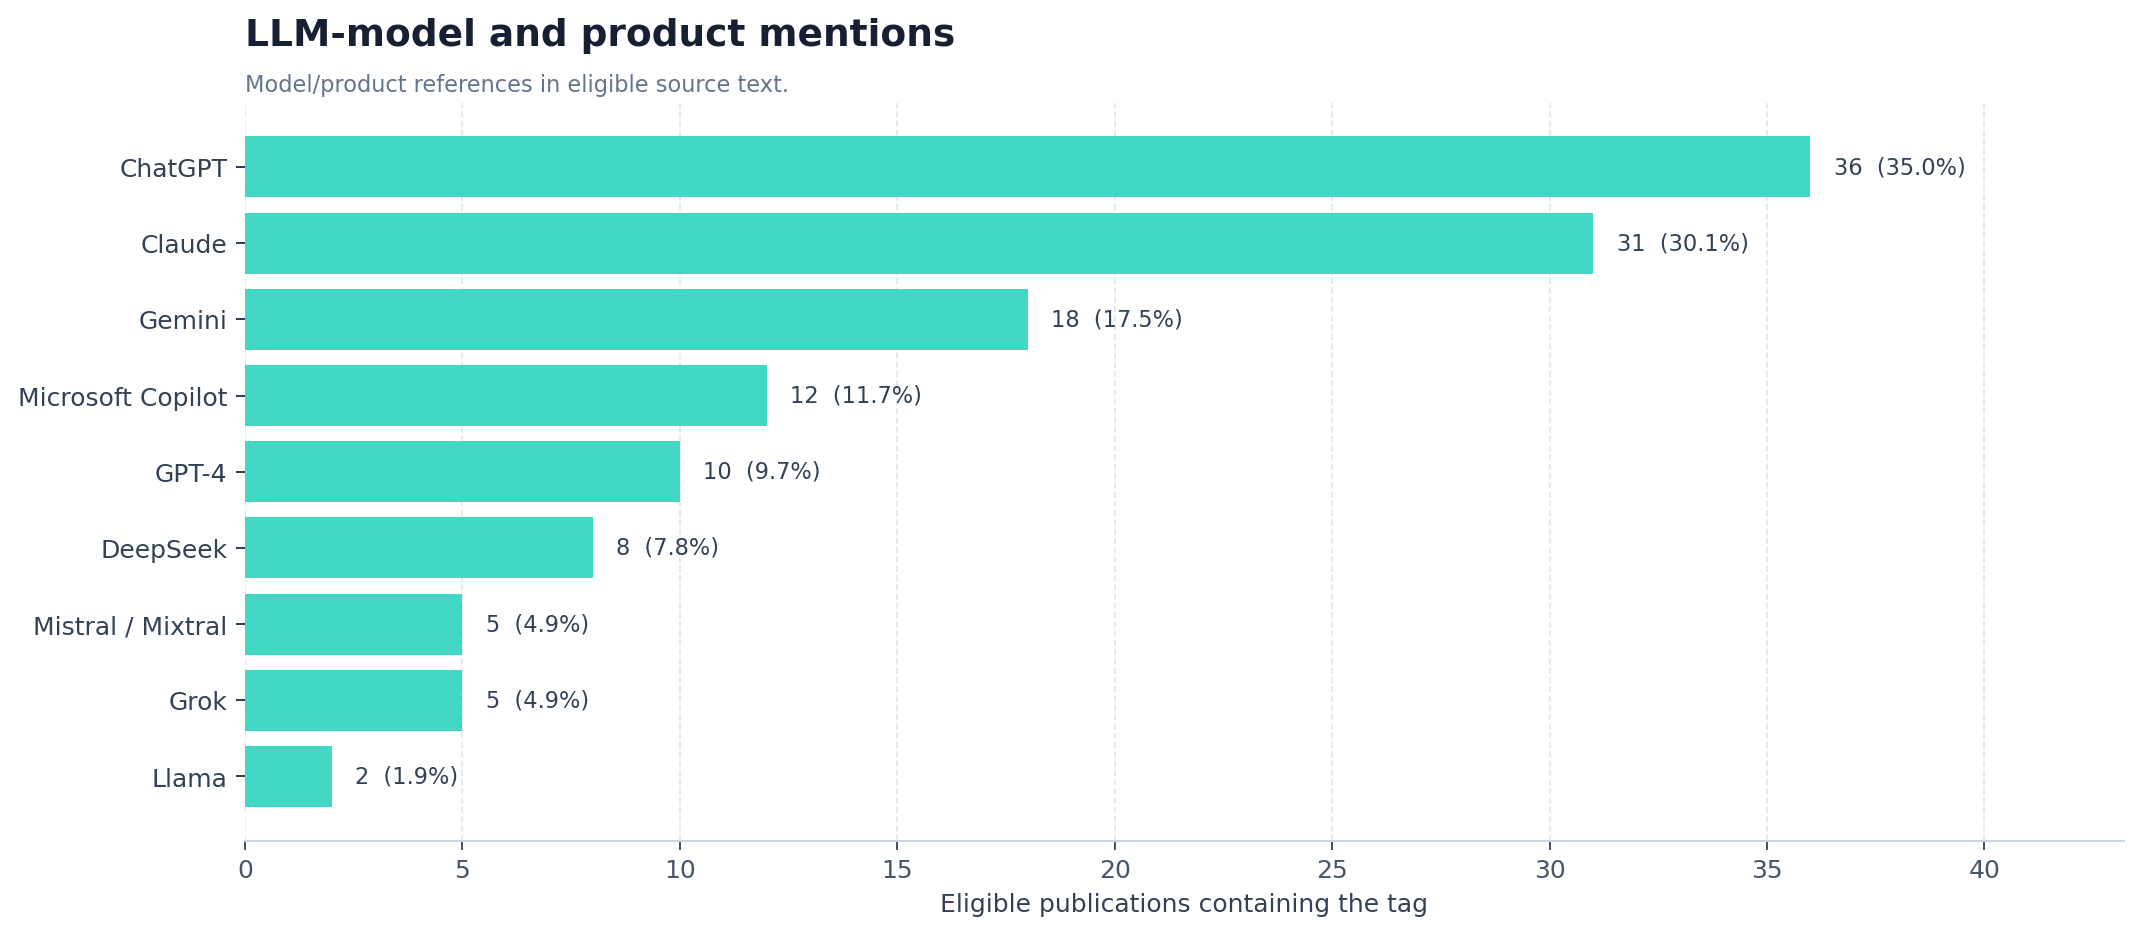
OpenAI appears in 50 eligible publications (48.5%), Anthropic in 33 (32.0%), and Google in 20 (19.4%). ChatGPT, Claude, and Gemini lead the product/model list. Provider-authored transparency reports are part of the corpus, so a provider can be counted because it published defensive findings, because another report discussed its service, or because the service appeared in an experiment. The correct label is provider mention coverage, not attacker market share. The OpenAI reference pivot exposes the eligible records behind that count.
Named malicious-AI tools
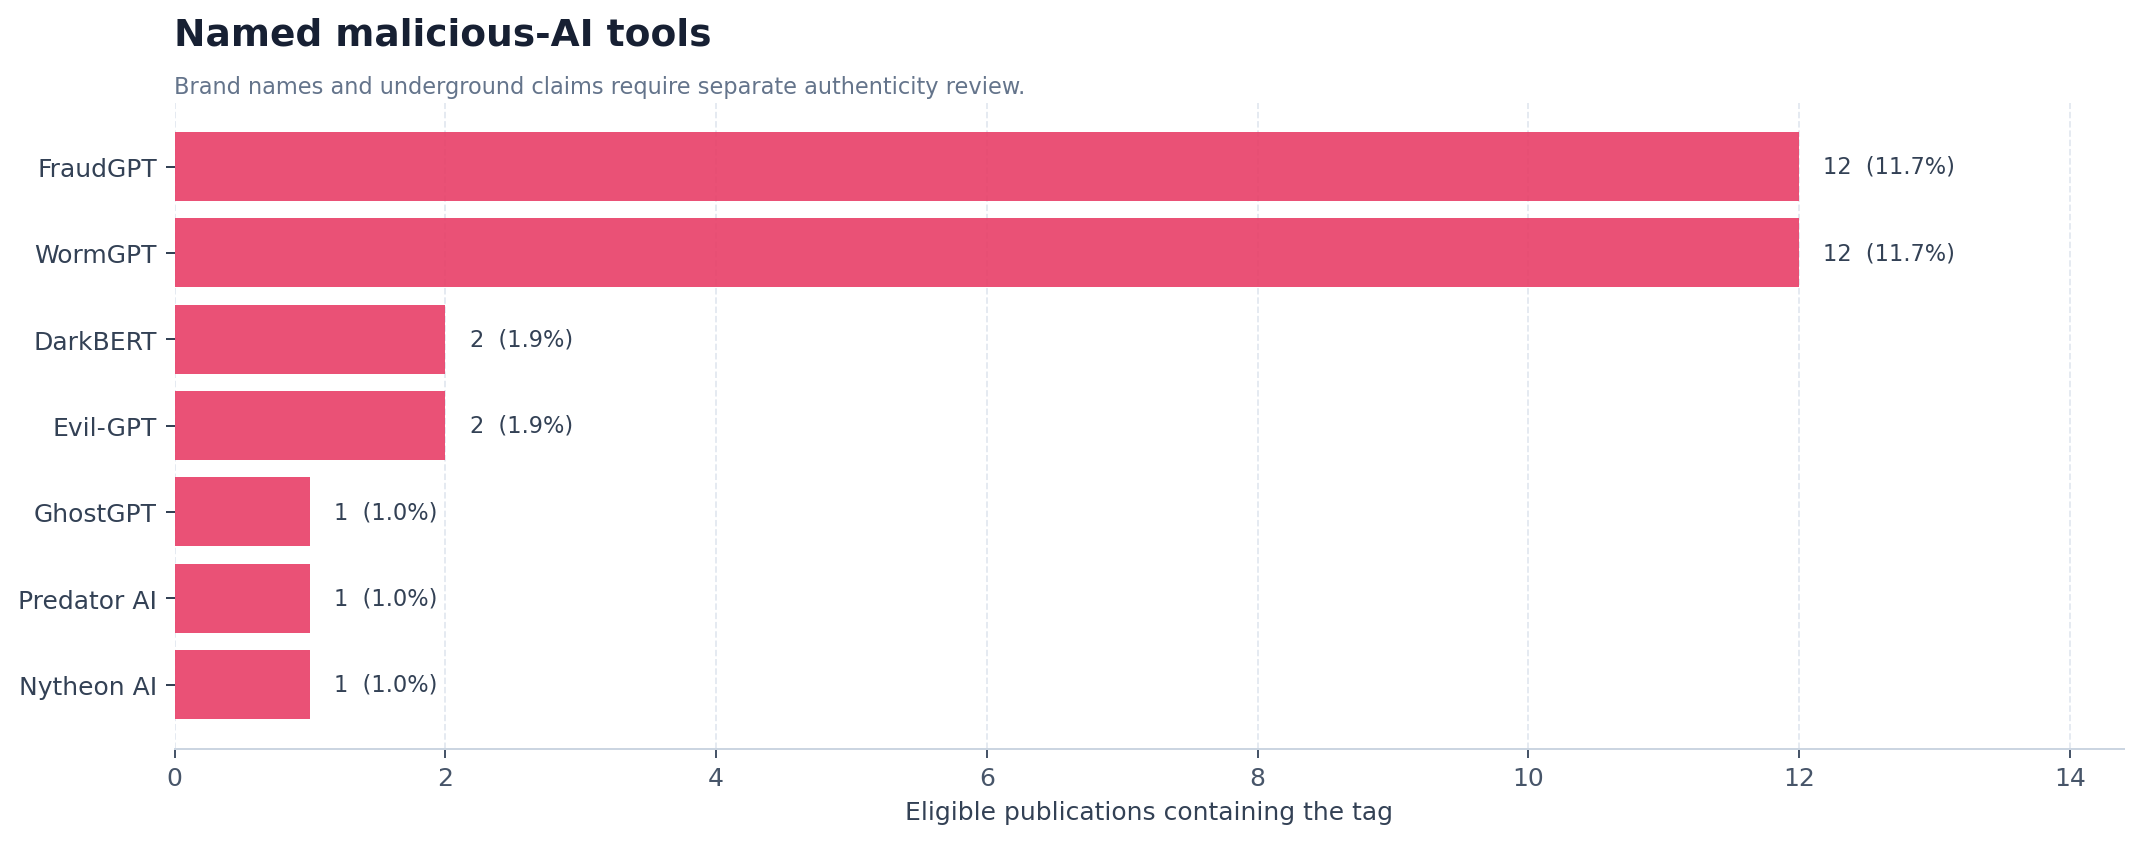
FraudGPT and WormGPT each appear in 12 publications. Underground names can be rebrands, scams, wrappers, marketing claims, or repeated secondary reporting. Their presence should trigger source and capability validation, not automatic classification as a distinct operational model.
Malware and tooling co-mentions
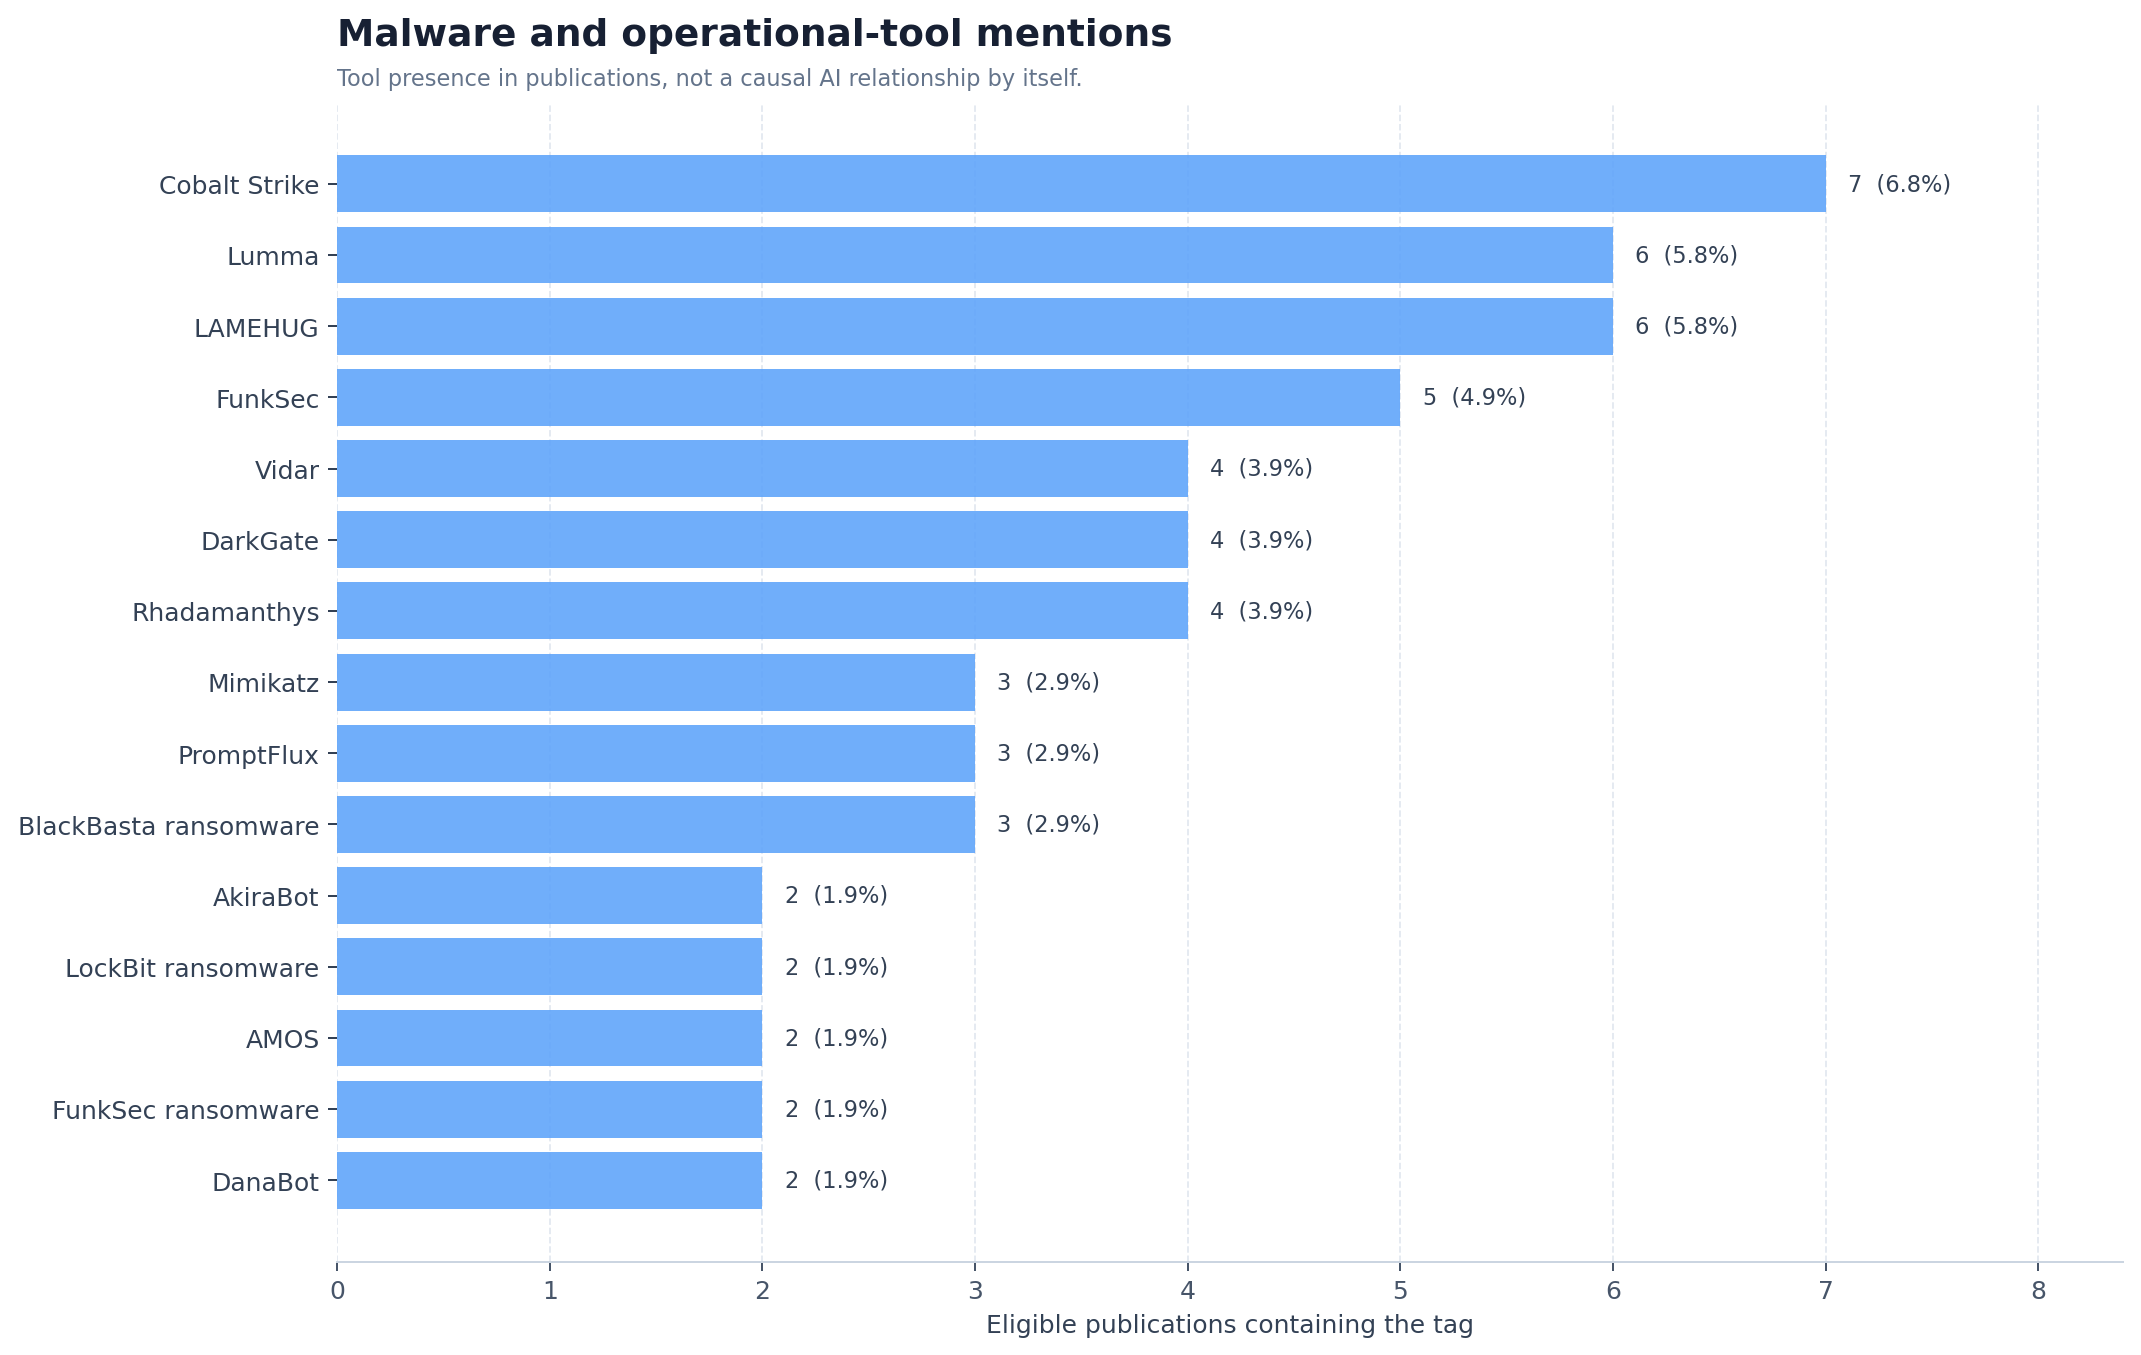
Named malware and tools are co-mentions in publications, not proof that AI generated, operated, or materially changed them. Use this distribution as a reading queue, then validate the exact claim and technical evidence through the Malware Analysis knowledge path.
Attack vectors, infrastructure, data, and impact
Attack vectors
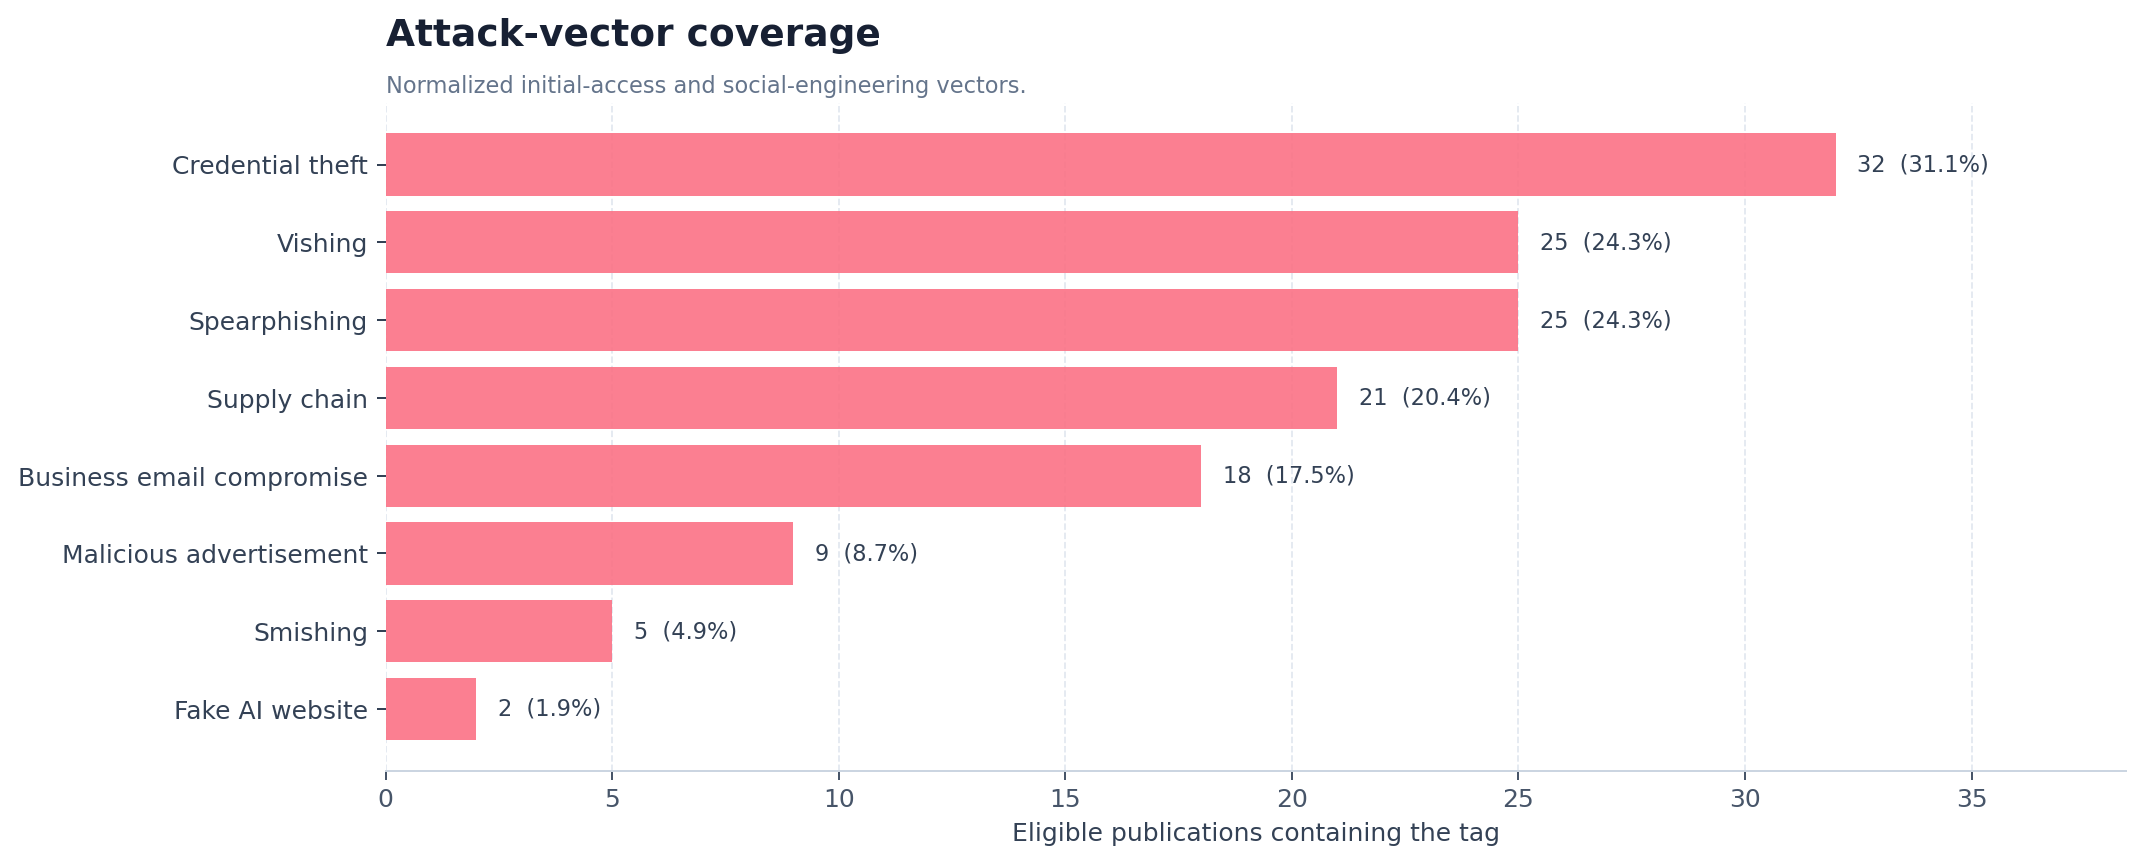
Credential theft, vishing, spearphishing, supply-chain references, and business email compromise dominate. This supports a practical defensive priority: AI-related attack research must remain connected to established identity, email, browser, endpoint, and fraud controls rather than being isolated in a separate “AI” queue.
Infrastructure and data types
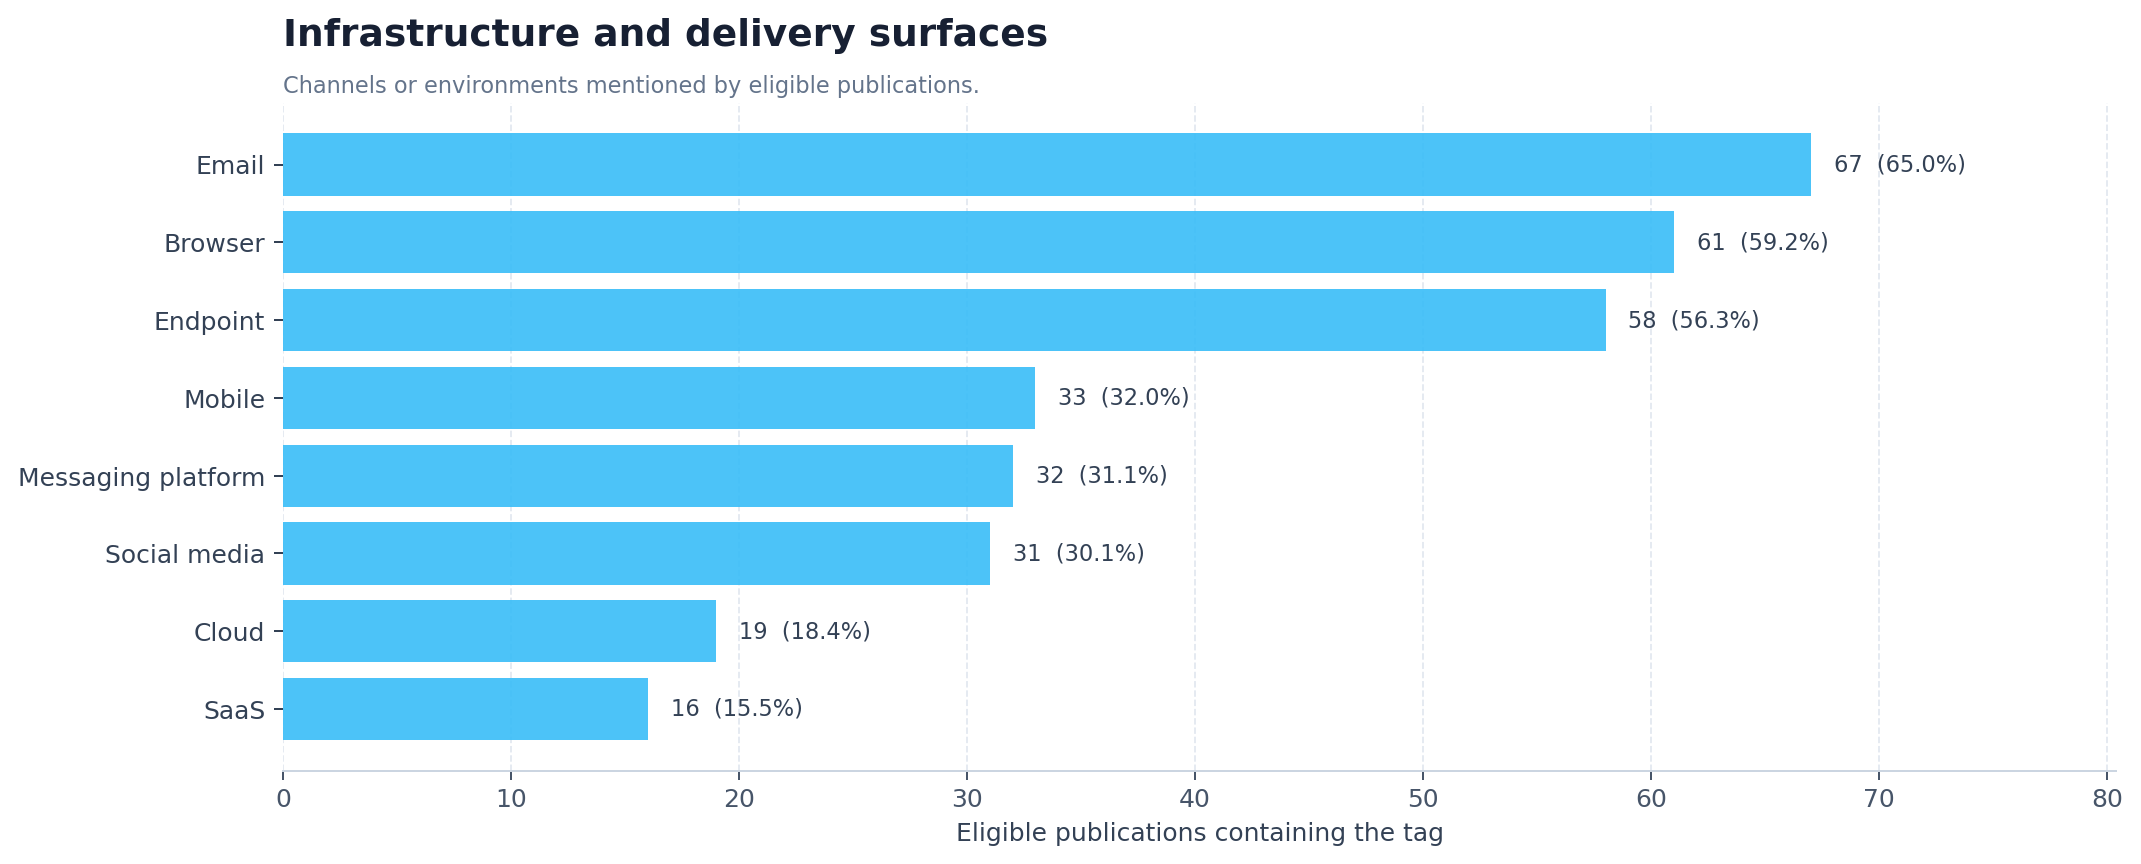
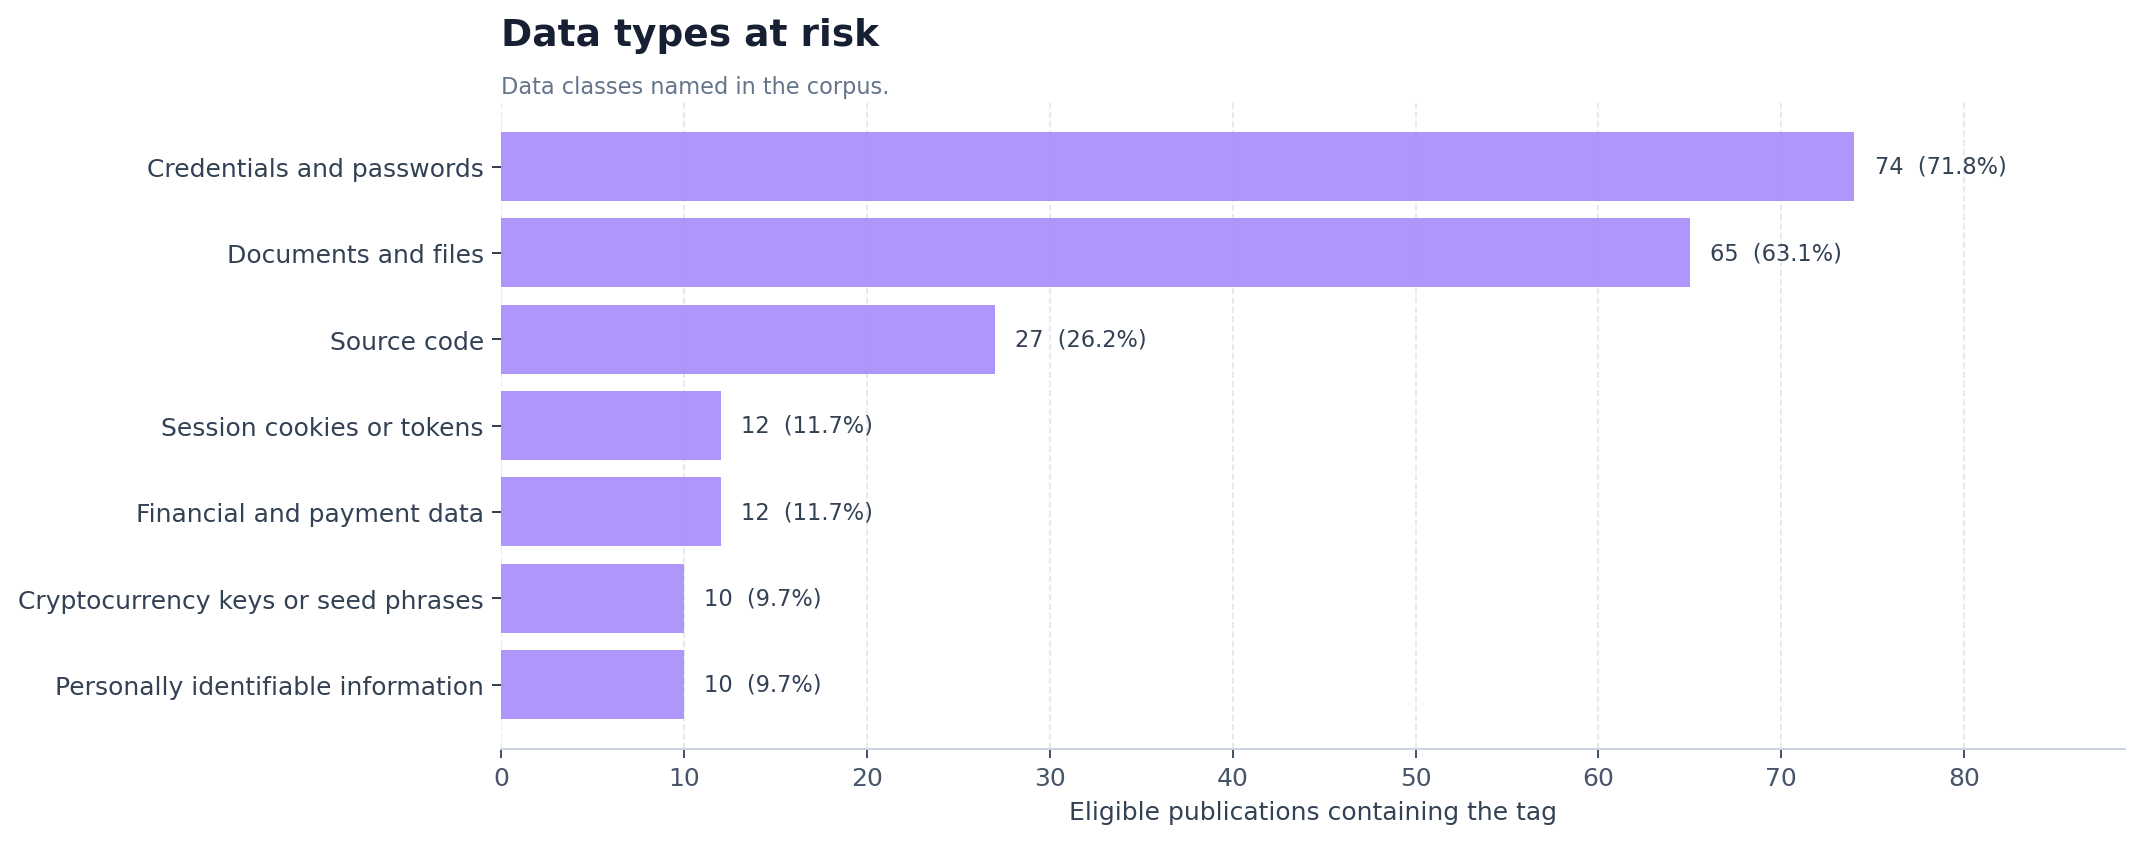
Email appears in 67 eligible publications, browsers in 61, and endpoints in 58. Credentials/passwords appear in 74 and documents/files in 65. These are publication co-mentions, but they identify high-value telemetry intersections for defensive validation.
Motivation and impact
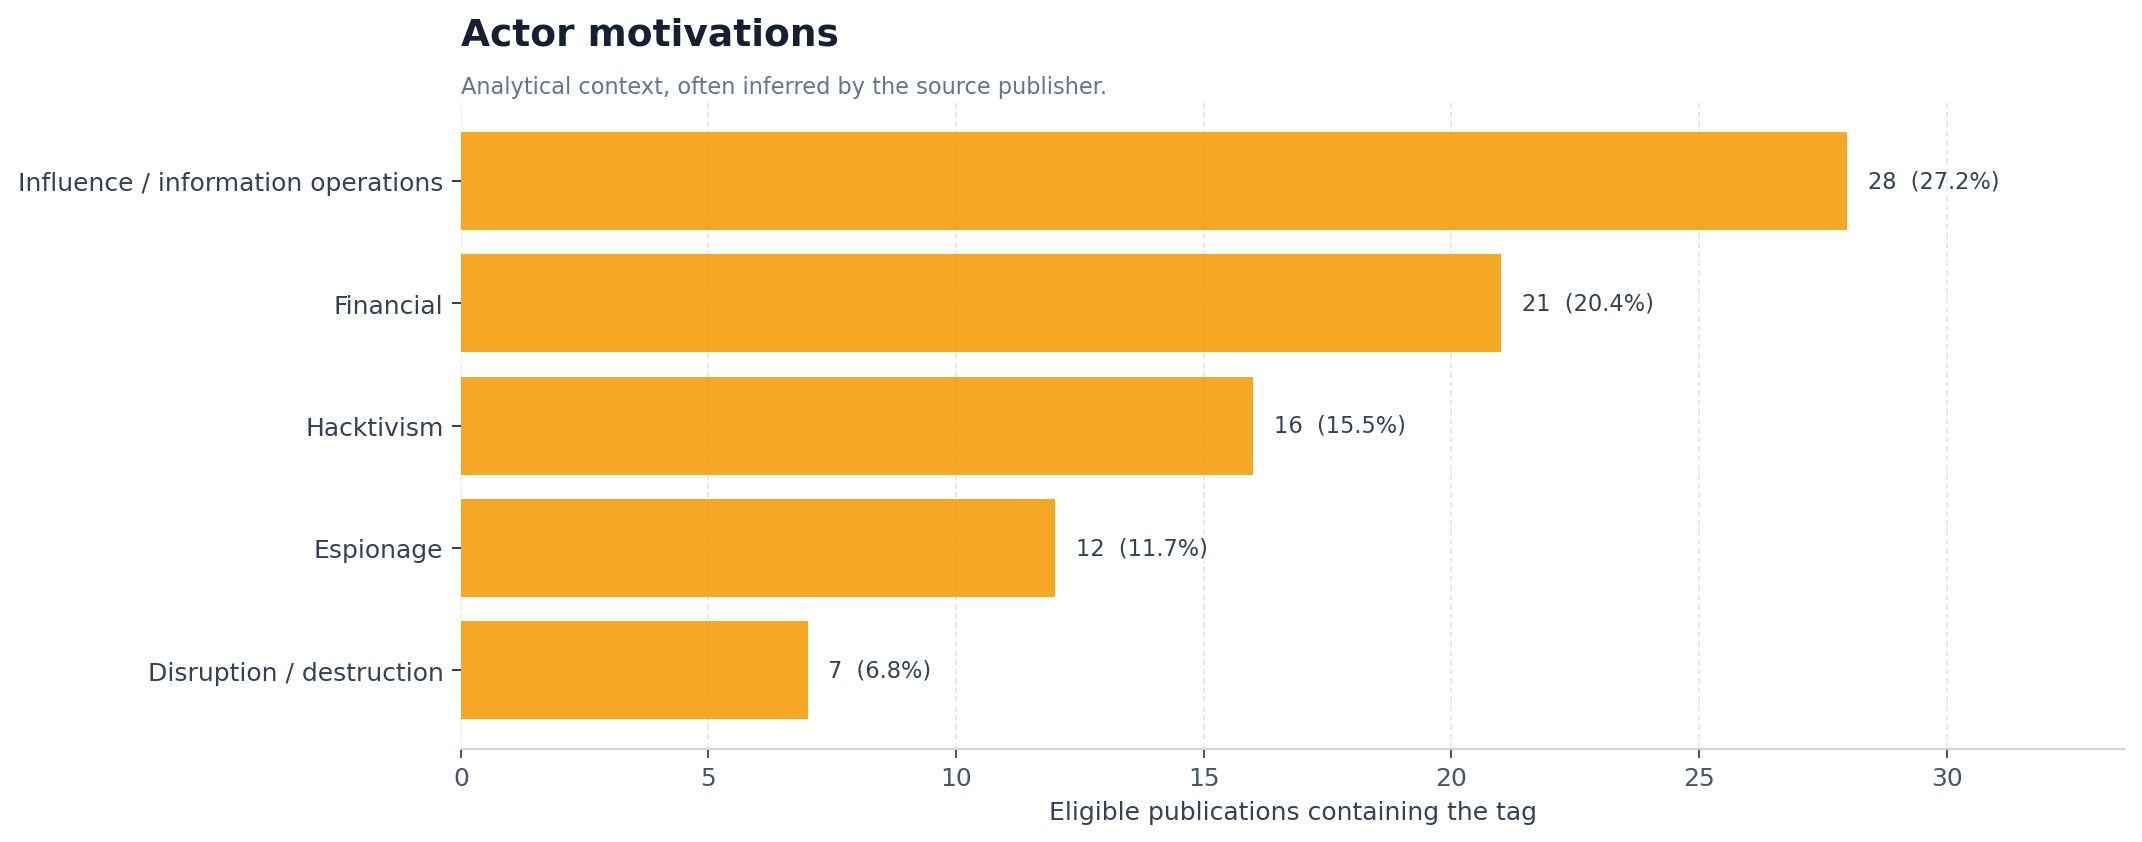
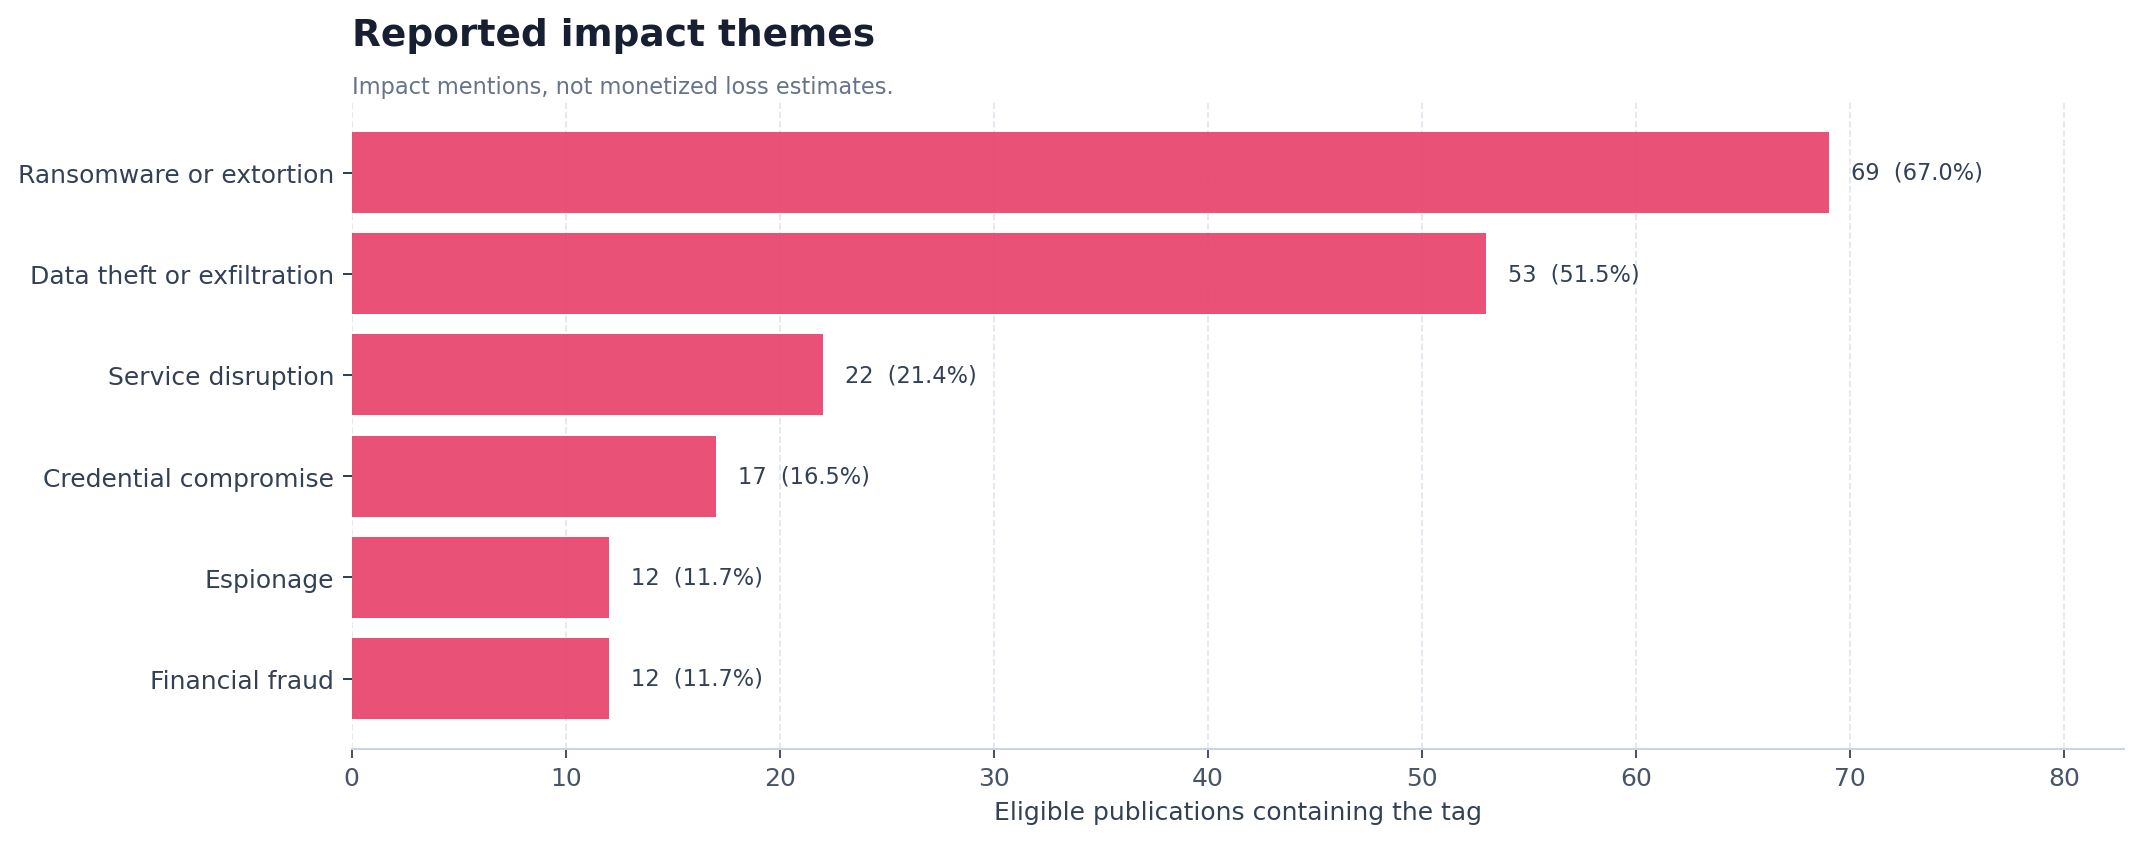
Ransomware/extortion is the most frequent impact theme at 69 publications, followed by data theft/exfiltration at 53. Influence operations lead the motivation tags at 28 publications, followed by financial motivation at 21. Motivation is often a publisher inference; impact can be forecast, simulated, or observed. Analysts must retain that distinction.
Evidence maturity
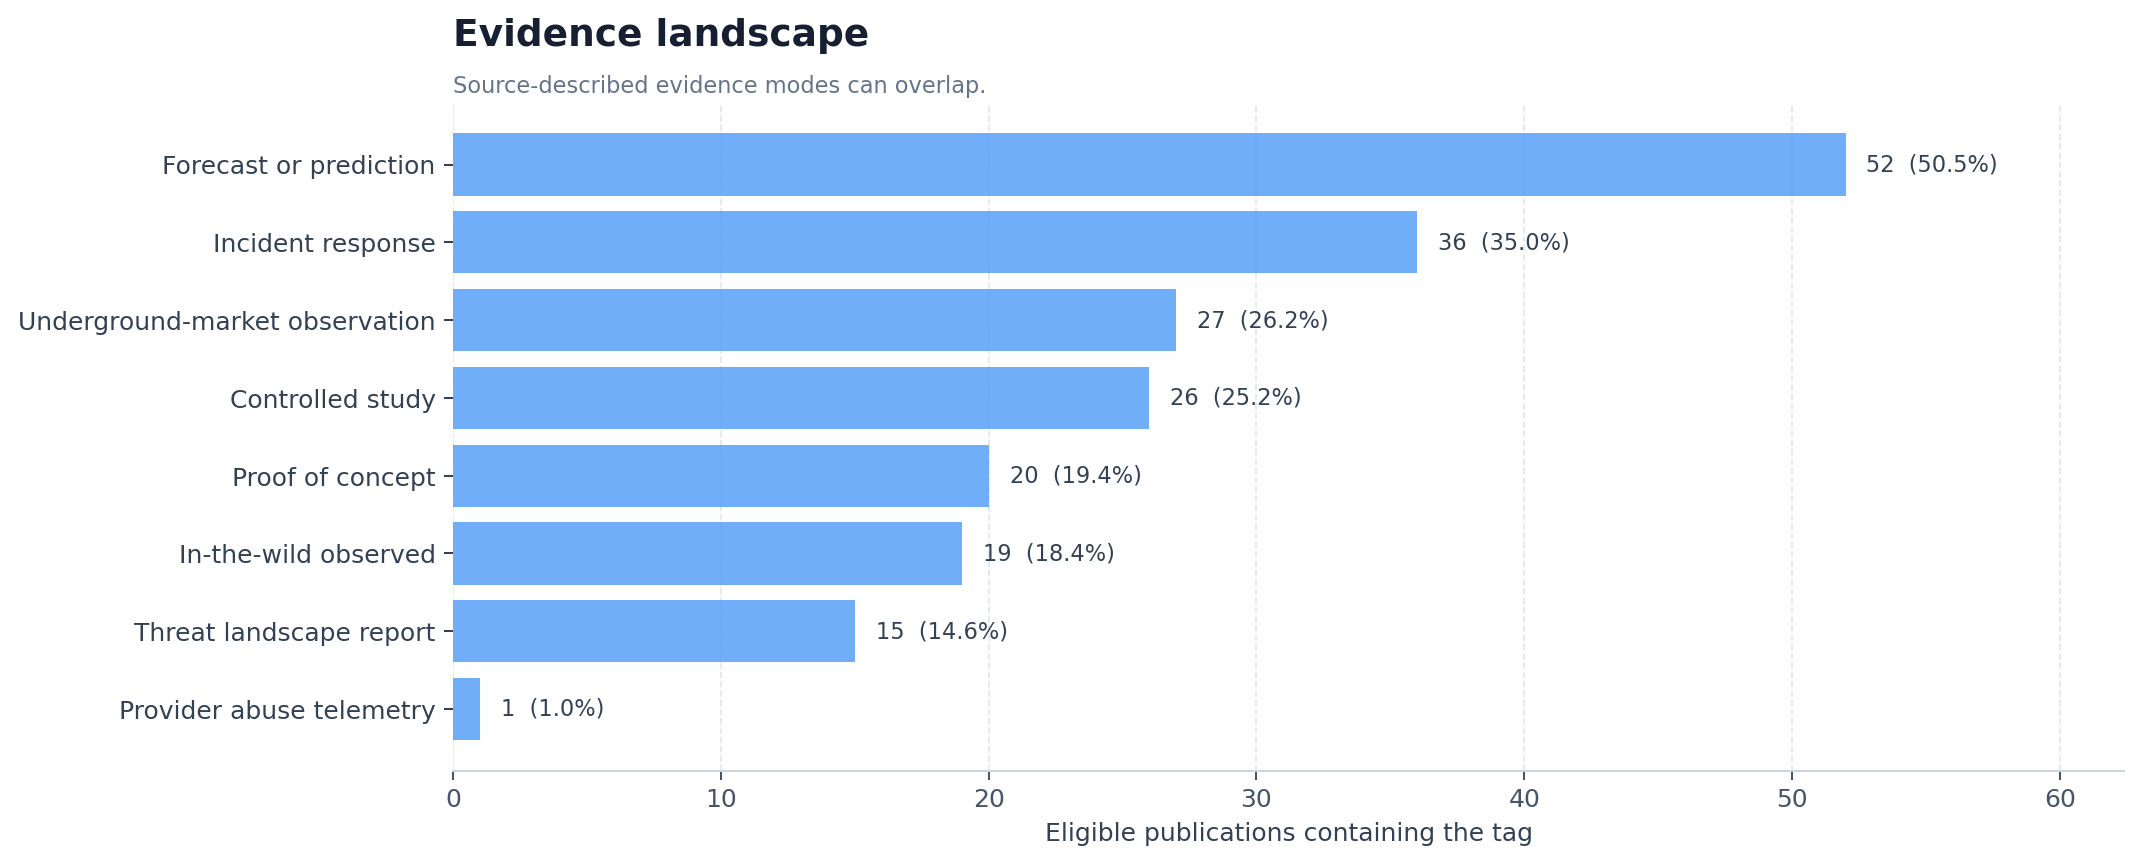
Forecast or prediction appears in 52 eligible publications, incident response in 36, underground-market observation in 27, controlled study in 26, proof of concept in 20, and in-the-wild observation in 19. These categories overlap, but the mix shows why a single headline percentage would be misleading. The dataset combines prospective assessments, operational observations, controlled research, and provider telemetry.
For the most operational subset, start with the in-the-wild evidence pivot, then verify each publisher's evidence and methodology.
Quantitative metrics, IOCs, and CVEs
Quantitative metric coverage
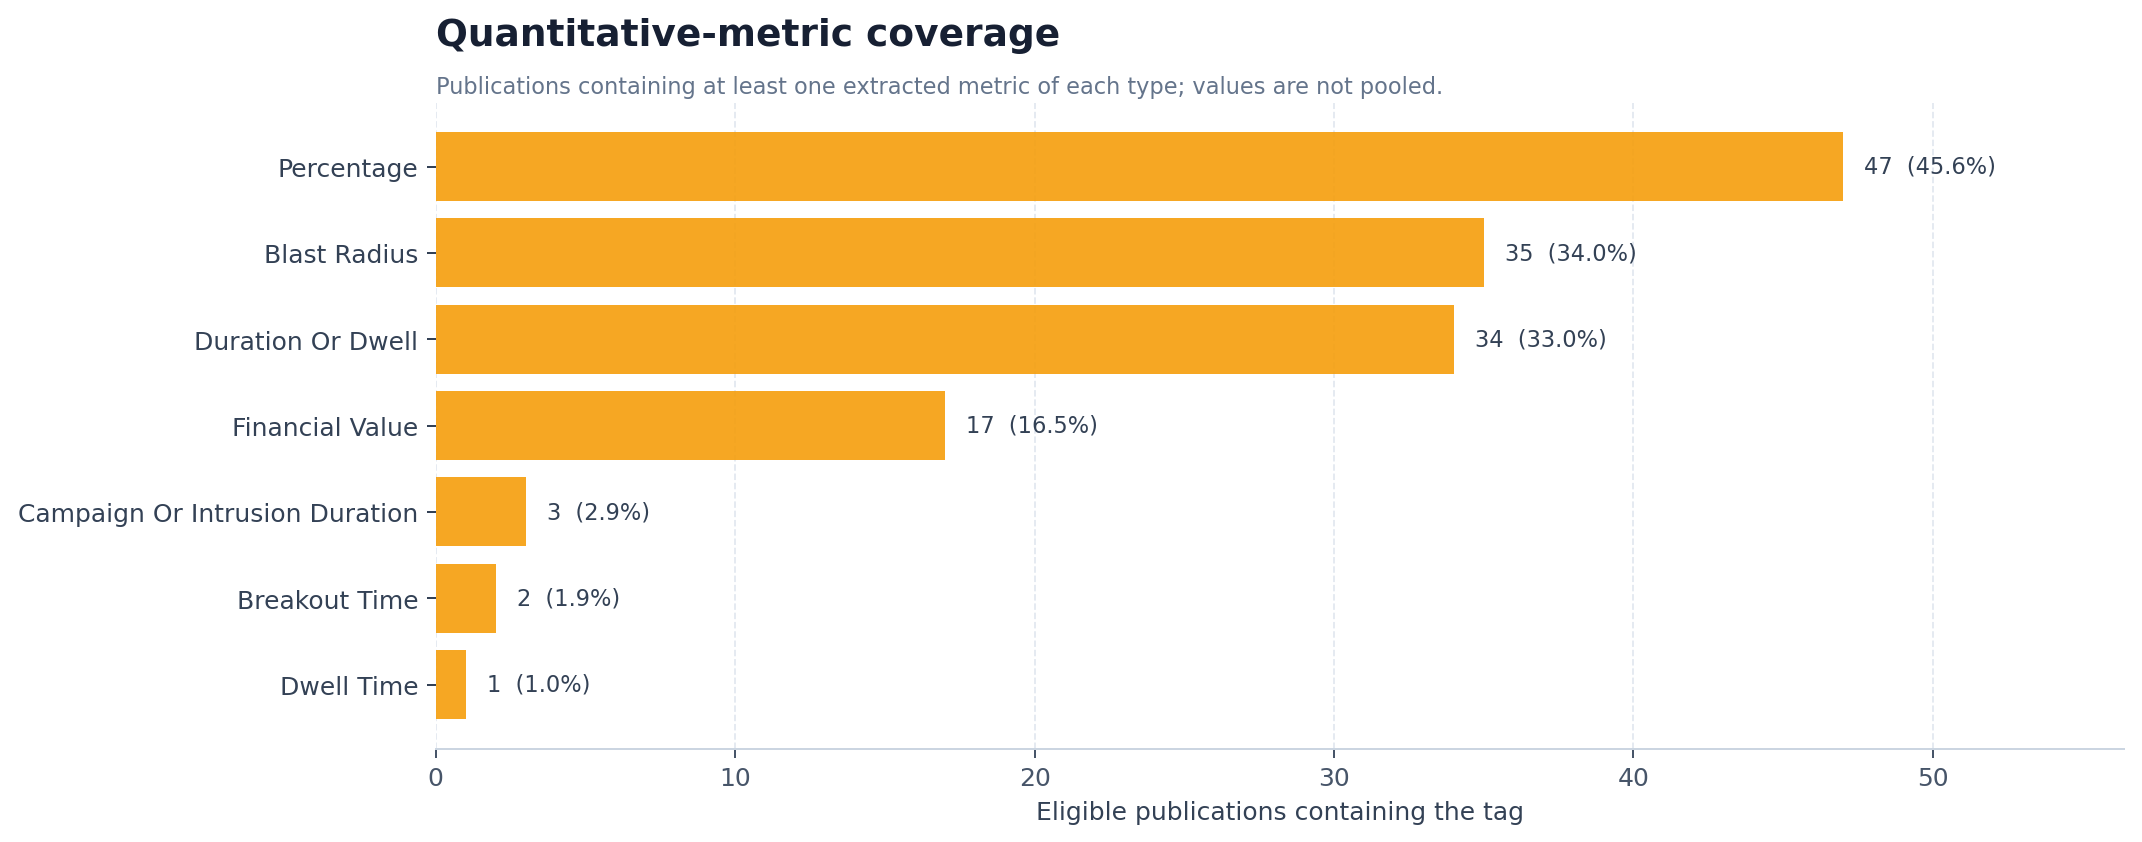
The eligible corpus contains 919 machine-extracted metric candidates across 69 publications. Percentages are the dominant extracted class, but they describe different denominators: phishing success, fraud growth, observed actor activity, affected organizations, model performance, or other source-specific measures. The extraction also retains false-positive strings such as years, CVE fragments, and publisher boilerplate. Duration and blast-radius candidates are similarly heterogeneous. This study reports candidate coverage for review, not pooled means or confirmed outcomes.
IOC candidates
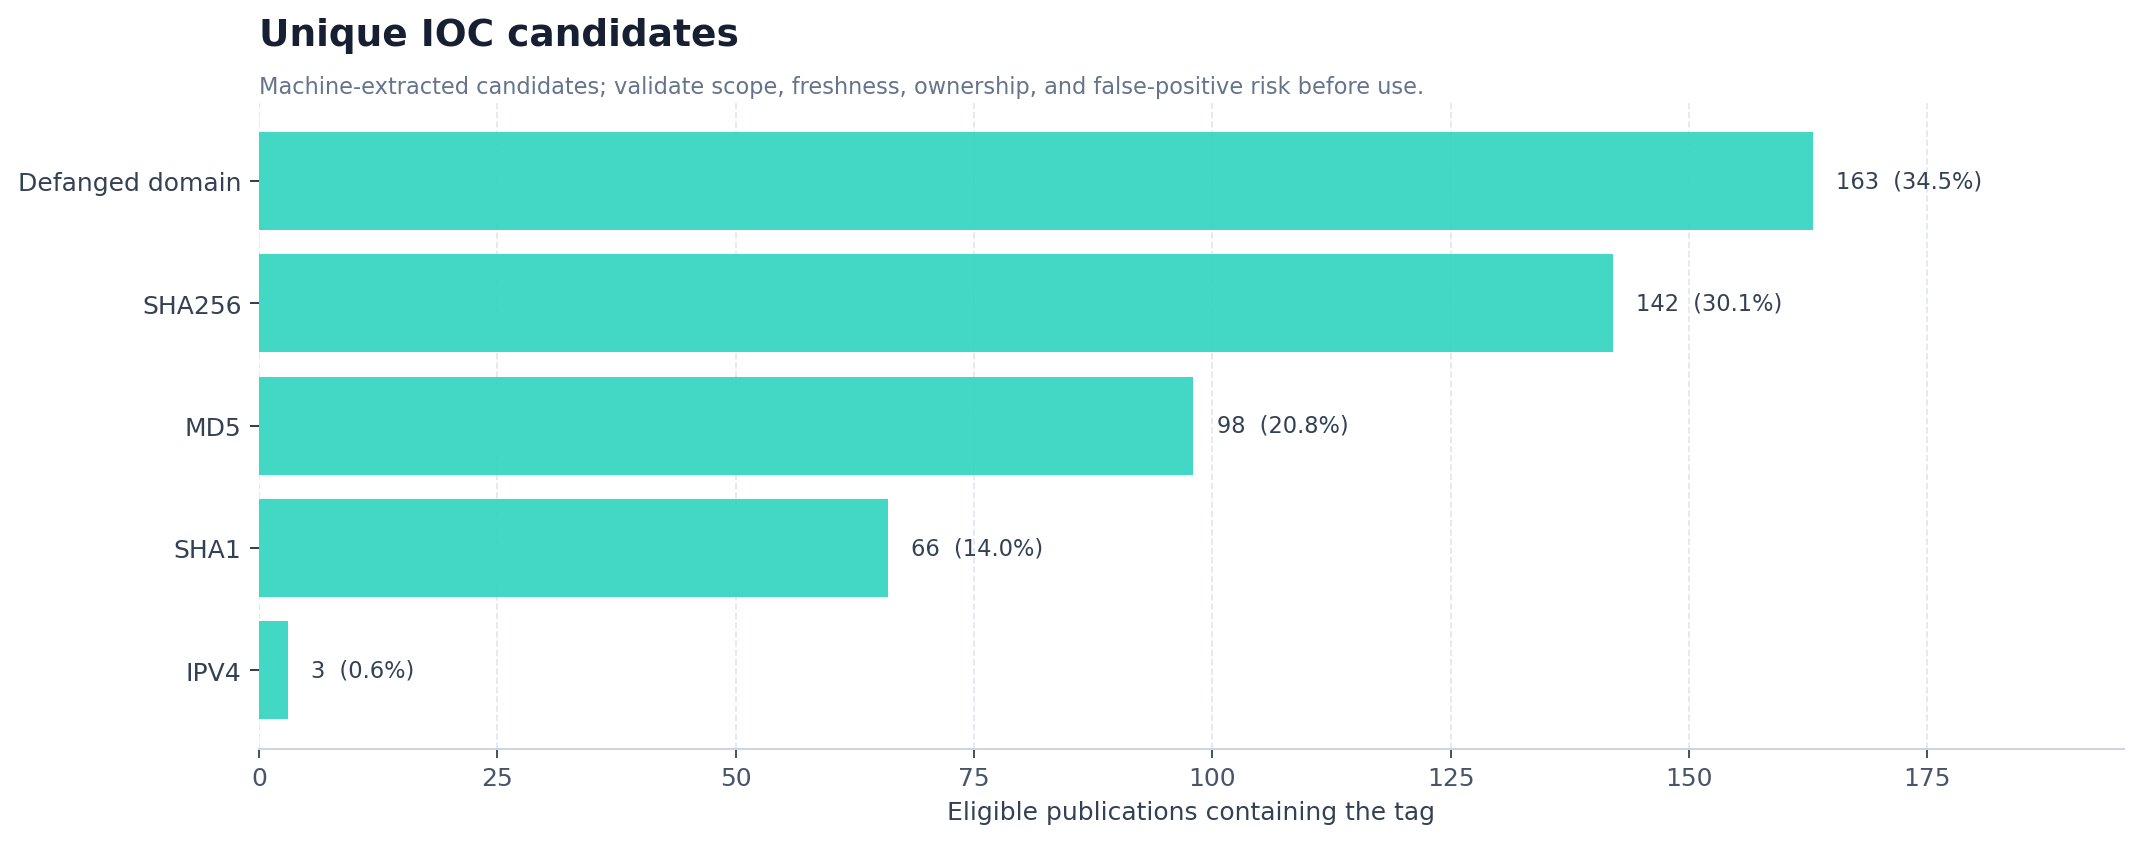
The IOC table contains 483 candidate mentions across 29 eligible publications. The largest categories are defanged domains and cryptographic hashes. These candidates must be validated for exact syntax, source context, temporal relevance, infrastructure ownership, and false-positive risk before blocking, enrichment, or sharing.
CVE mentions
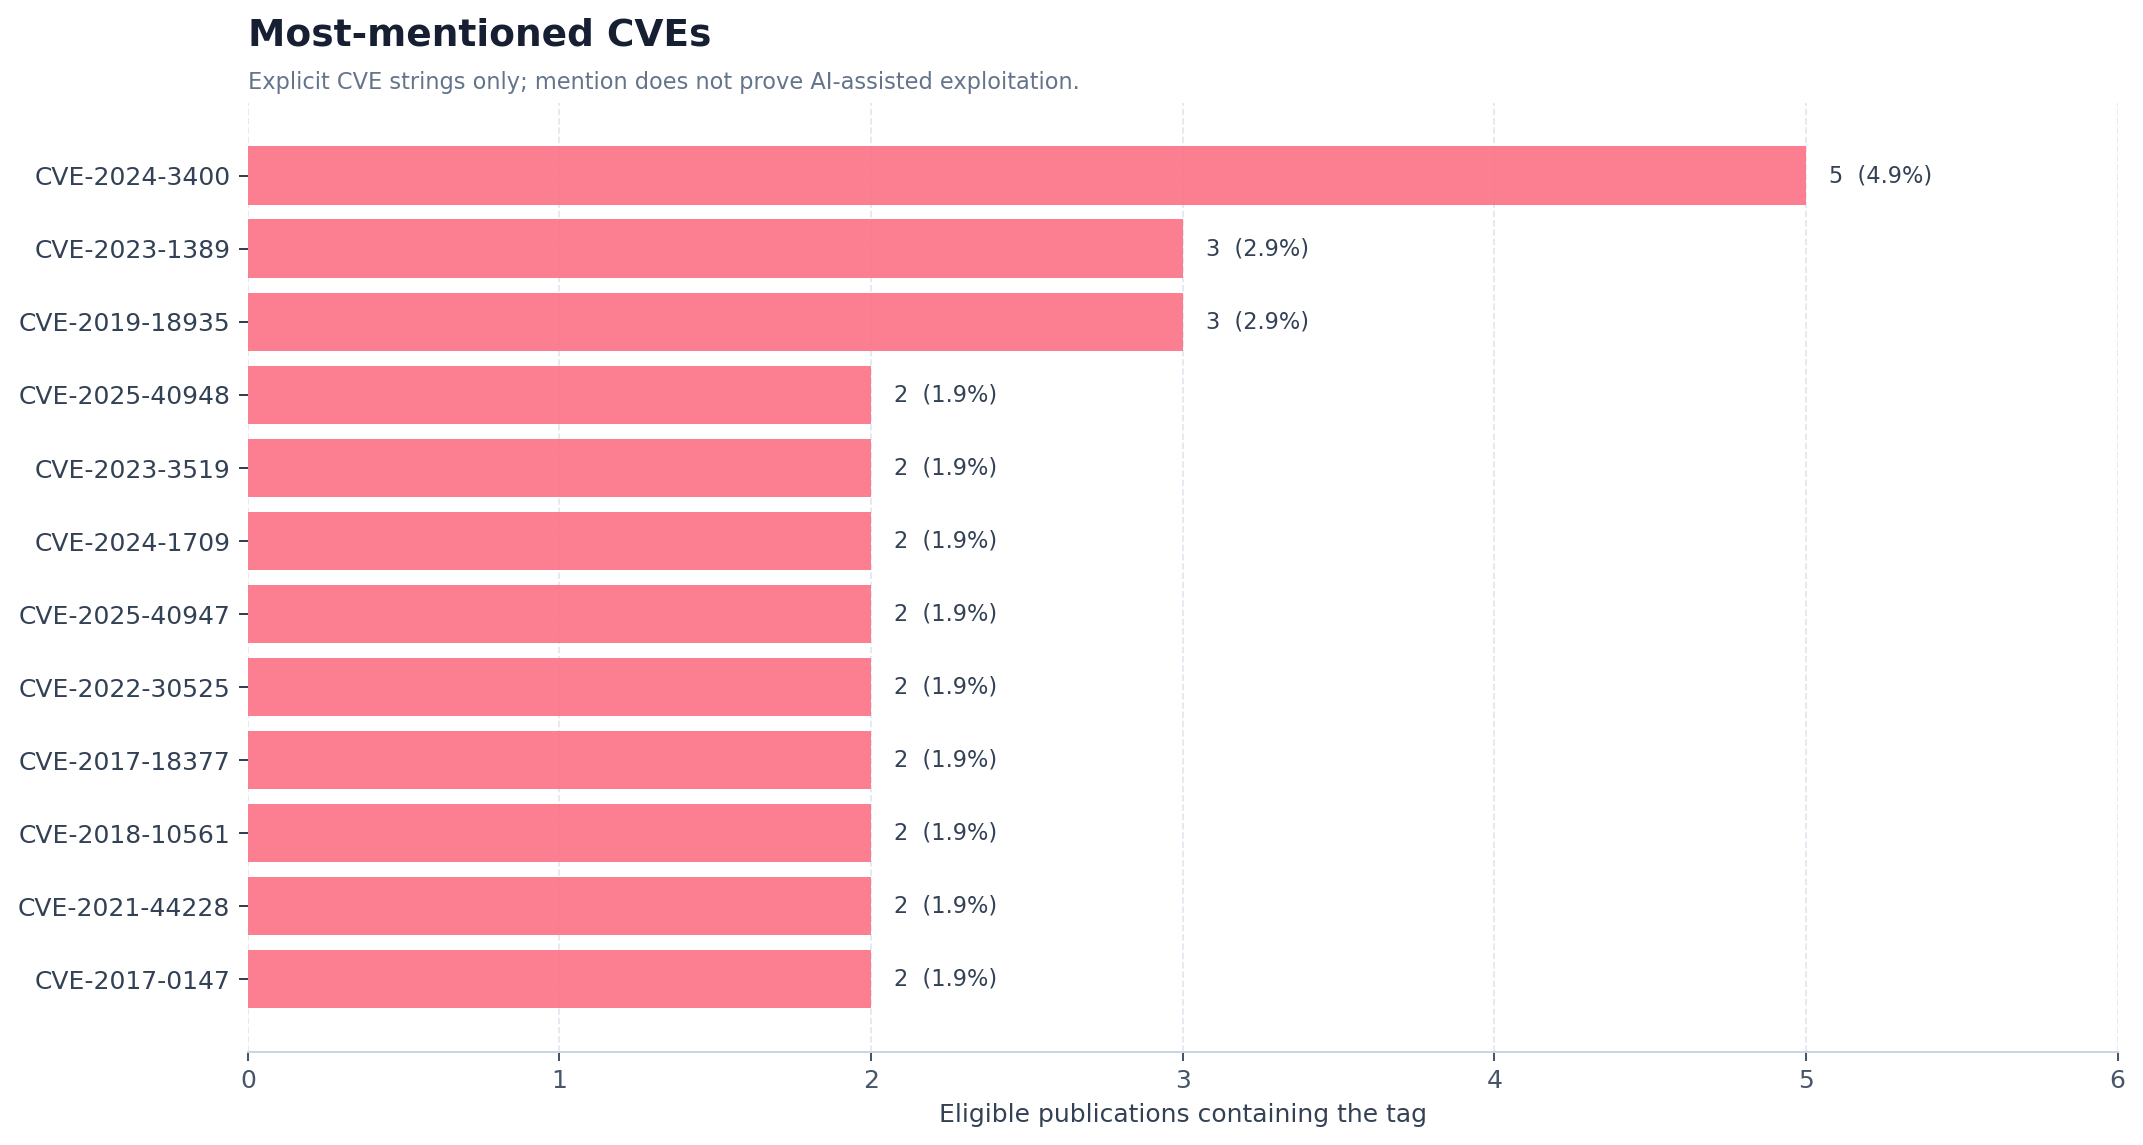
The dataset contains explicit CVE strings only. A CVE mentioned in the same publication as AI does not prove AI-assisted vulnerability discovery or exploitation. Relation-level evidence would be required to make that claim.
Cross-dimensional analysis
Cross-dimensional heatmaps count publications containing both normalized tags. They are useful for triage and hypothesis generation, but they do not establish a direct semantic relation between the two tags.
Sector × AI use case
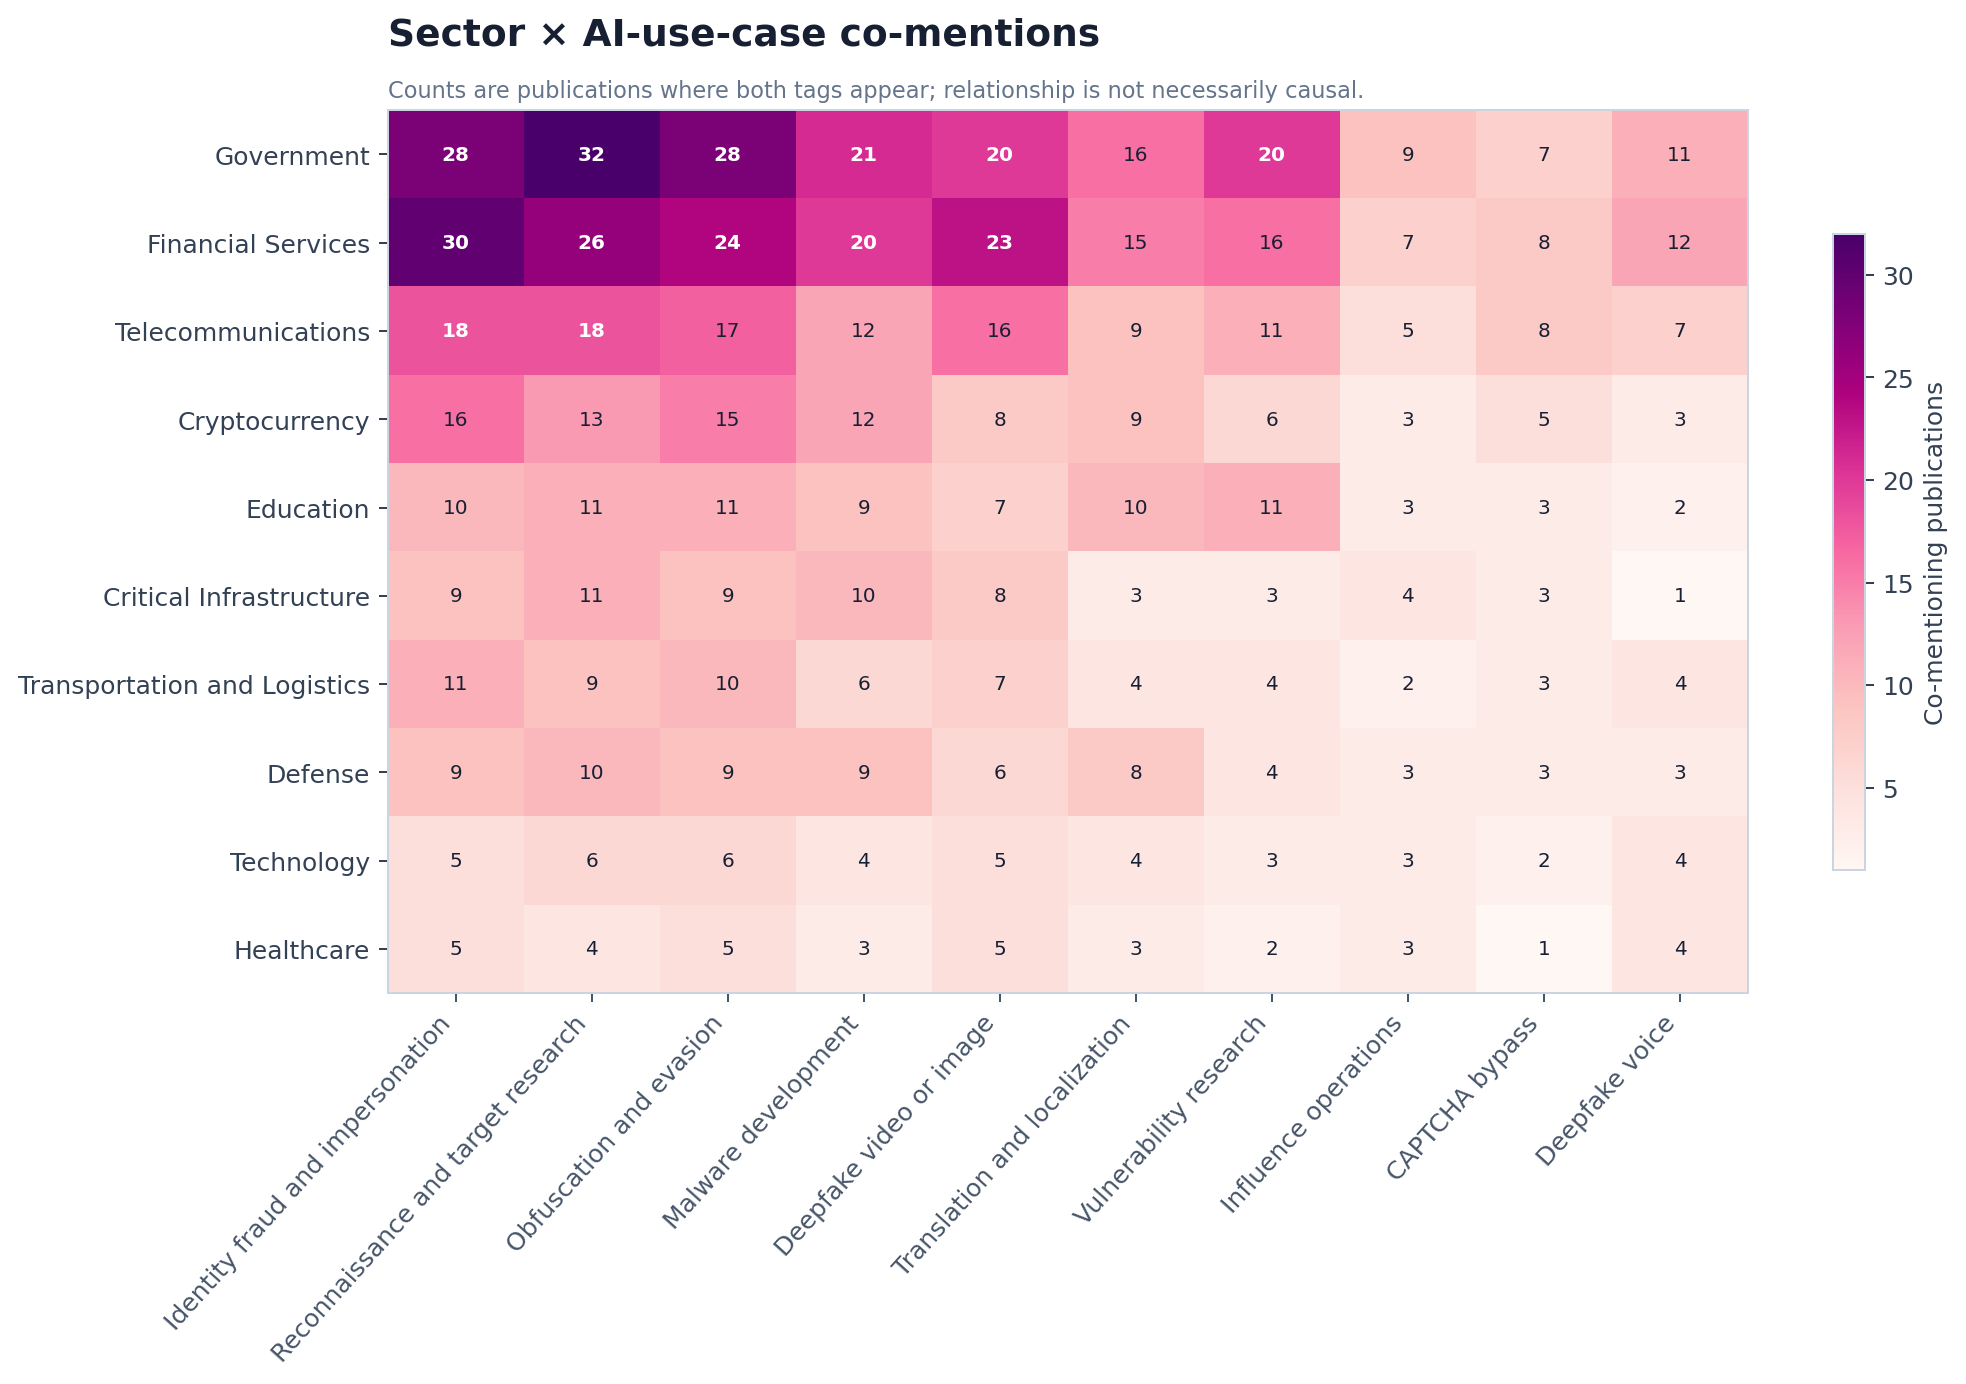
The heatmap highlights where reporting attention intersects. Identity, reconnaissance, evasion, malware development, and deepfake content recur across government, finance, telecommunications, cryptocurrency, and critical-infrastructure discussions.
Threat group × AI use case
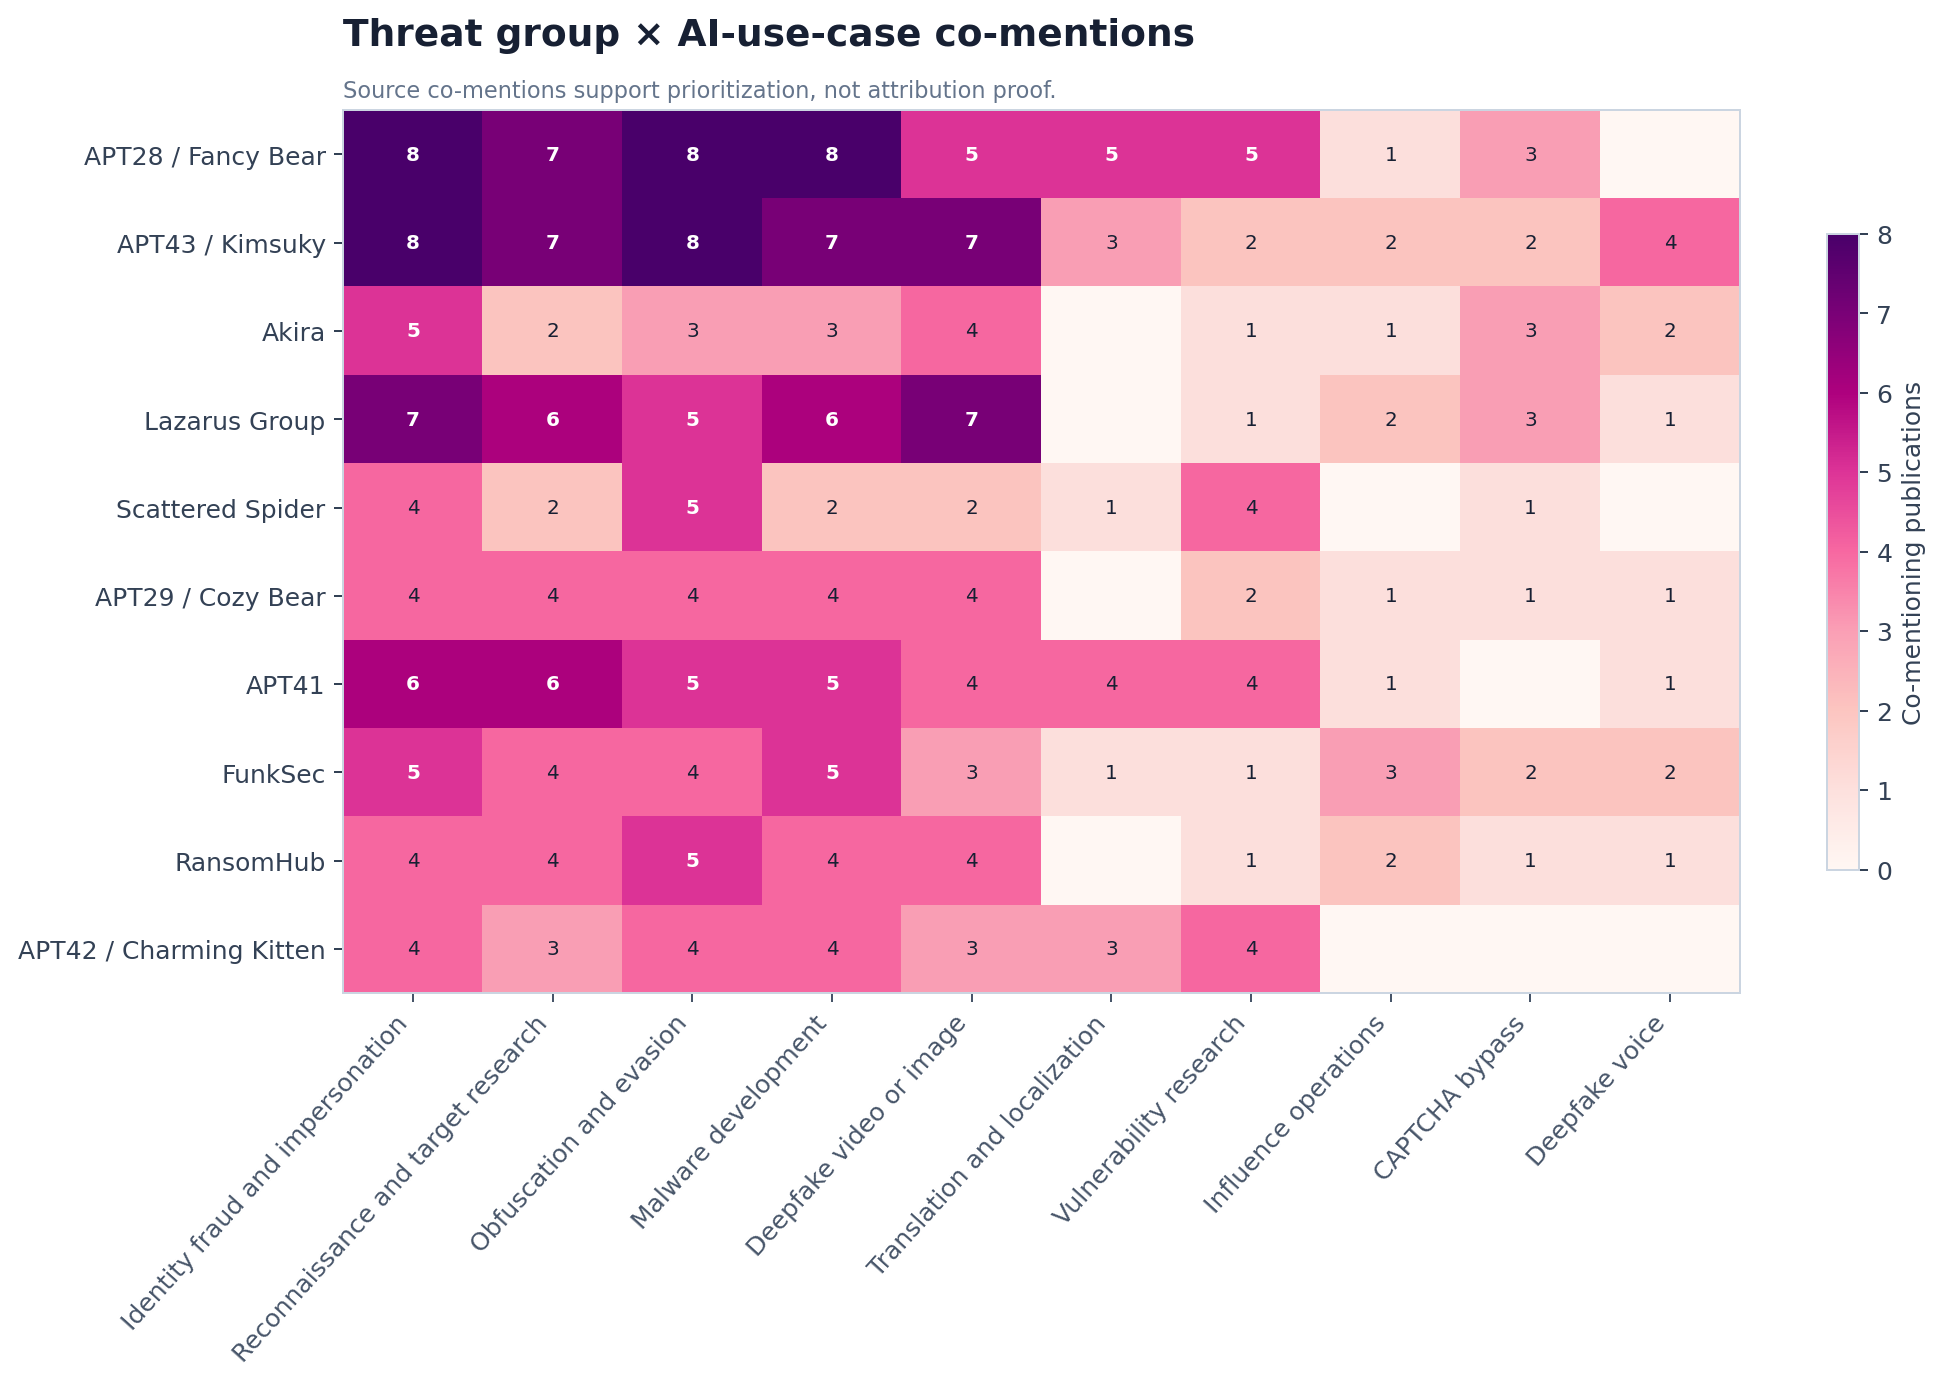
This view is an analyst work queue. A high cell means several publications name the group and use case together. Each underlying claim still requires attribution, time, actor-alias, and behavior review against the canonical publisher source or private working evidence record.
Kill Chain × AI use case
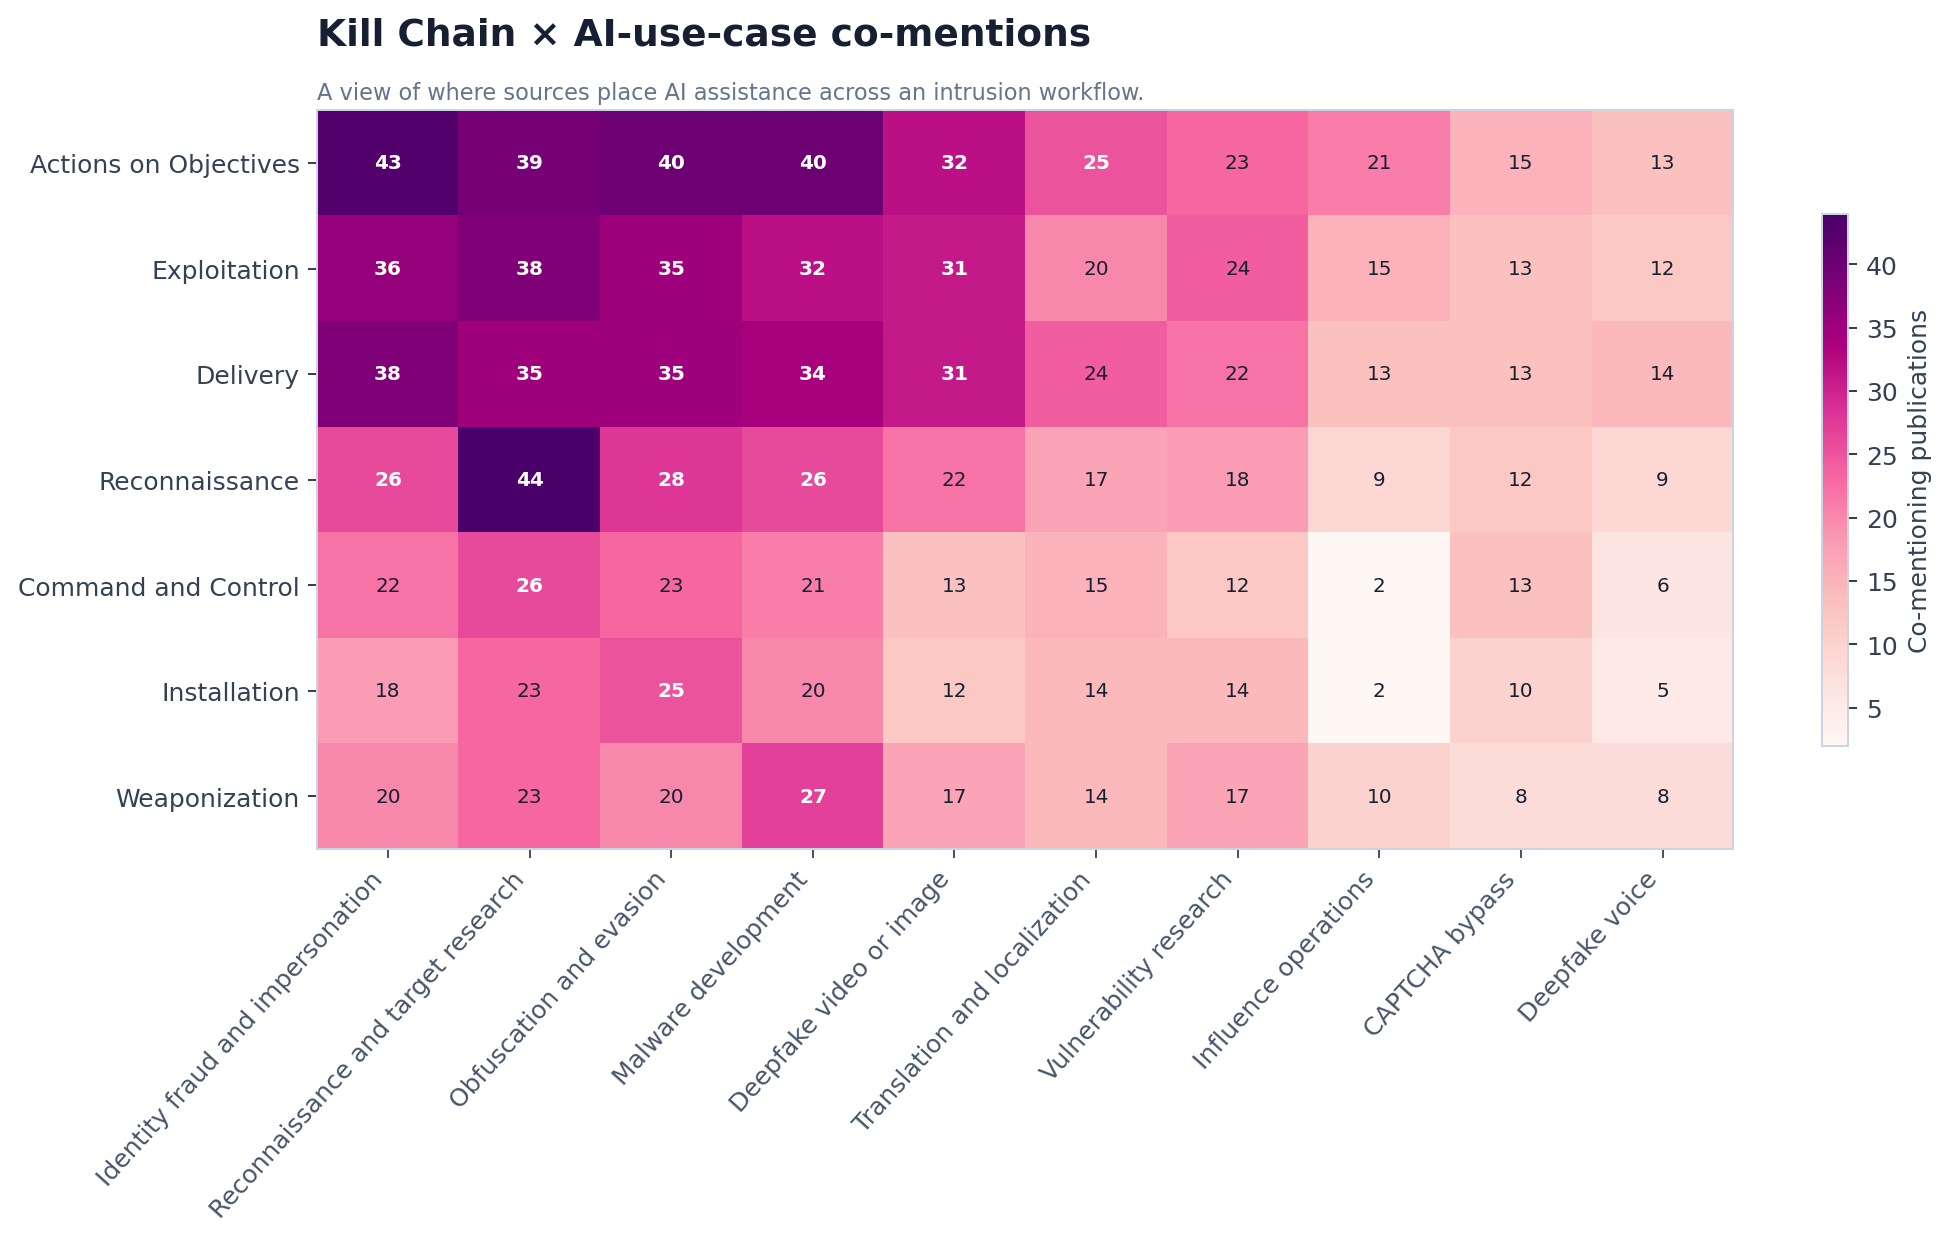
The cross-tab shows that the most common AI functions span multiple phases. Reconnaissance and identity content can support access preparation, while malware development and evasion can appear from weaponization through installation and objectives.
Provider × AI use case
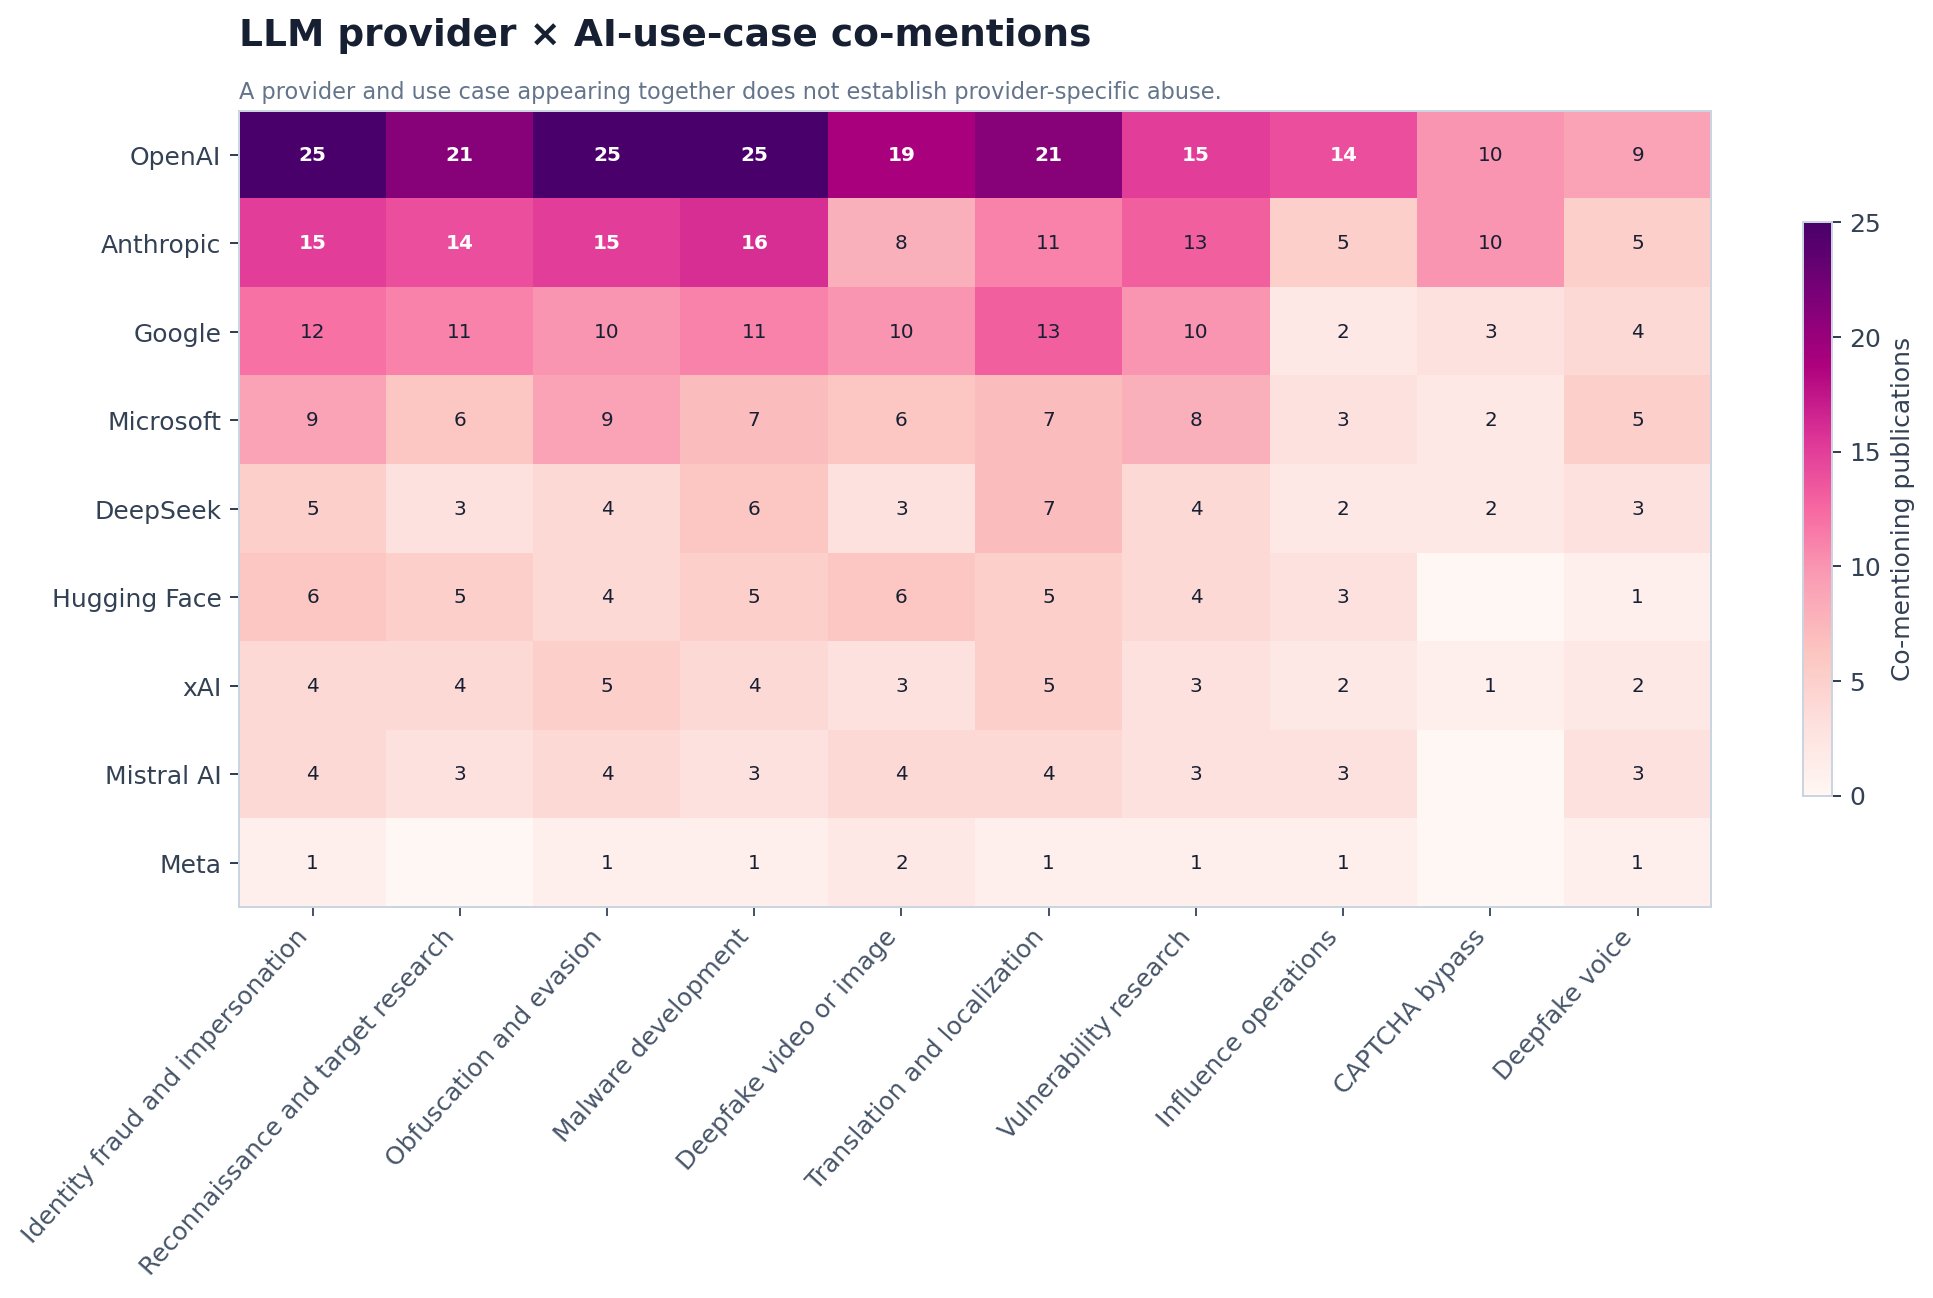
Provider/use-case co-mentions are especially sensitive to overinterpretation. Provider reports often describe abuse across many categories, which increases both row and column counts. Use the cells to locate evidence, never as a provider abuse-rate comparison.
Sector × geography
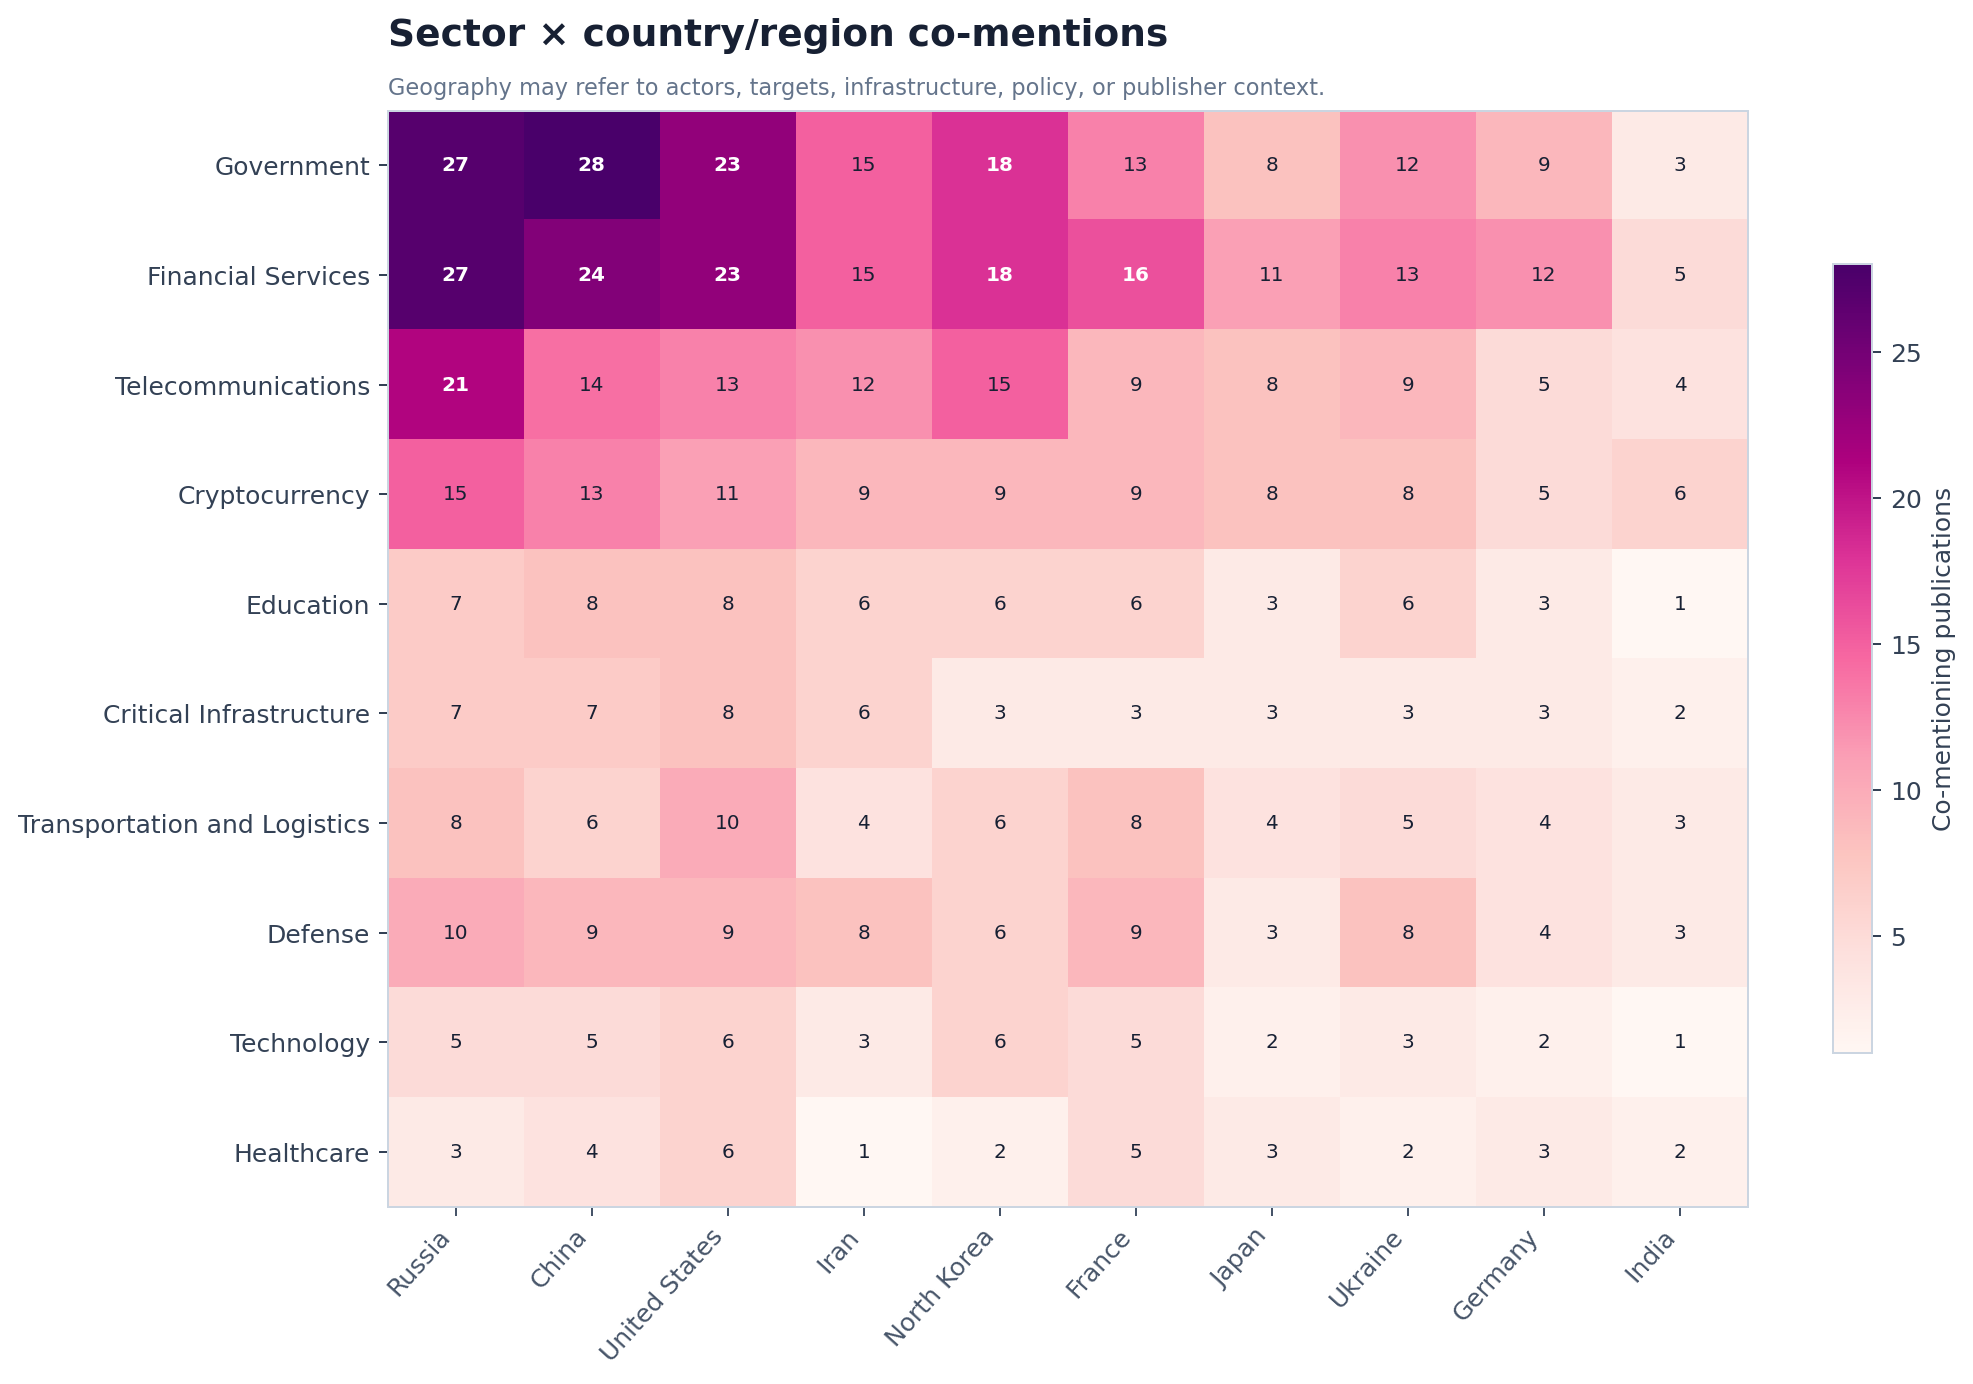
This view mixes multiple possible relations—actor origin, target geography, infrastructure, policy context, and publication scope. A follow-on incident dataset would need explicit relation types before geographic risk scoring.
What defenders should do with these findings
The corpus supports a practical defensive program, not an “AI attack” product category.
- Prioritize identity and social-engineering controls. Validate email authentication, high-risk sign-in detection, MFA reset procedures, executive impersonation response, help-desk verification, and vishing escalation.
- Keep browser and endpoint telemetry connected. Fake AI sites, generated scripts, malware delivery, browser abuse, and token theft cross those boundaries.
- Instrument code and vulnerability workflows. Monitor abnormal repository access, secret exposure, package publishing, CI/CD identity, exploit testing, and AI-assisted code use according to policy.
- Measure behaviors, not AI branding. Detections should target credential access, execution, persistence, exfiltration, evasion, C2, and fraud evidence. “Generated by AI” is often unobservable or irrelevant to containment.
- Create evidence-level provider-abuse records. Separate provider mention, confirmed account abuse, model-output evidence, API telemetry, and publisher inference.
- Preserve negative evidence. If a report forecasts a technique but provides no incident, telemetry, sample, or IOC, record that limitation.
- Build an incident-normalization layer before prevalence claims. Cluster publications into campaigns/incidents, assign relation types, record confidence, and select one canonical incident row before calculating attack shares.
Recommended analyst validation fields
| Field | Required question |
|---|---|
| Incident identity | Does this publication describe a unique event or repeat another source? |
| AI role | Was AI observed, source-reported, inferred, demonstrated, or forecast? |
| Actor | Is attribution explicit, current, and supported? |
| Provider/model | Was use confirmed, merely mentioned, or reported by the provider? |
| Behavior | What exact action occurred, and what telemetry supports it? |
| Outcome | Did the action succeed, fail, remain experimental, or remain unknown? |
| Victim/sector/country | What relation does the value have to the incident? |
| Metric | What is the denominator, unit, time window, and source methodology? |
| IOC | Is the observable exact, active, scoped, and safe to operationalize? |
Explore the connected research ecosystem
This study is the statistical layer of a broader evidence-to-action workflow on 1200km. Use the connected modules according to the question you are trying to answer:
- Inspect every source: search and correlate the 108-publication References library by actor, sector, use case, Kill Chain phase, ATT&CK candidate, provider, model, campaign, IOC, CVE, and evidence type.
- Explore every distribution: open the interactive statistical dashboard for 30+ widgets, five heatmaps, and a searchable 103-publication explorer.
- Apply CTI tradecraft: use the CTI analysis techniques, CTI-to-detection workflow, and OSINT evidence-preservation guidance.
- Defend the leading behaviors: connect identity findings to identity defense and ITDR, and translate validated behaviors with detection engineering and detection as code.
- Evaluate AI-specific risk: use the AI Security threat landscape, AI security analytics, and AI-assisted vulnerability research controls.
- Operationalize report evidence: follow the AdversaryGraph log-to-report investigation and the platform's third-party report validation, report-to-ATT&CK mapping, IOC enrichment, and detection-content generation guides.
- Validate detections safely: compare the statistical hypotheses with Operation Desert Hydra and the newest detection engineering techniques before treating any candidate as deployed coverage.
Limitations and reproducibility
Sampling limitations
- The corpus is purposive, not random, and cannot represent all attacks or all publications.
- English-language and publicly accessible reporting is overrepresented.
- Publisher concentration creates visibility bias.
- Transparency reports, vendor research, government advisories, incident-response reports, academic work, forecasts, and demonstrations have different evidence standards.
- The 2026 collection is partial, so year-over-year comparisons are not normalized.
Measurement limitations
- The publication is the unit of analysis; incidents and campaigns are not deduplicated across publishers.
- Multi-label tagging means category shares sum above 100%.
- Co-mention does not prove a relation, causality, attribution, exploitation, or provider use.
- Country, sector, actor, and target tags lack a universal relation type in this version.
- ATT&CK IDs and tactics are candidates until validated behaviorally.
- Metrics retain source context and must not be pooled without unit and denominator harmonization.
- IOC candidates can be stale, benign, malformed, shared infrastructure, or illustrative.
Reproduce the artifacts
This publication exposes the normalized dataset snapshot and chart inputs, but it intentionally does not republish the downloaded third-party HTML and PDF archive, copied evidence excerpts, or local archive paths. Source publishers retain rights in their original reports. The working research project regenerated the normalized data from that private evidence archive and then generated the article, dashboard, and visualizations. Dependency versions were not pinned in the original collection workflow, so exact byte-for-byte rebuilds require the preserved working environment; the public files support analytical reproduction of the reported counts and charts.
Primary analysis files:
- Publication table
- Source-linked normalized tags
- Unvalidated metric candidates
- IOC candidates
- Quality and review queue
- Tag dictionary
- SQLite database
- Excel workbook
- Interactive dashboard
Conclusion
The strongest conclusion from this corpus is not that AI has replaced established attacker tradecraft. It is that AI is repeatedly described as a flexible accelerator across identity abuse, reconnaissance, evasion, malware work, localization, vulnerability research, influence operations, and fraud. The literature spans the full intrusion lifecycle, but its evidence ranges from incident response and in-the-wild observation to forecasts, underground claims, and controlled demonstrations.
That distinction determines how the statistics should be used. Publication counts can show research attention, evidence concentration, and analytical gaps. They cannot produce global attack prevalence, provider market share, unique victim counts, or attribution certainty. The next research milestone is an analyst-reviewed incident layer that clusters repeated reporting, encodes relations, validates evidence, and separates observed operations from experiments and forecasts.
Until then, the dataset is most valuable as a reproducible CTI map: it tells defenders where to inspect, what evidence to demand, and which claims remain unproven.
References
Dataset and methodology
- Dataset documentation
- Source collection report
- Source uniqueness audit
- Machine-readable publication dataset
- Interactive statistical dashboard
- Searchable 108-publication References library
Selected primary research in the corpus
- Adversarial Misuse of Generative AI — Google Threat Intelligence Group / Mandiant
- Adversaries Leverage AI for Vulnerability Exploitation, Augmented Operations, and Initial Access — Google Threat Intelligence Group / Mandiant
- GTIG AI Threat Tracker: Distillation, Experimentation, and (Continued) Integration of AI for Adversarial Use — Google Threat Intelligence Group / Mandiant
- An update on disrupting deceptive uses of AI — OpenAI
- Disrupting malicious uses of AI: June 2025 — OpenAI
- Disrupting malicious uses of AI by state-affiliated threat actors — OpenAI
- What we learned mapping a year’s worth of AI-enabled cyber threats — Anthropic
- Detecting and countering malicious uses of Claude — Anthropic
- Detecting and countering misuse of AI: August 2025 — Anthropic
- Disrupting the first reported AI-orchestrated cyber espionage campaign — Anthropic
- Staying ahead of threat actors in the age of AI — Microsoft
- Facing reality? Law enforcement and the challenge of deepfakes | Europol — Europol
- Internet Crime Complaint Center (IC3) | Criminals Use Generative Artificial Intelligence to Facilitate Financial Fraud — FBI IC3
- INTERPOL report finds AI linked to more than half of cybercrime in Africa — INTERPOL
- 2025 Unit 42 Global Incident Response Report: Social Engineering Edition — Palo Alto Networks Unit 42
- CrowdStrike 2025 Threat Hunting Report: AI Becomes a Weapon and a Target — CrowdStrike
- 2024 Threat Analysis and 2025 Predictions │ Recorded Future Annual Threat Report — Recorded Future
- I Have No Mouth, and I Must Do Crime | Recorded Future — Recorded Future
- OPWNAI : Cybercriminals Starting to Use ChatGPT - Check Point Research — Check Point
- FunkSec – Alleged Top Ransomware Group Powered by AI - Check Point Research — Check Point
Follow My Work
I publish practical cybersecurity research, CTI workflows, detection engineering notes, malware-analysis projects, AI-security research, open-source tools, labs, and technical guides.