Assembly for Malware Analysis: A Practical x86/x64 Guide
- Category: Malware Analysis
- Topics: Assembly Language, x86, x64, Reverse Engineering, Static Analysis, Dynamic Analysis, Windows Internals, AIDebug
- Source article: Medium publication
- Published: 2026-08-09
- Preserved media: 27 image(s), including the cover, AIDebug screenshots, instruction references, ABI diagrams, code-structure examples, and analyst workflow infographics.
- Preserved technical blocks: 44 code/configuration block(s).
Ecosystem Fit
This practical guide connects the Malware Analysis knowledge base, Short Guides library, course helping materials, and hands-on lab collection. Use Strings Analysis for Malware Analysis to select high-value values before following their code references, and pair both guides with the safe FLARE-VM and REMnux lab guide before moving from static inspection to active debugging.
This independent article may be used as supplementary material for TrainSec's Malware Analyst Professional – Level 1. It is not part of the official course. See my complete course review.
Use the AIDebug 3.1 full release review as the platform map that joins these assembly exercises to deterministic triage, control flow, PE data, strings, Ghidra, AI review, and reports.
Assembly language can look like an endless wall of short instructions, unfamiliar registers, and hexadecimal addresses. For a malware analyst, however, the goal is not to memorize every instruction in the processor manual. The goal is to recover meaning:
- What data enters a function?
- Which conditions control its behavior?
- What memory does it read or modify?
- Which operating-system functions does it call?
- What observable behavior does the complete sequence produce?
This guide builds that practical reading skill. It focuses on x86 and x64 code, uses Intel syntax, and treats 64-bit Windows as the primary environment because it is common in malware-analysis labs. Linux System V and 32-bit Windows differences are called out where they matter.
Scope and safety: Use these techniques only on software and systems you are authorized to examine. The examples are designed for defensive analysis, education, and incident response. Potentially harmful behaviors are described at the recognition level, not as deployment instructions.
Table of contents
- What assembly really represents
- Using AIDebug as the practical lab companion
- The registers an analyst uses most
- Memory, addresses, and operand sizes
- Flags, comparisons, and branches
- The stack and calling conventions
- The instruction families that matter most
- Recovering high-level code structures
- Recognizing Windows API behavior
- Imports, the TEB, and the PEB
- A worked analysis example
- A repeatable malware-analysis workflow
- Common interpretation mistakes
- Analyst checklist
- Key takeaways
- References
1. What assembly really represents
A processor executes machine-code bytes. A disassembler translates those bytes into assembly mnemonics such as mov, cmp, call, and jmp. Those mnemonics are a readable representation of the instructions—not the original source code.
Compilation removes or transforms much of the information that made the source easy to understand:
- variable and function names may disappear;
- types are often only implied by operand width and usage;
- loops and conditions become jumps;
- structures become base addresses plus offsets;
- compiler optimizations may merge, reorder, or eliminate operations;
- statically linked library code may look like application logic;
- packed code may not exist in its final form until runtime.
That is why reverse engineering is an inference process. A decompiler helps, but it does not restore the exact source. The analyst builds and tests a model from several forms of evidence: instructions, data flow, memory layout, API calls, strings, runtime observations, and file structure.
Intel syntax at a glance
In the Intel syntax used by many Windows-oriented tools, the destination operand usually appears first:
mov eax, 5          ; EAX = 5
mov eax, ebx        ; EAX = EBX
add eax, ecx        ; EAX = EAX + ECX
An operand can be:
- a register:
rax,ecx,al; - an immediate value:
5,0x40; - a memory operand:
[rbp-0x20],[rcx+8]; - an address calculated with
lea.
Comments in this guide begin with ;. They are explanations added by the analyst and are not part of the machine instruction.
2. Using AIDebug as the practical lab companion
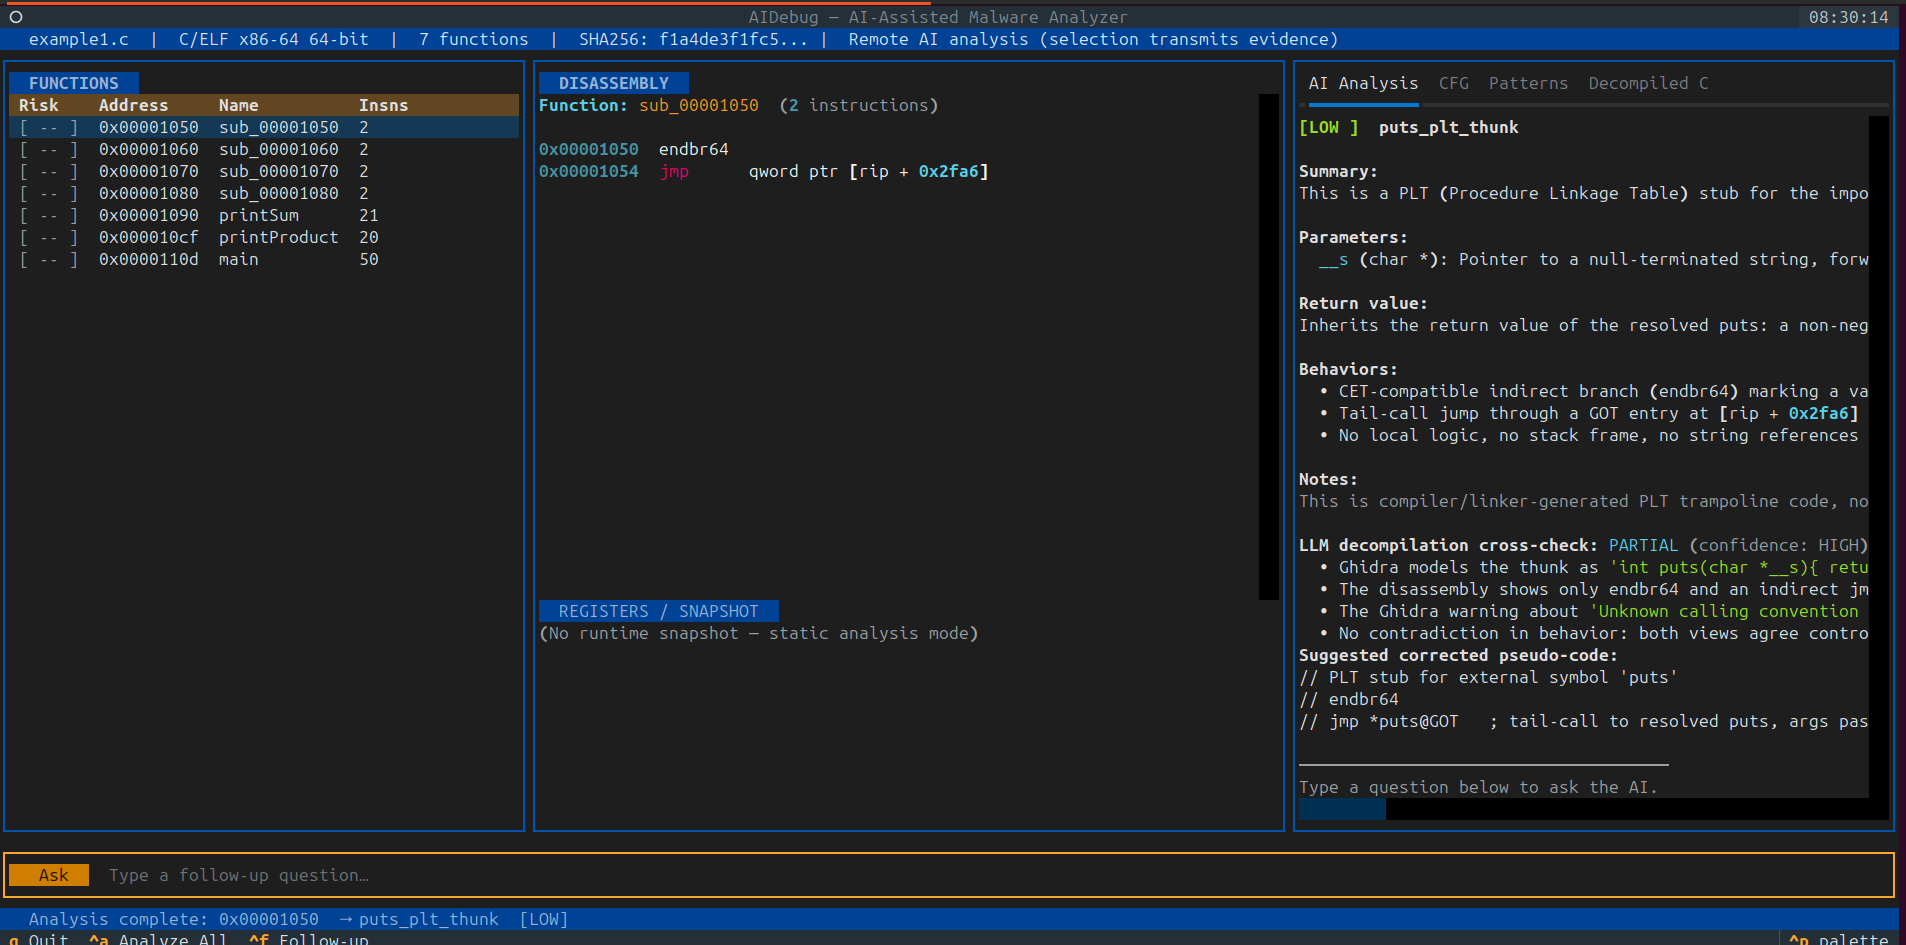
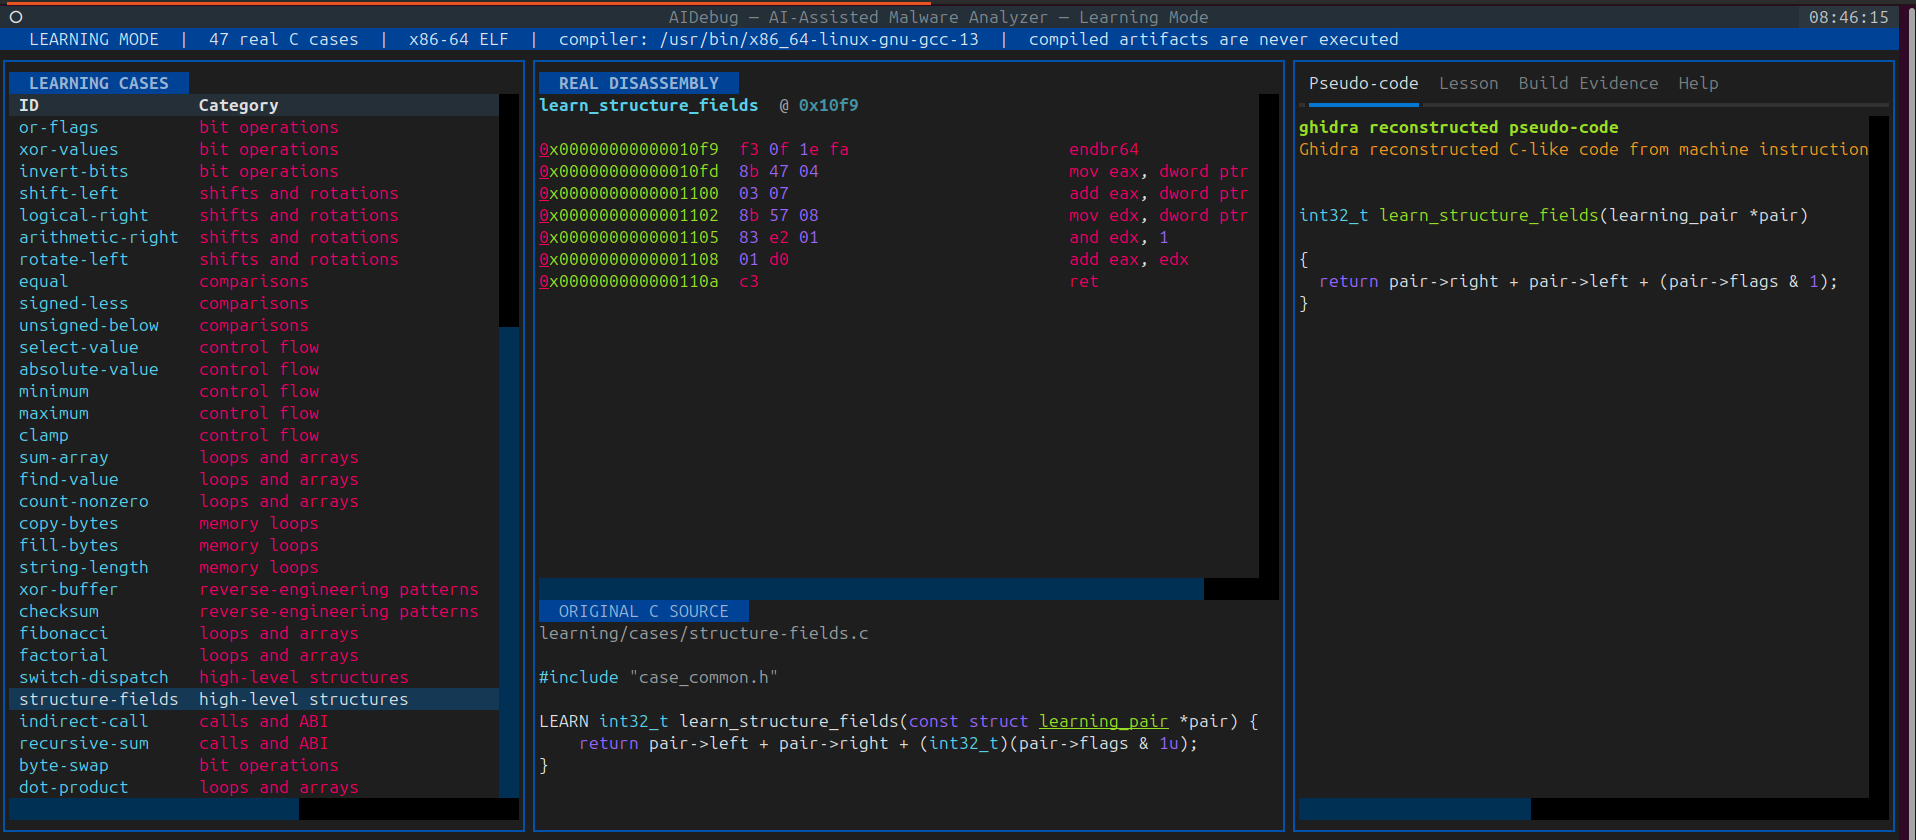
AIDebug is the companion tool used in this guide to turn small C examples into evidence you can inspect. Its Learning Mode does not display handwritten or simulated assembly. For each selected lesson, it compiles one real C function into a temporary x86-64 ELF artifact, disassembles the compiler-generated function, asks Ghidra to reconstruct pseudo-code, and presents all three views in the main full-screen interface. The temporary lesson artifact is analyzed but never executed.
Treat AIDebug as an evidence organizer, not an oracle. The original C teaches the intended operation, the assembly shows what the local compiler actually emitted, and the pseudo-code shows what a decompiler can infer after source information has been removed. Differences between those views are part of the lesson.
For a broader tool walkthrough, see AI-Powered Malware Debugger That Explains Every Function It Sees. The repository README remains the authoritative source for the current command set and Learning Mode catalog.
Install and deploy AIDebug
Use a dedicated Linux analysis VM with Python 3.10 or newer. Clone the current source, create an isolated environment, and install the command-line tool:
git clone https://github.com/anpa1200/AIDebug.git
cd AIDebug
python3 -m venv .venv
source .venv/bin/activate
python -m pip install --upgrade pip
python -m pip install -e .
aidebug --version
The editable installation is convenient for following the guide. After an upstream update, synchronize the checkout and refresh dependencies with:
git pull --ff-only
python -m pip install -e .
Each new shell must activate the environment again with
source .venv/bin/activate.
Learning Mode also requires:
- an x86-64 ELF-capable
cc,gcc, orclang; - Ghidra and its
analyzeHeadlesslauncher; and - a terminal supported by Textual.
AIDebug searches common Ghidra locations. If discovery fails, provide the launcher explicitly or set its environment variable:
export AIDEBUG_GHIDRA_HEADLESS=/opt/ghidra/support/analyzeHeadless
aidebug --learn
The exact Ghidra directory can differ on your VM. GDB is additionally required
for active debugging, while Bubblewrap is required only when analyzing an
arbitrary C file with --source.
Use Learning Mode with this guide
Launch the complete catalog in AIDebug's main GUI:
aidebug --learn
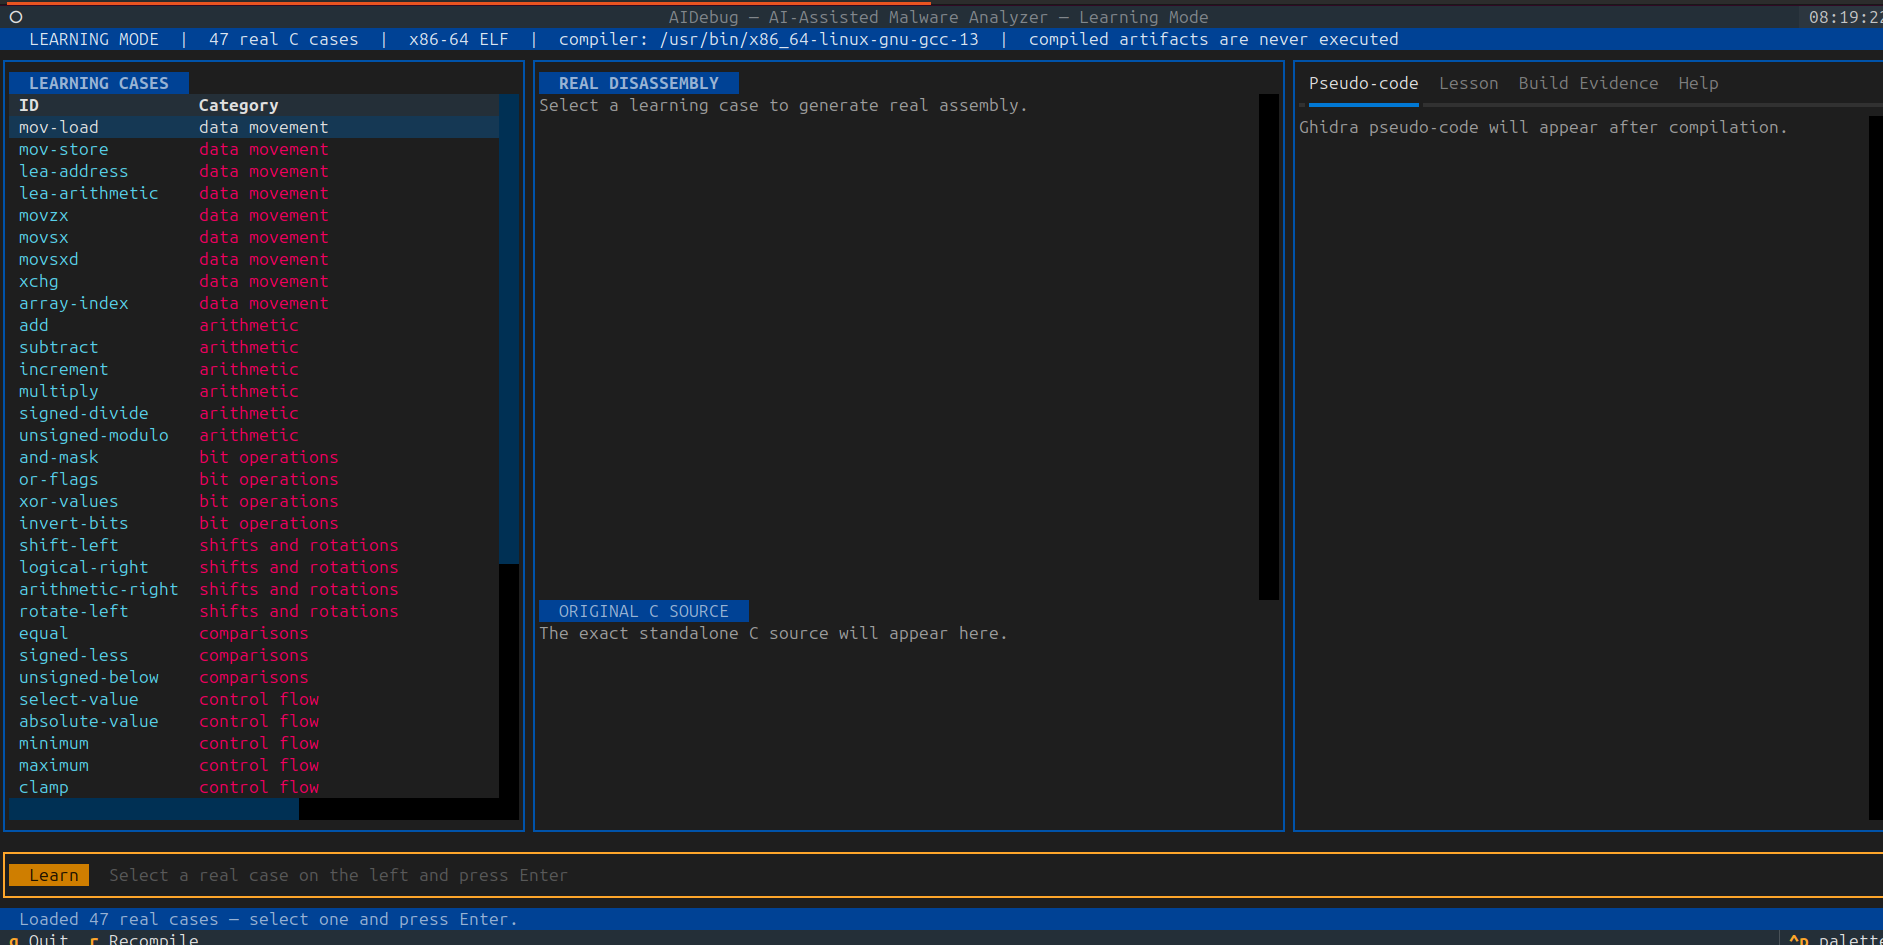
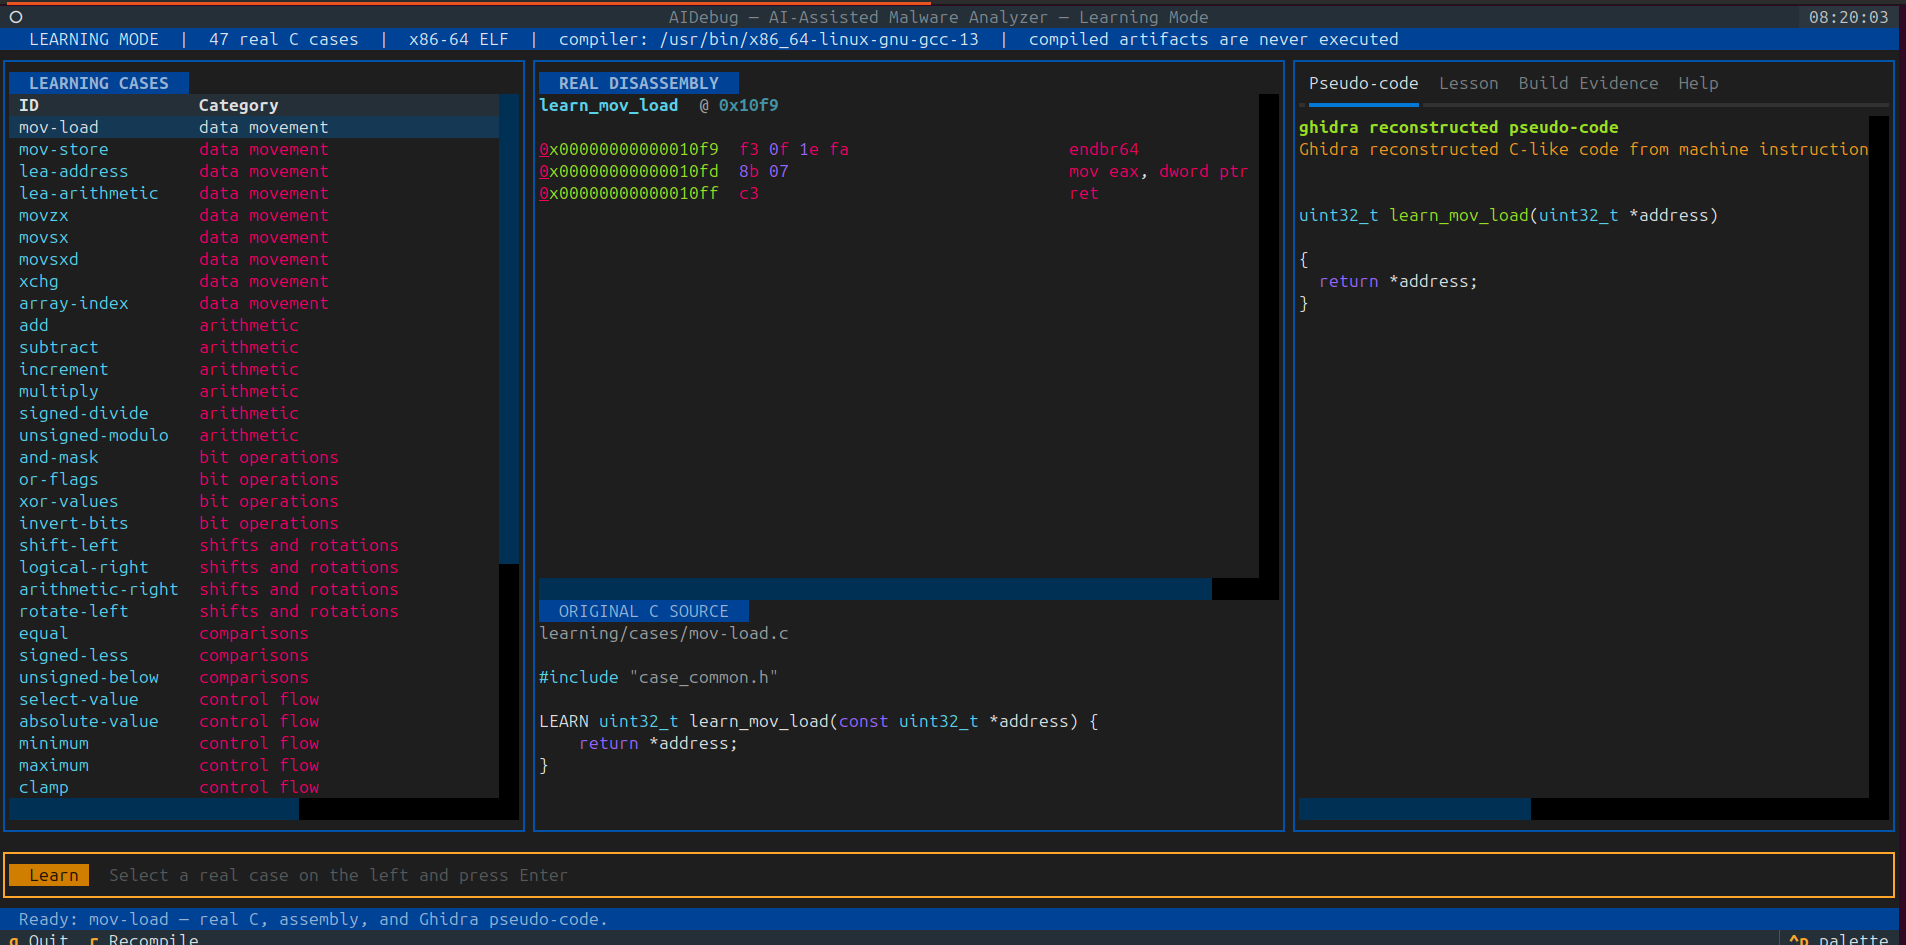
The left pane lists 47 standalone cases. Select a case and press Enter. The
center panes show the real instruction addresses and bytes plus the exact C
source. The right-side tabs show Ghidra pseudo-code, lesson notes, compiler and
artifact evidence, and help. Press R to rebuild the selected case and Q to
quit.
Use these lesson groups as you progress:
| Guide topic | AIDebug cases |
|---|---|
| Loads, stores, and address calculation | mov-load, mov-store, lea-address, lea-arithmetic |
| Width and extension | movzx, movsx, movsxd |
| Arithmetic and bits | add, subtract, and-mask, xor-values, shift-left, rotate-left |
| Signed and unsigned decisions | equal, signed-less, unsigned-below |
| Loops and buffers | sum-array, find-value, copy-bytes, xor-buffer, checksum |
| Recovered structures and calls | switch-dispatch, structure-fields, indirect-call, recursive-sum |
Open one exact case directly while retaining the complete catalog in the GUI:
aidebug --learn mov-load
aidebug --learn signed-less
aidebug --learn xor-buffer
For a noninteractive terminal view, add --no-tui:
aidebug --learn movsxd --no-tui
ABI warning: The bundled learning cases are Linux x86-64 ELF files and therefore use the System V AMD64 calling convention. This guide primarily analyzes Windows x64, whose argument registers differ. Use Learning Mode to study real instructions and data flow, then apply the calling convention for the binary actually under examination.
Analyze your own safe examples
The same interface can statically inspect a PE or ELF file and include Ghidra reconstruction:
aidebug --binary /path/to/example.exe --offline --decompile
aidebug --binary /path/to/example.elf --offline --decompile
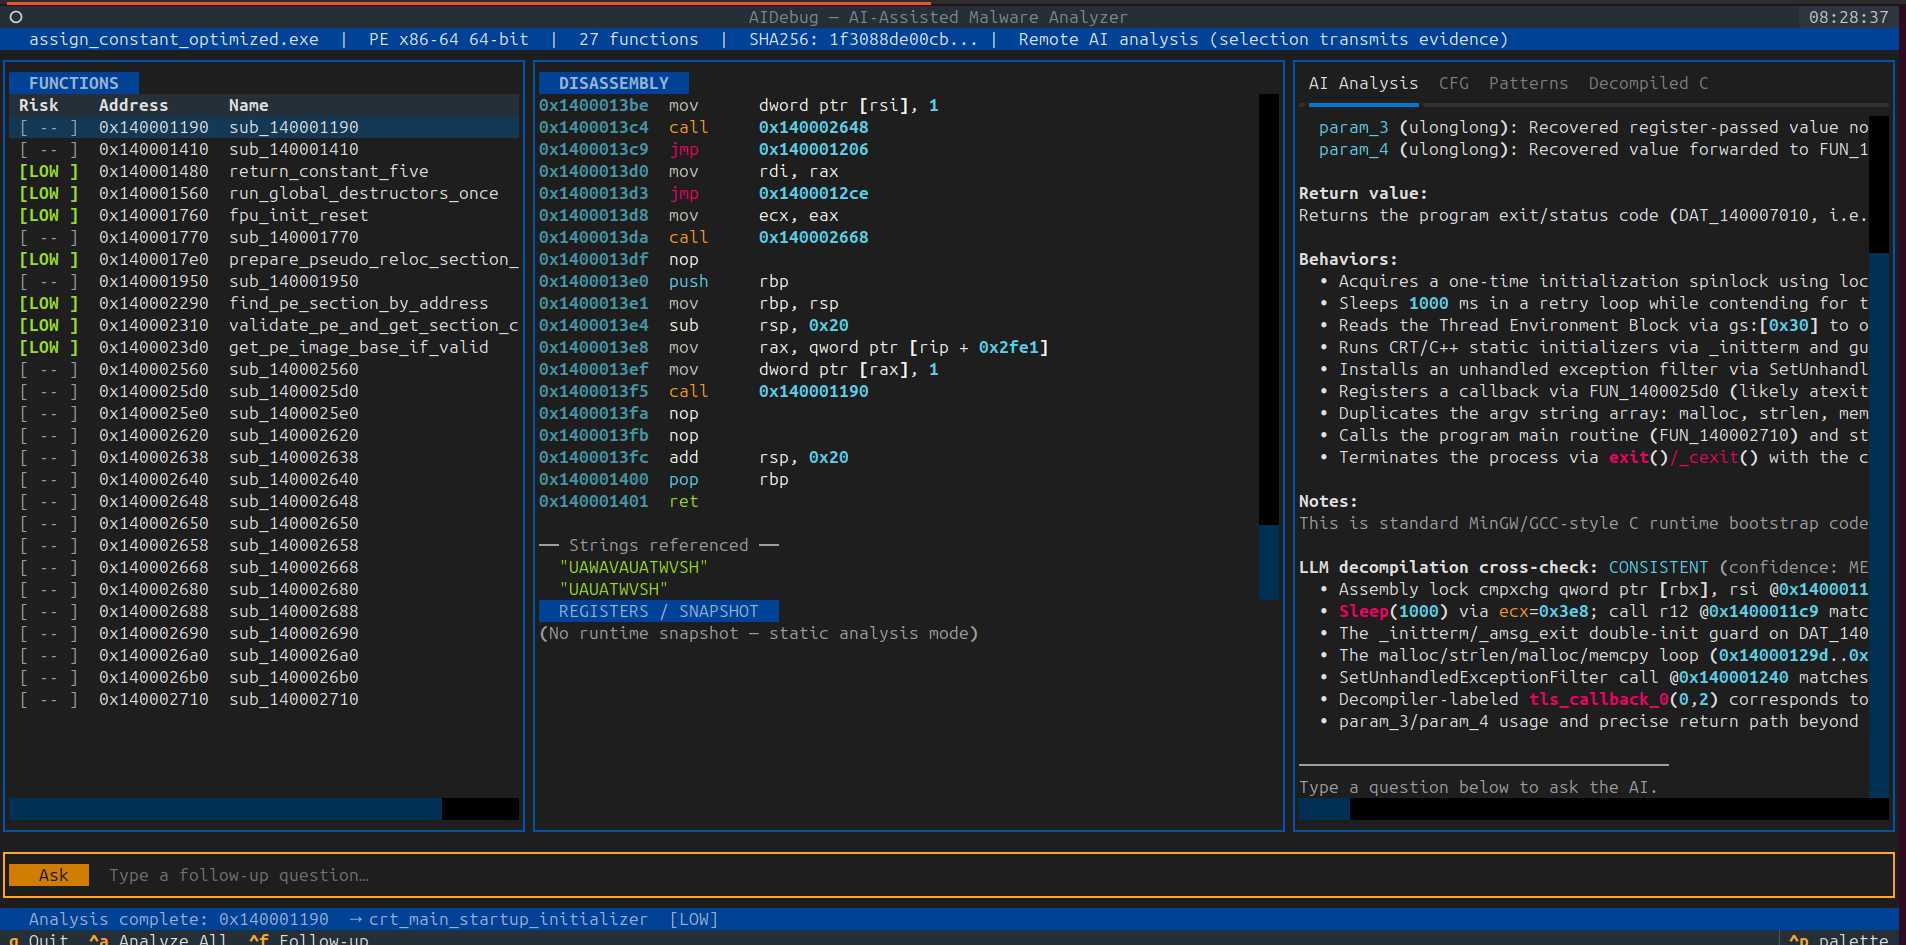
You can also compile and inspect one C translation unit without executing the result. This workflow requires Bubblewrap:
aidebug --source /path/to/example.c --offline --decompile
Active debugging is available for a local ELF laboratory target:
aidebug --binary ./trusted-demo.elf --mode debug --breakpoint main
Active mode executes the selected ELF through GDB. Use it only for your own benign examples or inside a properly isolated, authorized malware-analysis VM. For unknown samples, begin with offline static analysis and move to dynamic work only when the lab boundary is ready.
3. The registers an analyst uses most
Registers are small storage locations inside the processor. They hold values, pointers, counters, arguments, return values, and intermediate results.
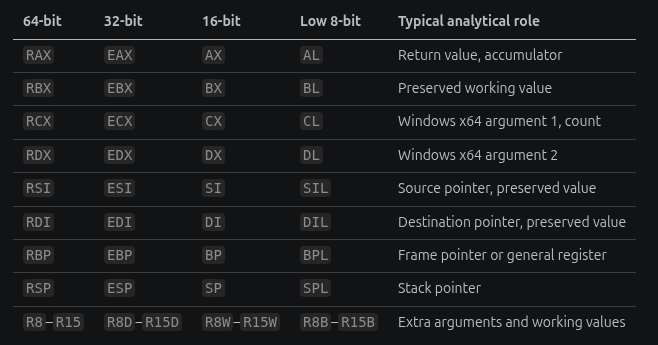
The same physical general-purpose register has aliases for different widths:
| 64-bit | 32-bit | 16-bit | Low 8-bit | Typical analytical role |
|---|---|---|---|---|
RAX | EAX | AX | AL | Return value, accumulator |
RBX | EBX | BX | BL | Preserved working value |
RCX | ECX | CX | CL | Windows x64 argument 1, count |
RDX | EDX | DX | DL | Windows x64 argument 2 |
RSI | ESI | SI | SIL | Source pointer, preserved value |
RDI | EDI | DI | DIL | Destination pointer, preserved value |
RBP | EBP | BP | BPL | Frame pointer or general register |
RSP | ESP | SP | SPL | Stack pointer |
R8–R15 | R8D–R15D | R8W–R15W | R8B–R15B | Extra arguments and working values |
Two rules are especially important:
- Writing a 32-bit register in 64-bit mode clears the upper 32 bits of its 64-bit parent.
- Writing an 8-bit or 16-bit alias does not clear the remaining bits.
mov rax, 0xffffffffffffffff
mov eax, 1                  ; RAX becomes 0x0000000000000001

mov rax, 0xffffffffffffffff
mov al, 1                   ; RAX becomes 0xffffffffffffff01
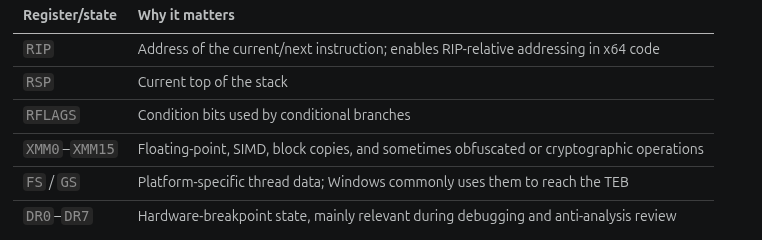
Special registers and state
| Register/state | Why it matters |
|---|---|
RIP | Address of the current/next instruction; enables RIP-relative addressing in x64 code |
RSP | Current top of the stack |
RFLAGS | Condition bits used by conditional branches |
XMM0–XMM15 | Floating-point, SIMD, block copies, and sometimes obfuscated or cryptographic operations |
FS / GS | Platform-specific thread data; Windows commonly uses them to reach the TEB |
DR0–DR7 | Hardware-breakpoint state, mainly relevant during debugging and anti-analysis review |
Control registers, descriptor registers, AVX registers, and other architectural state matter in kernel, virtualization, or specialized samples. For ordinary user-mode triage, start with general-purpose registers, RIP, RSP, RFLAGS, and the argument registers. ARM and ARM64 malware require a different register model and instruction set and are outside this x86/x64-focused guide.
4. Memory, addresses, and operand sizes
Square brackets mean “access memory at this address”:
mov eax, ecx          ; copy the value in ECX
mov eax, [rcx]        ; read 4 bytes from memory at address RCX
mov [rcx], eax        ; write 4 bytes to memory at address RCX
lea rax, [rcx+8]      ; calculate RCX + 8; do not dereference it
Confusing an address with the data stored at that address is one of the fastest ways to misunderstand a function.
Operand sizes
Disassemblers may make the access width explicit:
| Syntax | Bytes accessed | Common interpretation |
|---|---|---|
byte ptr [rax] | 1 | Character, byte, Boolean, flag |
word ptr [rax] | 2 | UTF-16 code unit, 16-bit integer |
dword ptr [rax] | 4 | 32-bit integer, status code |
qword ptr [rax] | 8 | 64-bit integer or pointer |
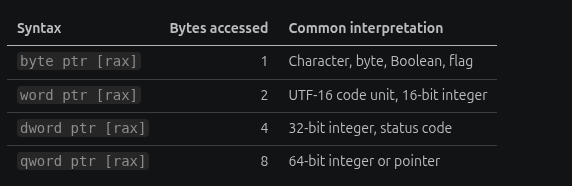
The width is evidence about a possible type, not proof of the original declaration.
Effective addresses
x86/x64 memory operands commonly follow this form:
base + index × scale + displacement
For example:
mov eax, [rbx+rcx*4+0x10]
This reads four bytes from RBX + RCX*4 + 0x10. Depending on context, that might be an array element, a structure field followed by an array, or a compiler-generated table access.
Typical patterns include:
mov eax, [rbp-0x20]       ; local variable
mov rax, [rsp+0x38]       ; stack argument or saved value
mov edx, [rcx+0x14]       ; 32-bit field in an object/structure
mov rax, [rip+0x2f10]     ; global data or imported pointer
Little-endian storage
x86 and x64 store multi-byte integers least-significant byte first. The value 0x12345678 appears in memory as:
78 56 34 12
Endianness matters when reconstructing integers, addresses, magic values, protocol fields, and strings from raw memory or file bytes.
5. Flags, comparisons, and branches
Arithmetic and logical instructions update bits in RFLAGS. Conditional jumps read those bits.
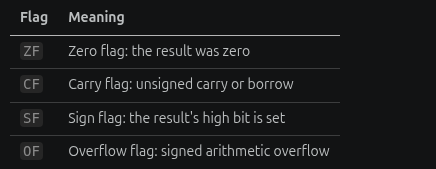
The flags analysts use most often are:
| Flag | Meaning |
|---|---|
ZF | Zero flag: the result was zero |
CF | Carry flag: unsigned carry or borrow |
SF | Sign flag: the result's high bit is set |
OF | Overflow flag: signed arithmetic overflow |
cmp a, b behaves like a subtraction a - b that updates flags but discards the numeric result:
cmp eax, 10
je  equal_case       ; EAX == 10
jne different_case   ; EAX != 10
test performs a bitwise AND for flag purposes without storing the result:
test rax, rax
jz   null_pointer    ; RAX == 0

test eax, 4
jnz  flag_is_set     ; bit 2 is set
Signed and unsigned comparisons
The same bits can represent either a signed or an unsigned value. The branch mnemonic reveals how the code interprets them:
| Relationship | Signed jump | Unsigned jump |
|---|---|---|
| Greater than | jg | ja |
| Greater than or equal | jge | jae |
| Less than | jl | jb |
| Less than or equal | jle | jbe |
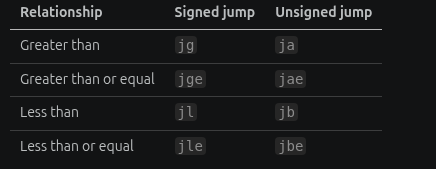
This difference matters for file sizes, buffer lengths, counters, error codes, and boundary checks. Do not translate every ja into a signed > comparison.
AIDebug exercise: Compare
signed-lessandunsigned-below. The C source states the intended types, while the emitted conditional instruction shows which interpretation survived into machine code.
6. The stack and calling conventions
The stack stores return addresses, saved registers, local variables, spilled values, and arguments that do not fit in registers. On x86/x64, it grows toward lower addresses.
push rbx              ; RSP decreases; RBX is saved
sub  rsp, 0x30        ; reserve local stack space
...
add  rsp, 0x30        ; release local stack space
pop  rbx               ; restore RBX
ret                    ; return to the saved address
The exact meaning of registers at a function call depends on the calling convention, also called an application binary interface or ABI.
Windows x64
For ordinary integer and pointer arguments:
| Argument | Register |
|---|---|
| 1 | RCX |
| 2 | RDX |
| 3 | R8 |
| 4 | R9 |
| 5 and later | Stack |

Return values commonly use RAX. Floating-point arguments use corresponding XMM registers. The caller reserves 32 bytes of shadow space for the callee, even when the callee does not use it. Outside prologue and epilogue regions, RSP must remain 16-byte aligned; in practical call-site analysis, verify that the caller's stack adjustments leave RSP 16-byte aligned immediately before call.
mov  rcx, rbx             ; argument 1: base address
mov  edx, 0x1000          ; argument 2: region size
mov  r8d, 0x20            ; argument 3: new protection
lea  r9, [rsp+0x30]       ; argument 4: receives old protection
call qword ptr [rip+__imp_VirtualProtect]
test eax, eax             ; inspect returned BOOL
Windows x64 treats RAX, RCX, RDX, R8–R11, and several vector registers as volatile across calls. RBX, RBP, RDI, RSI, RSP, and R12–R15 are nonvolatile and must be preserved by a callee that changes them.
System V AMD64
Most 64-bit Linux and other Unix-like environments use a different order:
| Argument | Register |
|---|---|
| 1 | RDI |
| 2 | RSI |
| 3 | RDX |
| 4 | RCX |
| 5 | R8 |
| 6 | R9 |

The return value commonly uses RAX. Do not apply this register order to Windows binaries.
Common 32-bit x86 conventions
In 32-bit code, arguments are often stack-based:
cdecl: arguments are usually pushed right to left; the caller cleans the stack.stdcall: arguments are usually pushed right to left; the callee cleans the stack.- Microsoft
fastcall: the first two suitable arguments commonly useECXandEDX. thiscall: a C++ object pointer commonly arrives inECXunder Microsoft conventions.
Compilers, optimized code, variadic functions, hand-written assembly, and nonstandard interfaces create exceptions. Identify the binary's architecture and platform before labeling arguments.
7. The instruction families that matter most
You do not need the entire instruction set on day one. Learn instructions by analytical purpose.
Data movement and address calculation
mov   eax, [rcx]       ; load
mov   [rdx], eax       ; store
lea   rax, [rcx+rdx*4] ; calculate an address or arithmetic expression
movzx eax, byte ptr [rcx] ; zero-extend a byte
movsx eax, byte ptr [rcx] ; sign-extend a byte
movsxd rax, dword ptr [rcx] ; sign-extend a 32-bit value to 64 bits
xchg  eax, ebx         ; exchange values
lea is not simply “load a pointer.” Compilers also use it for arithmetic because it can calculate expressions such as x*4 + x without changing flags.
AIDebug exercise: Open
aidebug --learn "data movement"and comparemov-loadwithlea-address. In the first case, find the memory dereference in the real assembly. In the second, confirm thatleacalculates a value without reading from the calculated address. Then compare both functions with Ghidra's reconstruction.




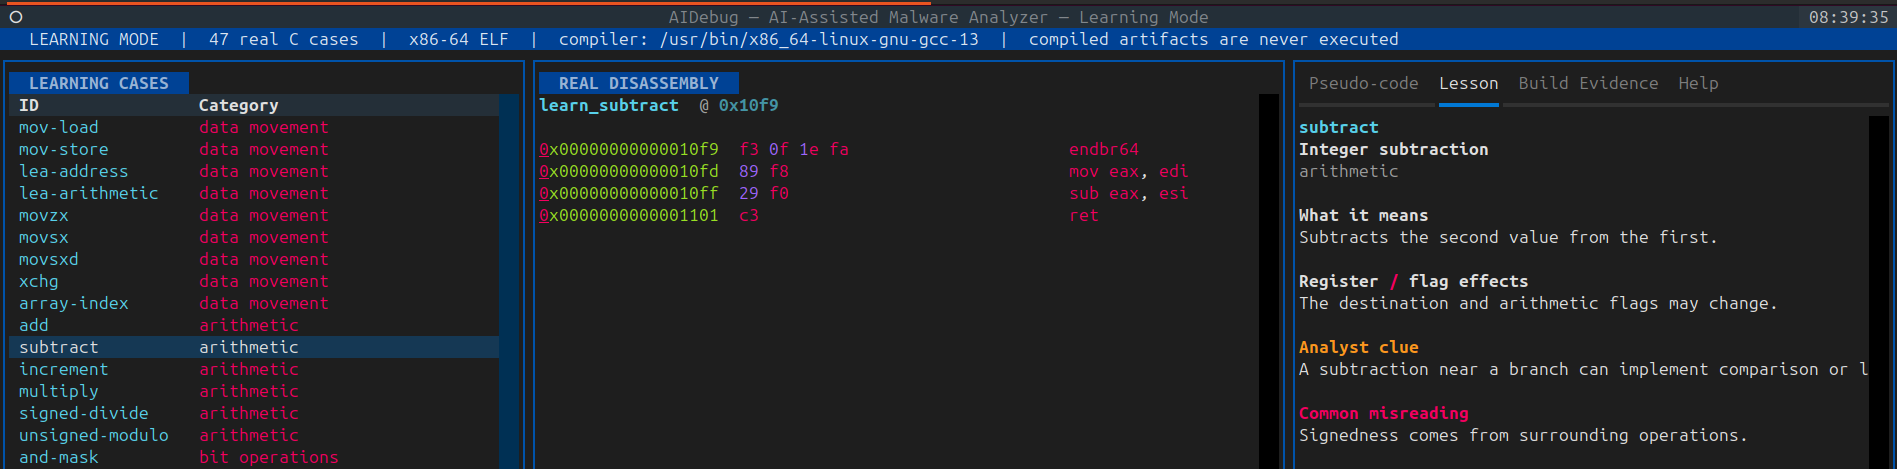
Arithmetic and bit operations
add eax, 4
sub ecx, 1
inc edx
imul eax, ecx, 10
xor eax, eax           ; common zeroing idiom
and eax, 0xff
or  eax, 1
not eax

Repeated xor, rol, ror, shifts, masks, and additions over a buffer may indicate encoding, hashing, checksum logic, cryptography, or ordinary serialization. Context—not the instruction alone—determines the behavior.
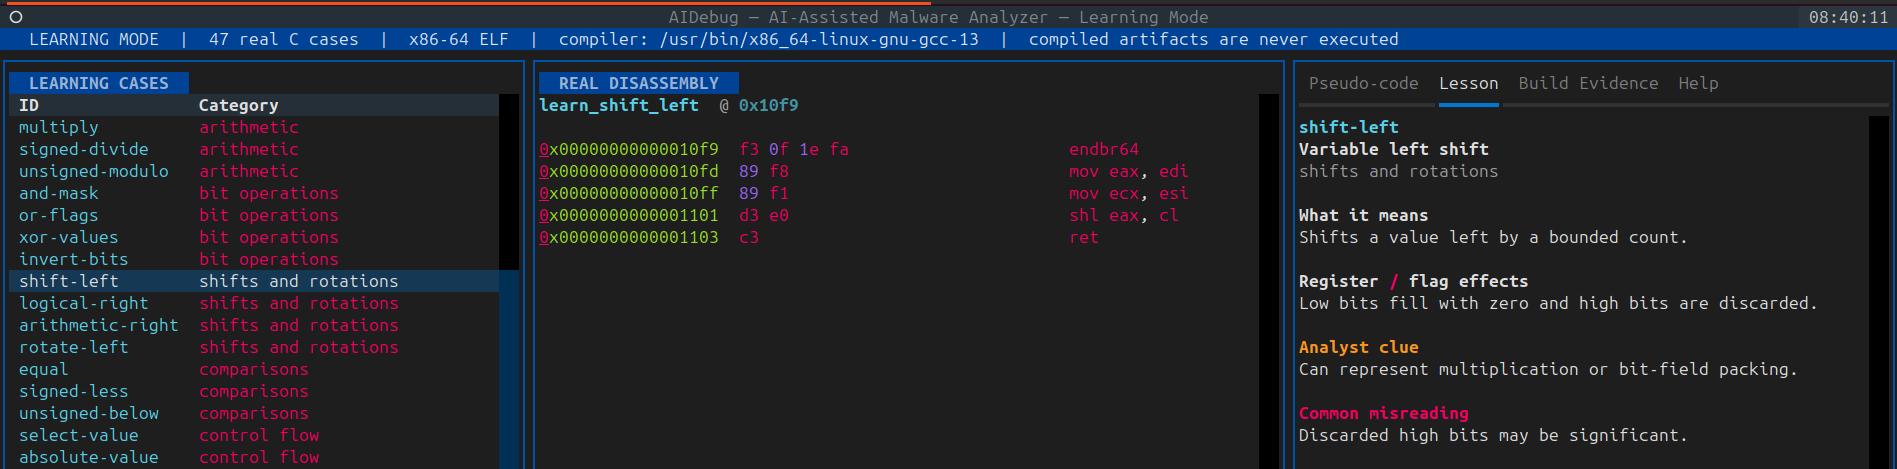
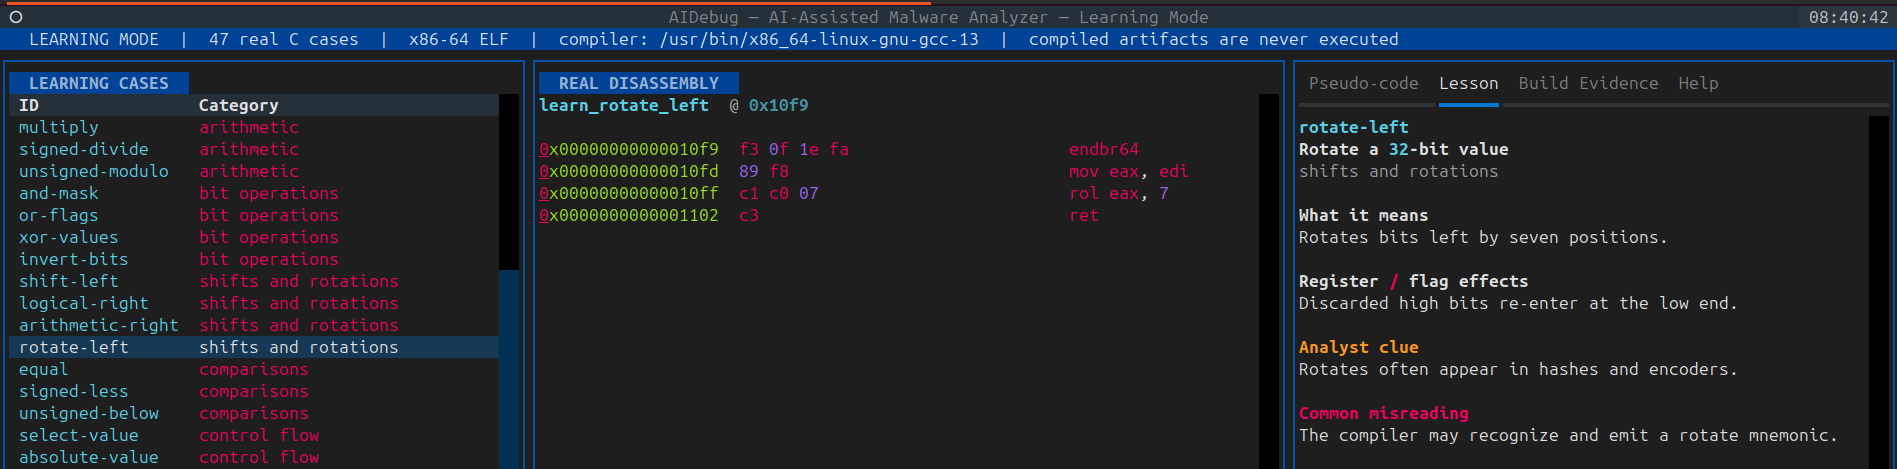
Shifts and rotations
shl eax, 3             ; logical shift left
shr eax, 1             ; logical shift right
sar eax, 1             ; arithmetic right shift; preserves sign
rol eax, 7
ror eax, 13
Control transfer
call target
ret
jmp target
je  target
jne target
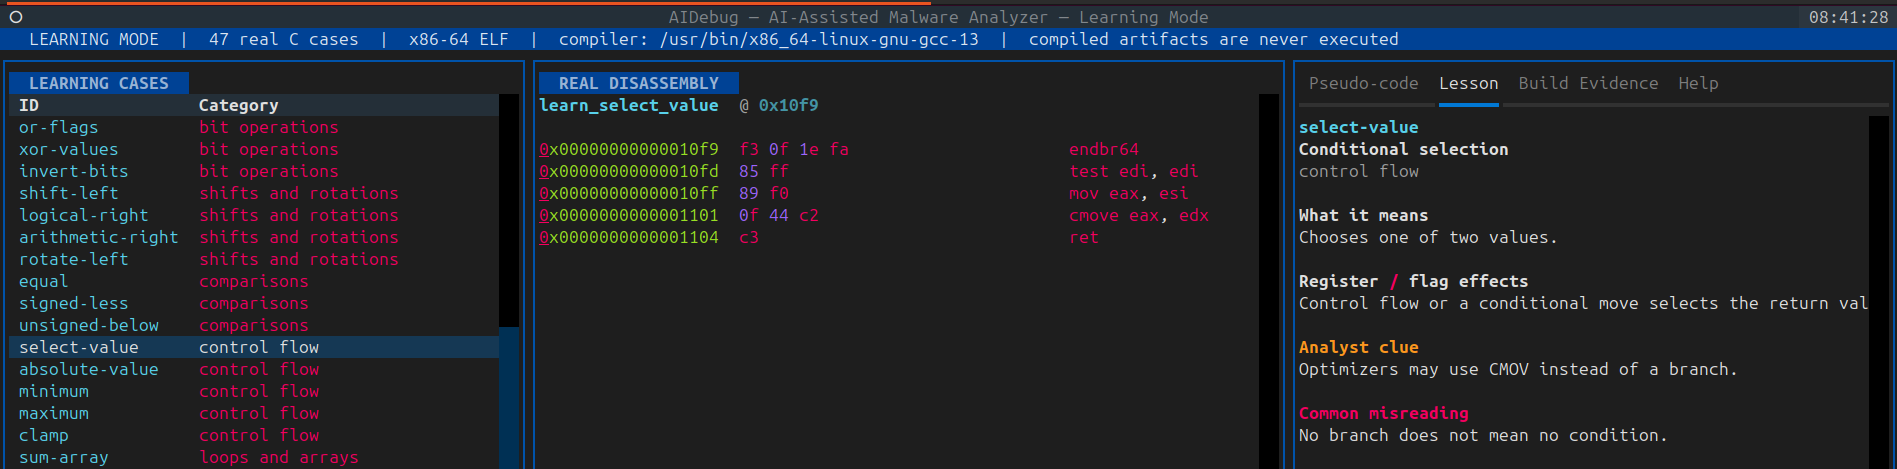
cmovz eax, edx         ; conditional move without a branch
An indirect call deserves attention because its target comes from a register or memory location:
call rax
call qword ptr [rip+0x2410]
It may be a normal import, a virtual method, a callback, a dynamically resolved API, or a transfer into newly prepared code. Trace where the target value came from.
String and block operations
rep movsb               ; copy RCX bytes from source to destination
rep stosb               ; fill memory with AL
scasb                   ; scan/compare a byte
These can represent optimized memcpy, memset, string operations, or buffer manipulation.
System and debugging instructions
syscall                 ; enter the operating system on x64
int 3                   ; breakpoint exception
rdtsc                   ; read timestamp counter
cpuid                   ; query processor information
nop                     ; no operation / alignment / padding
These instructions have legitimate uses. In suspicious code, timing reads, breakpoint instructions, and environment queries may contribute to anti-analysis logic, but a conclusion requires surrounding evidence.
8. Recovering high-level code structures
if and if-else
if (value == 7)
    result = 1;
else
    result = 0;
One possible assembly form is:
cmp  ecx, 7
jne  not_equal
mov  eax, 1
jmp  done

not_equal:
xor  eax, eax

done:
ret
Optimized code may instead use sete al, cmov, or arithmetic that avoids branches.
Loops
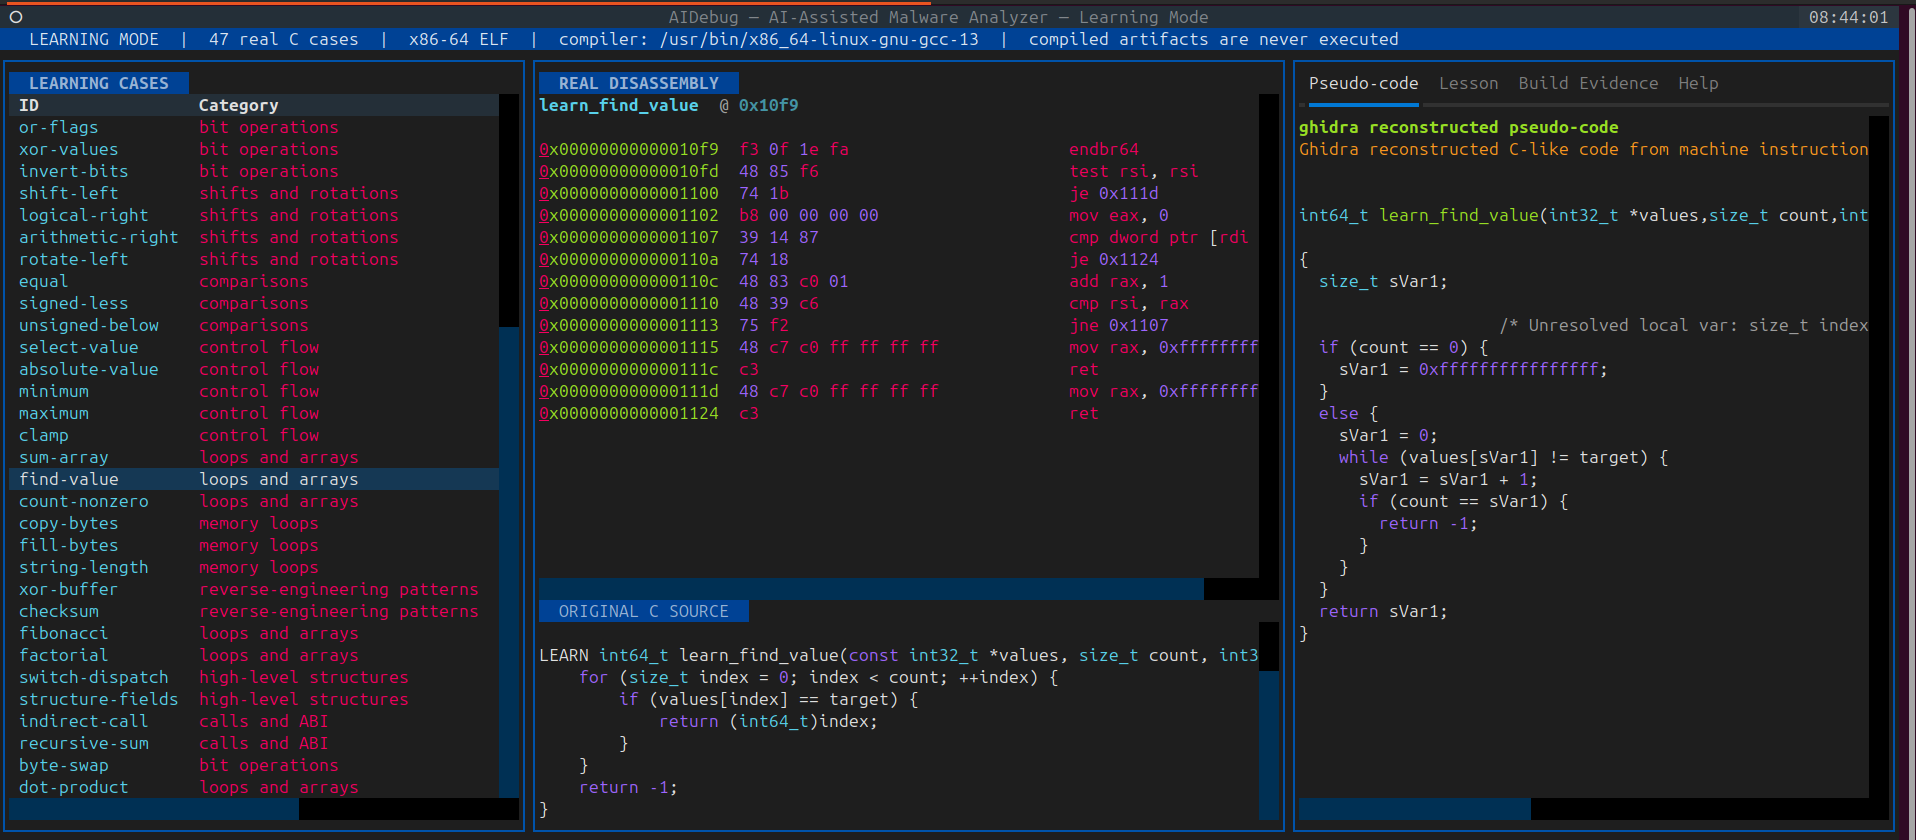
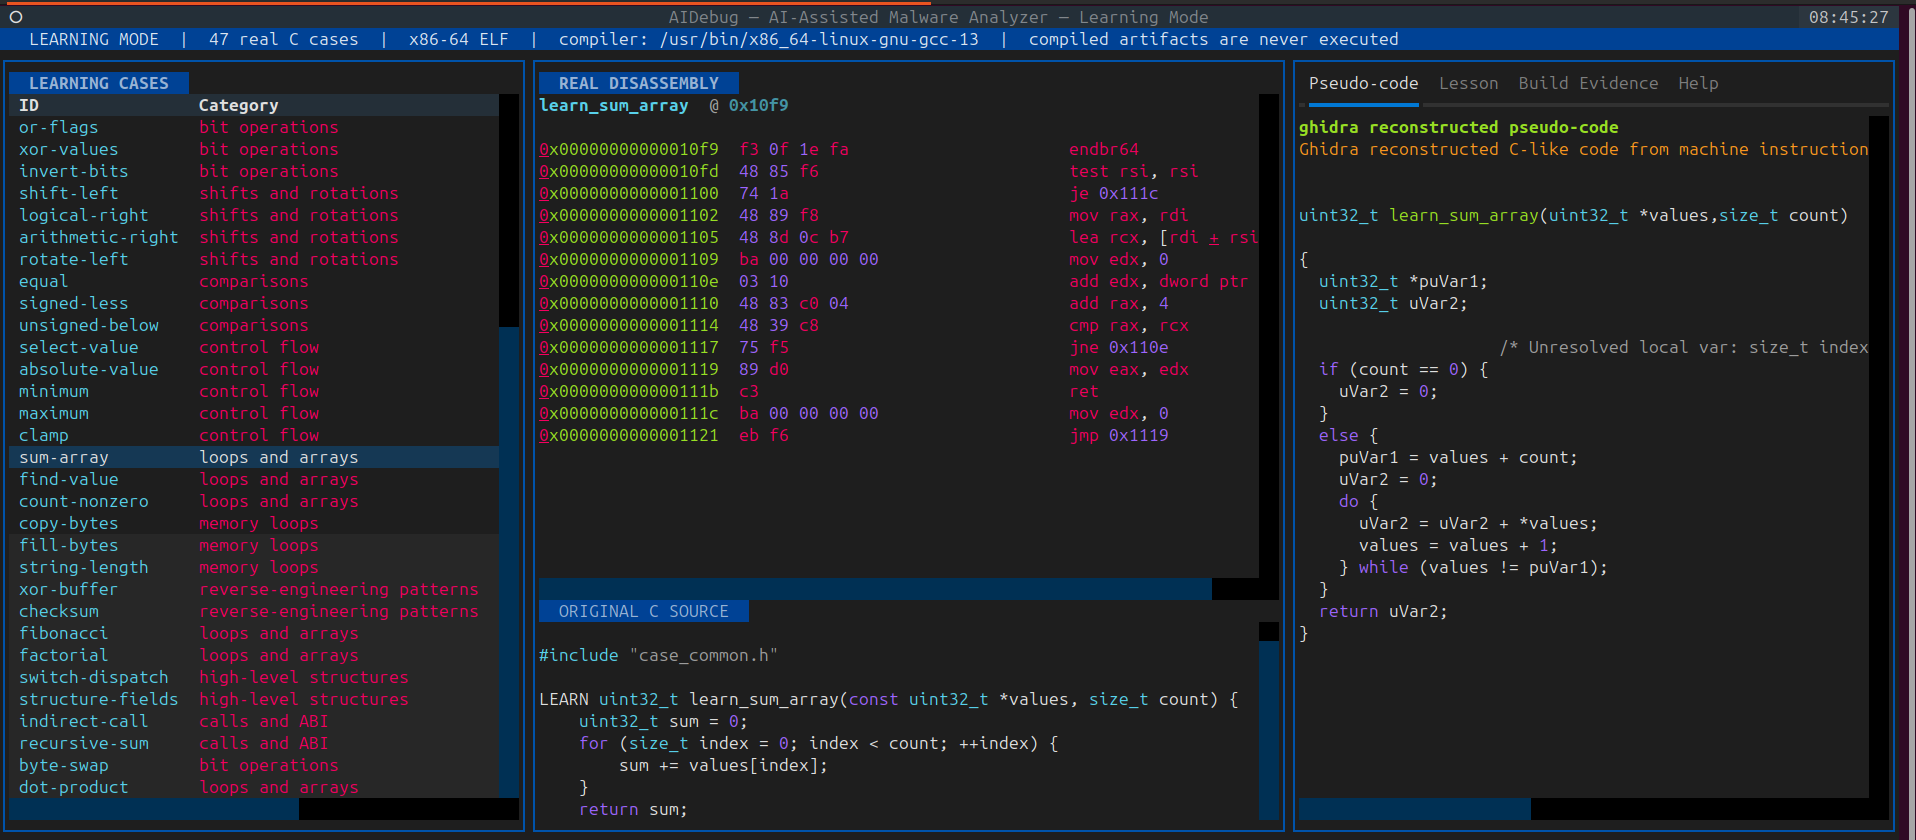
for (unsigned i = 0; i < count; i++)
    sum += values[i];
xor  eax, eax                 ; sum = 0
xor  r8d, r8d                 ; i = 0

loop_start:
cmp  r8d, edx                 ; i < count?
jae  loop_end
add  eax, dword ptr [rcx+r8*4]
inc  r8d
jmp  loop_start

loop_end:
ret
The backward jump is a strong loop clue. The unsigned jae suggests that count and i are treated as unsigned values.
Arrays and structures
mov eax, [rcx+rdx*4]          ; array[index] of 4-byte elements
mov eax, [rcx+0x18]           ; 4-byte field at offset 0x18
mov rax, [rcx+0x20]           ; pointer/64-bit field at offset 0x20
Repeated accesses from the same base with stable offsets often reveal a structure. Rename the base to something meaningful and create a provisional structure as evidence accumulates.
switch statements and jump tables
cmp  ecx, 5
ja   default_case
lea  rax, [rip+jump_table]
movsxd rdx, dword ptr [rax+rcx*4]
add  rdx, rax
jmp  rdx
A bounds check followed by an indexed table and indirect jump often represents a switch. It can also represent a state machine or interpreter dispatcher.
Function prologues and epilogues
endbr64
push rbp
mov  rbp, rsp
sub  rsp, 0x40
...
mov  rsp, rbp
pop  rbp
ret
This traditional frame is easy to recognize, but optimized x64 functions often omit RBP and address locals relative to RSP. Some small leaf functions have no prologue at all.
On binaries built with Intel Control-flow Enforcement Technology (CET), many valid indirect-branch targets begin with endbr64 (endbr32 in 32-bit code). It marks a permitted destination for CET's Indirect Branch Tracking; it is not ordinary application logic and does not, by itself, indicate packing or anti-analysis behavior.
Small decoding loops
xor  edx, edx

decode_loop:
cmp  rdx, r8
jae  decode_done
xor  byte ptr [rcx+rdx], 0x5a
inc  rdx
jmp  decode_loop

decode_done:
ret
This transforms R8 bytes in place using a one-byte XOR key. That could be configuration decoding, lightweight obfuscation, a test fixture, or part of malicious unpacking. The next consumer of the buffer is what gives the loop operational meaning.
9. Recognizing Windows API behavior
An API name is useful evidence, but a sequence of calls, their arguments, and the data flowing between them is much stronger.
Dynamic API resolution
Normal software and malware both resolve APIs at runtime:
LoadLibraryW / GetModuleHandleW
              ↓ module handle
         GetProcAddress
              ↓ function pointer
          indirect call
When imports are sparse but strings or hashes appear to identify API names, examine whether the sample builds its own import table. Trace the module handle, function-name pointer, returned address, and every indirect call that consumes it.
Memory preparation and unpacking
A suspicious—but still dual-use—sequence may look like:
VirtualAlloc
    ↓ writable buffer
copy or decode loop
    ↓ transformed content
VirtualProtect
    ↓ executable protection
indirect call or jump into the buffer
The important evidence is the transition from data preparation to execution. Record allocation size, protection flags, source of the bytes, destination address, and eventual control-transfer target.
Cross-process memory activity
Analysts often watch for this chain:
OpenProcess
    ↓ process handle
VirtualAllocEx
    ↓ remote address
WriteProcessMemory
    ↓ populated remote memory
CreateRemoteThread or another execution mechanism
Security products, debuggers, accessibility software, and administration tools can use similar APIs. Determine the target process, requested access, transferred content, protection flags, start address, and parent activity before classifying the behavior.
Behavioral API groups
| Behavior under investigation | APIs commonly encountered |
|---|---|
| File access | CreateFileW, ReadFile, WriteFile, DeleteFileW, MoveFileExW |
| Process creation | CreateProcessW, ShellExecuteExW |
| Process inspection | OpenProcess, ReadProcessMemory, VirtualQueryEx |
| Registry access | RegOpenKeyExW, RegQueryValueExW, RegSetValueExW |
| Services | OpenSCManagerW, CreateServiceW, OpenServiceW, StartServiceW |
| Networking | WinHttpOpen, WinHttpConnect, WinHttpSendRequest, WinHttpReadData, connect, send, recv |
| Cryptography | BCryptOpenAlgorithmProvider, BCryptDecrypt, CryptDecrypt |
| Environment or analysis checks | IsDebuggerPresent, CheckRemoteDebuggerPresent, timing and process-enumeration APIs |
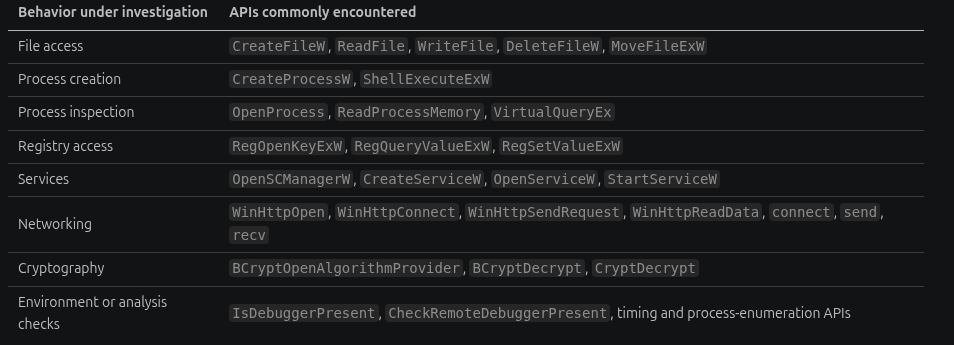
Do not stop at the function name. On Windows x64, reconstruct RCX, RDX, R8, R9, then inspect stack arguments. Translate constants, resolve pointed-to strings, and check the return value. The PE Import Analyzer guide, String Analyzer guide, and Unpacker guide provide complementary evidence before function-level analysis.
10. Imports, the TEB, and the PEB
Imported calls
A conventional PE import may appear as a RIP-relative indirect call:
call qword ptr [rip+__imp_CreateFileW]
The pointer comes from the Import Address Table (IAT), which the Windows loader populates. If the tool has parsed the PE correctly, it may label the target automatically. Packed or obfuscated samples may resolve functions manually and call through registers instead.
An import thunk or optimized tail call may use jmp instead of call:
jmp qword ptr [rip+__imp_CreateFileW]
This does not necessarily mean control flow has escaped into unrelated code. A thunk forwards directly to the imported function, while a tail call transfers to another function without creating a new return address; the eventual callee returns to the original caller.
TEB and PEB access
The Thread Environment Block (TEB) stores thread-related state and contains a pointer to the Process Environment Block (PEB). The PEB contains process-wide loader and environment information.
Common user-mode access patterns include:
mov rax, gs:[0x60]     ; common x64 pattern: obtain the PEB pointer
mov eax, fs:[0x30]     ; common x86 pattern: obtain the PEB pointer
Code may walk loader structures to enumerate modules without ordinary import helpers. That technique appears in packers, reflective loaders, shellcode, compatibility code, and malware. Treat it as a clue, then inspect what names, hashes, exports, and function pointers are derived.
Windows documents the TEB as an internal structure that may change. Tools and analysts can use known layouts for supported targets, but production software should not assume undocumented fields are permanently stable.
11. A worked analysis example
Consider this simplified Windows x64 function. Assume the analyst has already identified the called import as WriteFile:
; RCX = handle
; RDX = pointer to buffer
; R8D = buffer length

push rbx
sub  rsp, 0x40
mov  rbx, rdx
xor  eax, eax

transform_loop:
cmp  eax, r8d
jae  write_buffer
xor  byte ptr [rbx+rax], 0x23
inc  eax
jmp  transform_loop

write_buffer:
mov  rdx, rbx             ; lpBuffer
                         ; RCX still holds the handle
                         ; R8D still holds the length
lea  r9, [rsp+0x30]       ; lpNumberOfBytesWritten
mov  qword ptr [rsp+0x20], 0 ; lpOverlapped = NULL
call qword ptr [rip+__imp_WriteFile]

add  rsp, 0x40
pop  rbx
ret
Step 1: Establish the ABI
The code is x64 Windows, so the first three incoming arguments are in RCX, RDX, and R8. RBX is nonvolatile, so the function saves and restores it.
Step 2: Identify the loop
EAX begins at zero and increases until it reaches R8D. Each iteration modifies one byte at RBX + RAX. This is an in-place buffer transformation.
Step 3: Understand the branch
jae is an unsigned comparison. The loop stops when the index is greater than or equal to the buffer length.
Step 4: Reconstruct the API arguments
Before WriteFile:
RCX= file or device handle;RDX= transformed buffer;R8D= number of bytes to write;R9= address receiving the number written;- the fifth argument on the stack =
NULL.
Step 5: Produce cautious pseudocode
bool transform_and_write(
    HANDLE handle,
    unsigned char *buffer,
    unsigned int length)
{
    for (unsigned int i = 0; i < length; i++) {
        buffer[i] ^= 0x23;
    }

    DWORD written = 0;
    return WriteFile(handle, buffer, length, &written, NULL);
}
This reconstruction explains the mechanics, but not the intent. To decide whether it decodes stolen data, writes a benign encoded resource, or performs another task, trace where the handle and buffer originate and what happens to the output.
AIDebug practice flow: Start with
aidebug --learn xor-bufferto inspect a safe, real compiled byte-transformation loop. For an authorized PE specimen, useaidebug --binary /path/to/example.exe --offline --decompile, locate the relevant function in the main GUI, and compare its disassembly, calls, and Ghidra reconstruction. The API identity and surrounding data flow—not the XOR instruction by itself—support the behavioral conclusion.
12. A repeatable malware-analysis workflow
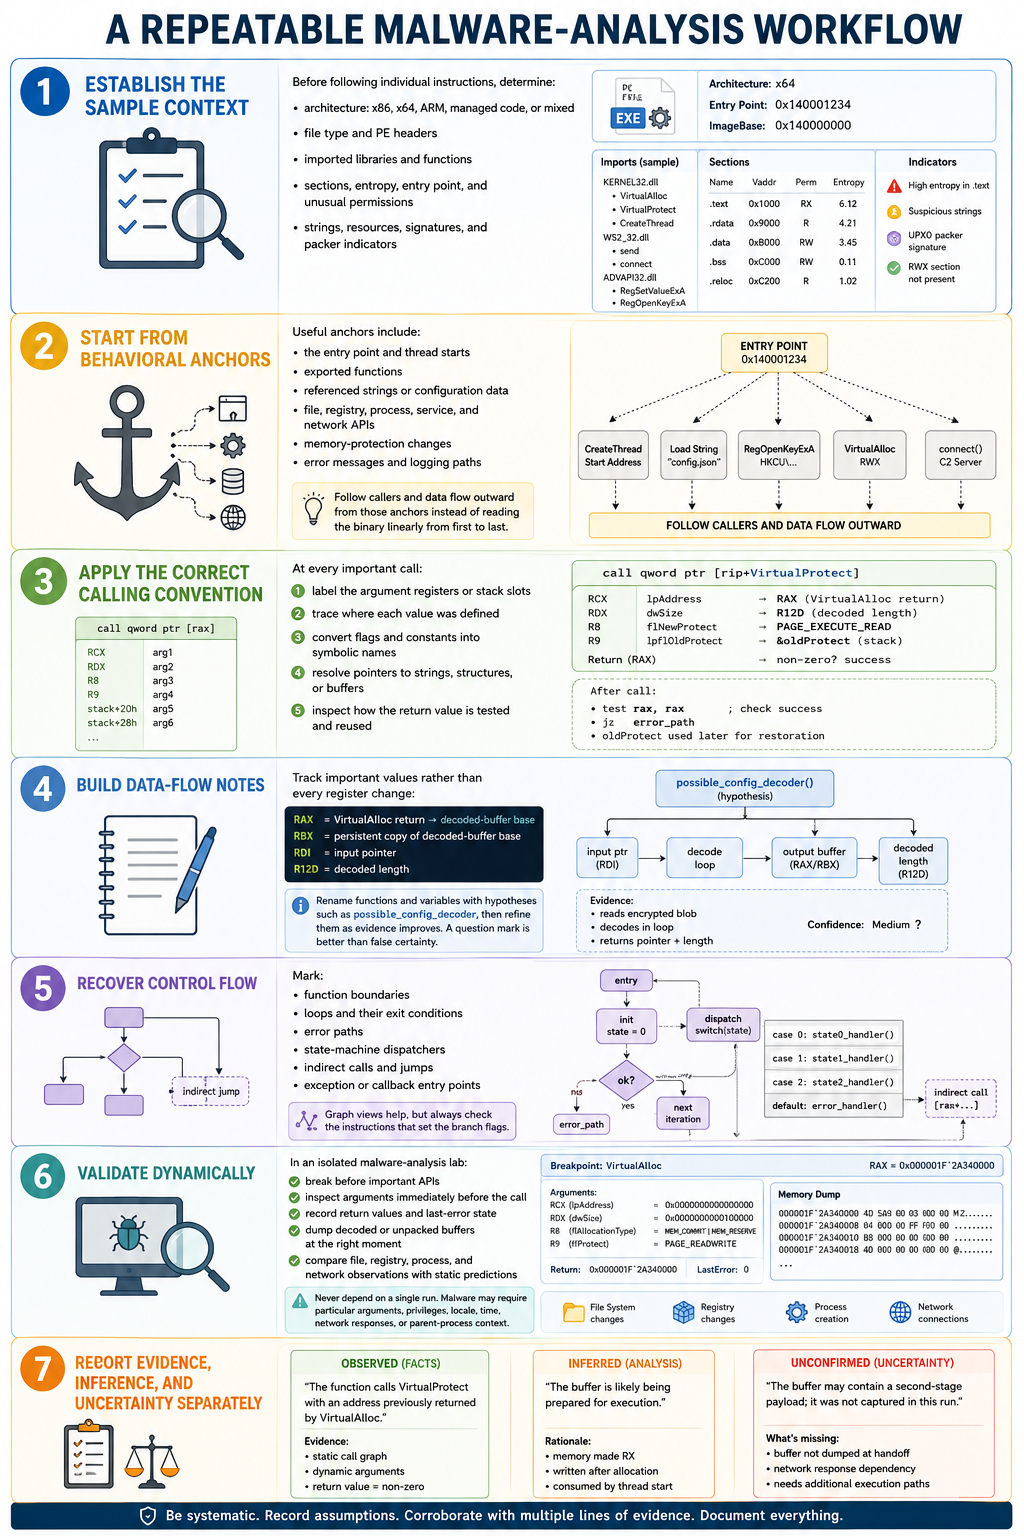
Use this workflow inside an isolated environment. The FLARE-VM, REMnux, and INetSim lab guide defines the containment, validation, snapshot, and recovery gates needed before dynamic work.
1. Establish the sample context
Before following individual instructions, determine:
- architecture: x86, x64, ARM, managed code, or mixed;
- file type and PE headers;
- imported libraries and functions;
- sections, entropy, entry point, and unusual permissions;
- strings, resources, signatures, and packer indicators.
2. Start from behavioral anchors
Useful anchors include:
- the entry point and thread starts;
- exported functions;
- referenced strings or configuration data;
- file, registry, process, service, and network APIs;
- memory-protection changes;
- error messages and logging paths.
Follow callers and data flow outward from those anchors instead of reading the binary linearly from the first byte to the last.
3. Apply the correct calling convention
At every important call:
- label the argument registers or stack slots;
- trace where each value was defined;
- convert flags and constants into symbolic names;
- resolve pointers to strings, structures, or buffers;
- inspect how the return value is tested and reused.
4. Build data-flow notes
Track important values rather than every register change:
RAX = VirtualAlloc return → decoded-buffer base
RBX = persistent copy of decoded-buffer base
RDI = input pointer
R12D = decoded length
Rename functions and variables with hypotheses such as possible_config_decoder, then refine them as evidence improves. A question mark is better than false certainty.
5. Recover control flow
Mark:
- function boundaries;
- loops and their exit conditions;
- error paths;
- state-machine dispatchers;
- indirect calls and jumps;
- exception or callback entry points.
Graph views help, but always check the instructions that set the branch flags.
6. Validate dynamically
In an isolated malware-analysis lab:
- break before important APIs;
- inspect arguments immediately before the call;
- record return values and last-error state;
- dump decoded or unpacked buffers at the right moment;
- compare file, registry, process, and network observations with static predictions.
Never depend on a single run. Malware may require particular arguments, privileges, locale, time, network responses, or parent-process context.
7. Report evidence, inference, and uncertainty separately
A defensible finding distinguishes:
- Observed: “The function calls
VirtualProtectwith an address previously returned byVirtualAlloc.” - Inferred: “The buffer is likely being prepared for execution.”
- Unconfirmed: “The buffer may contain a second-stage payload; it was not captured in this run.”
This discipline prevents reverse-engineering guesses from becoming unsupported incident claims.
13. Common interpretation mistakes
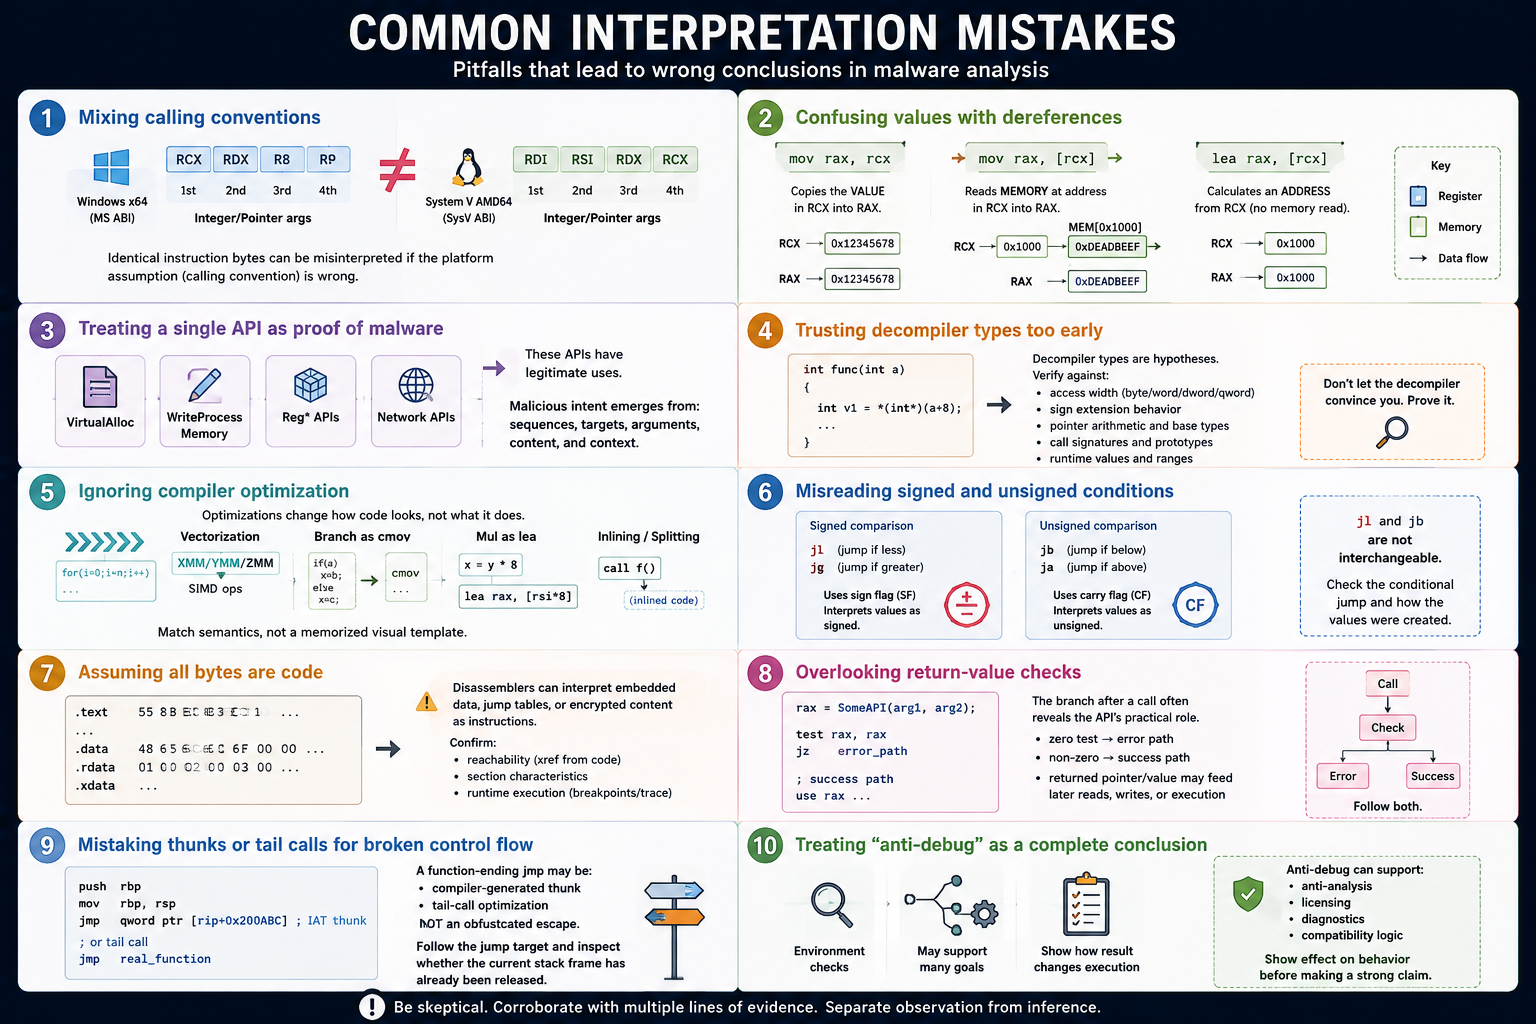
Mixing calling conventions
RCX is the first ordinary integer/pointer argument on Windows x64. RDI is the first on System V AMD64. Identical instruction bytes can be interpreted incorrectly if the platform assumption is wrong.
Confusing values with dereferences
mov rax, rcx copies a value. mov rax, [rcx] reads memory. lea rax, [rcx] copies/calculates an address without reading through it.
Treating a single API as proof of malware
VirtualAlloc, WriteProcessMemory, registry APIs, and networking functions all have legitimate uses. Behavior emerges from sequences, targets, arguments, content, and context.
Trusting decompiler types too early
Decompiler types are hypotheses. Verify them against access width, sign extension, pointer arithmetic, call signatures, and runtime values.
Ignoring compiler optimization
An optimized loop may be unrolled or vectorized. A branch may become cmov. A multiplication may become lea. A function may be inlined or split. Match semantics, not a memorized visual template.
Misreading signed and unsigned conditions
jl and jb are not interchangeable. Check the conditional jump and how the compared values were created.
Assuming all bytes are code
Disassemblers can interpret embedded data, jump tables, or encrypted content as instructions. Confirm reachability, cross-references, section characteristics, and runtime execution.
Overlooking return-value checks
The branch after a call often reveals the API's practical role. A zero test may select an error path, while a returned pointer may become the base of later reads, writes, or execution.
Mistaking thunks or tail calls for broken control flow
A function-ending jmp, especially through an IAT entry or to another known function, may be a compiler-generated thunk or tail-call optimization rather than an obfuscated escape. Follow the jump target and inspect whether the current stack frame has already been released.
Treating “anti-debug” as a complete conclusion
Environment checks can support anti-analysis behavior, licensing, diagnostics, or compatibility logic. Show how the result changes execution before making a strong claim.
14. Analyst checklist
For each important function, ask:
- Which architecture, platform, and calling convention apply?
- What are the inputs and likely return value?
- Which registers must survive function calls?
- Which memory accesses are reads, writes, addresses, or dereferences?
- What do the operand sizes suggest?
- Which instruction set the flags used by each branch?
- Are comparisons signed or unsigned?
- Where do loops start and stop?
- Which pointers represent arrays, structures, strings, or code?
- Are indirect call and jump targets understood?
- Which API arguments and constants can be resolved symbolically?
- Does a sequence of calls support a behavioral hypothesis?
- Has the hypothesis been tested dynamically in an isolated lab?
- Does the report separate observations from inferences?
15. Key takeaways
Assembly becomes manageable when you stop treating it as a vocabulary test and start treating it as structured evidence.
Focus first on:
- registers that carry arguments, pointers, and return values;
- brackets, operand sizes, and effective addresses;
cmp/testfollowed by conditional branches;- the correct calling convention for the platform;
- loops, arrays, structures, and indirect control flow;
- API sequences and the data passed between them;
- validation through safe dynamic analysis.
A strong analyst does not merely recognize instructions. They explain how data moves, how decisions are made, what behavior results, and how confident the evidence allows them to be.
16. References
Primary documentation for validating instruction semantics, binary structure, and calling conventions:
- AIDebug repository and usage documentation
- Intel® 64 and IA-32 Architectures Software Developer Manuals
- Microsoft x64 calling convention
- Microsoft x64 ABI conventions
- Microsoft PE/COFF format
- System V x86-64 psABI project
- Microsoft TEB structure
- Microsoft GetProcAddress documentation
- Microsoft VirtualAlloc documentation
- Microsoft CreateRemoteThread documentation