Investigation: From Log To Report
Level: Complex Platform Workflow
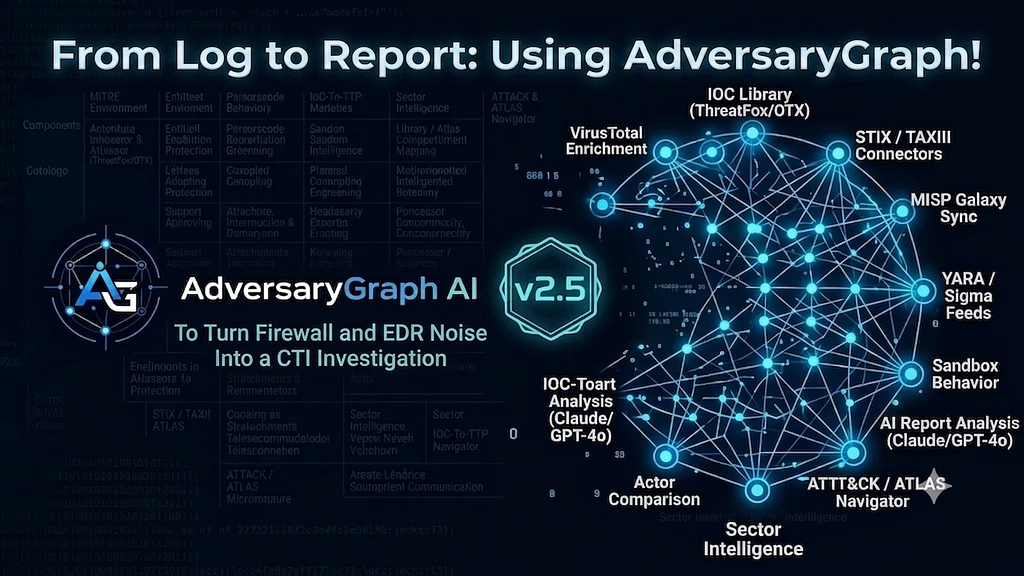
Published walkthrough: From Log to Report: Using AdversaryGraph to Turn Firewall and EDR Noise Into a CTI Investigation
Real-Life Scenario
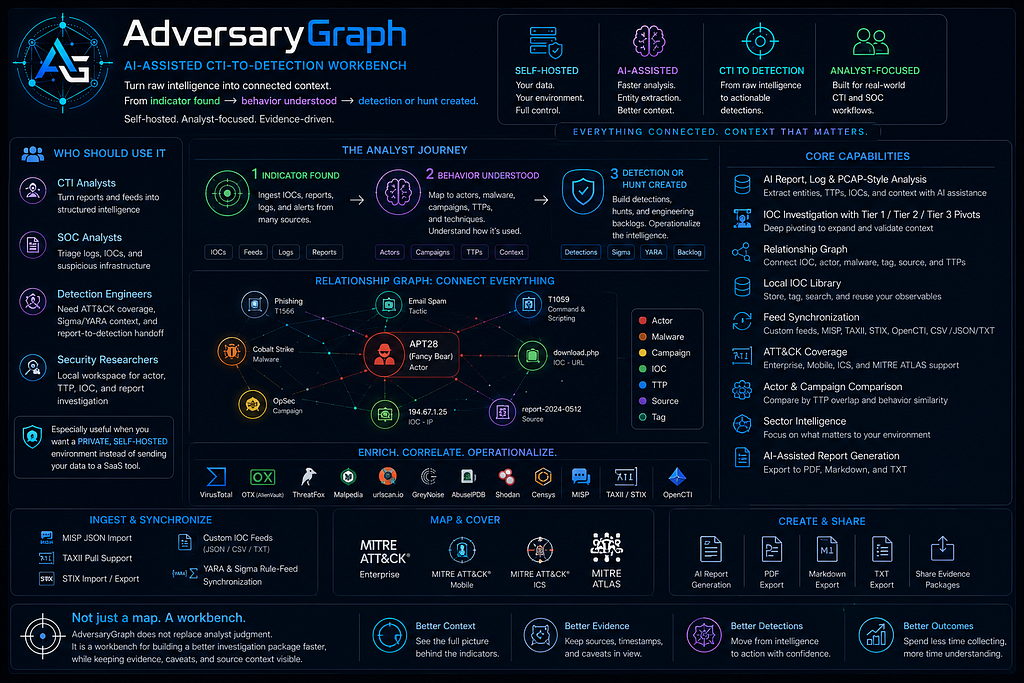
A SOC receives noisy firewall telemetry and EDR process logs from a suspicious workstation. The customer needs a defensible answer, not only a list of alerts: what happened, which indicators matter, which ATT&CK techniques are supported by evidence, which pivots deserve enrichment, and what can be handed to detection engineering.
This use case shows the full AdversaryGraph path from raw telemetry to a structured investigation and final report.
Goal
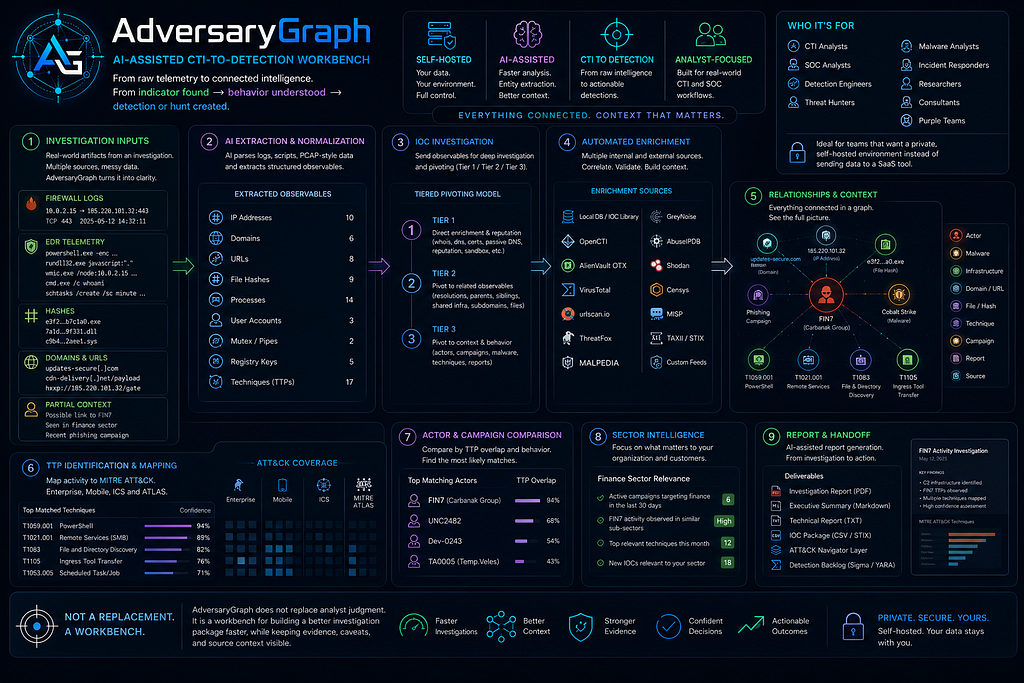
Turn separate firewall and EDR logs into:
- extracted IOCs
- suspicious behavior rows with evidence
- ATT&CK TTP leads
- enriched IOC investigation results
- relationship graph pivots
- an investigation TTP layer
- actor-overlap hypotheses
- an AI investigation summary
- a final report
End-To-End Flow
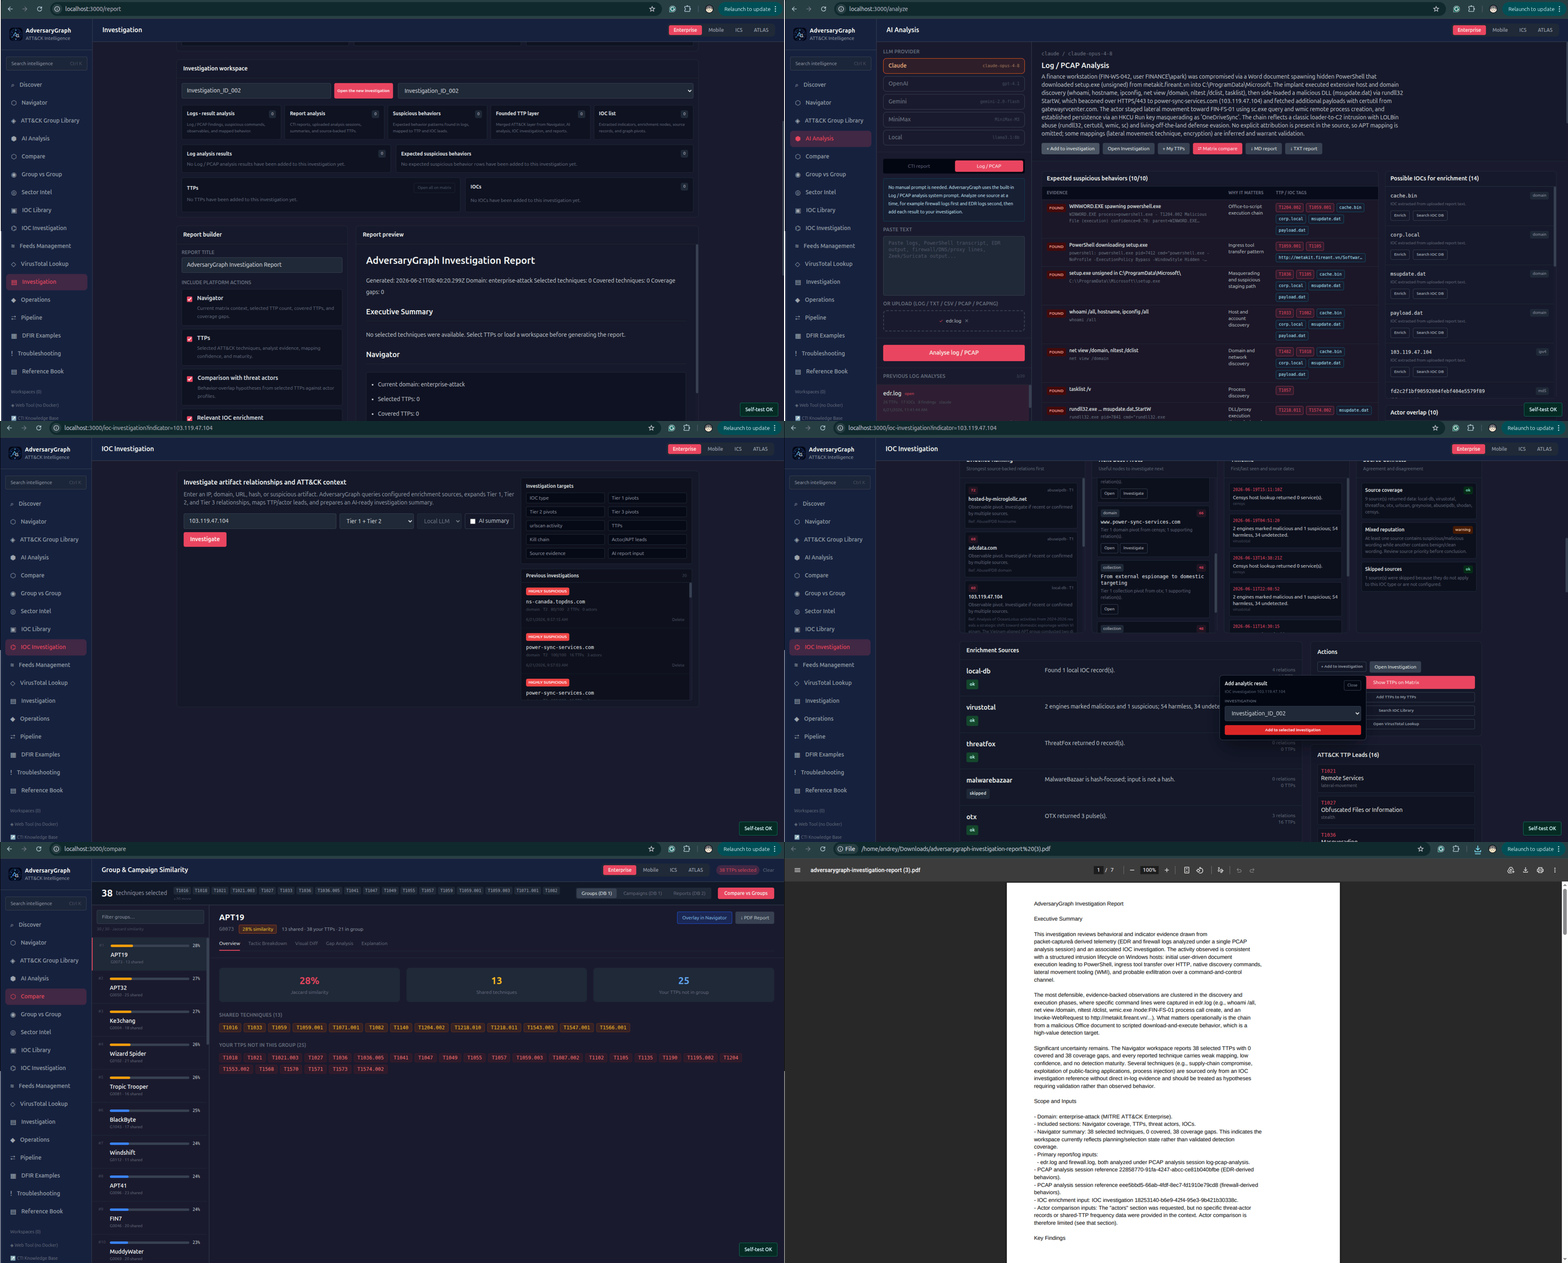
- Create a new investigation workspace.
- Analyze firewall logs in AI Analysis -> Log / PCAP mode.
- Add the firewall analysis result to the investigation.
- Analyze EDR logs as a separate Log / PCAP run.
- Add the EDR analysis result to the same investigation.
- Review extracted IOCs, suspicious behaviors, and TTP leads.
- Investigate high-value IOCs in IOC Investigation.
- Review Tier 1 / Tier 2 / Tier 3 pivots and the relationship graph.
- Add useful IOC investigation results to the same investigation.
- Send the investigation TTP layer to the ATT&CK matrix.
- Compare the TTP layer with threat actors.
- Generate an AI summary.
- Build and export the final report.
Step 1: Create The Investigation
Start with an investigation workspace before analyzing logs. This keeps every later result tied to the same case.
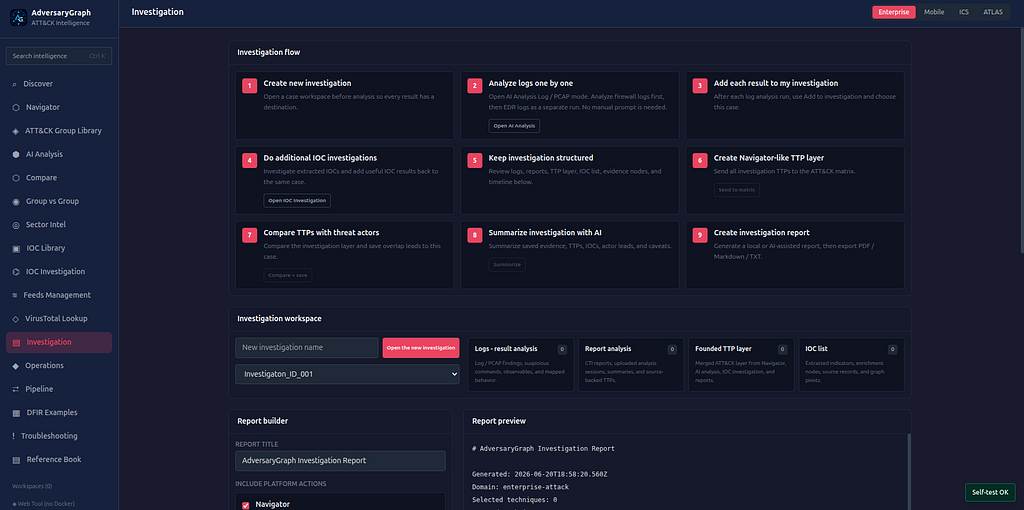
The investigation will collect:
- log analysis results
- report analysis results
- suspicious behavior rows
- TTPs
- IOCs
- IOC investigation findings
- actor comparison results
- AI summaries
- final reports
Step 2: Analyze Firewall Logs
Open AI Analysis, choose Log / PCAP, and upload or paste the firewall logs only. No manual prompt is needed; AdversaryGraph uses its built-in log-analysis system prompt.
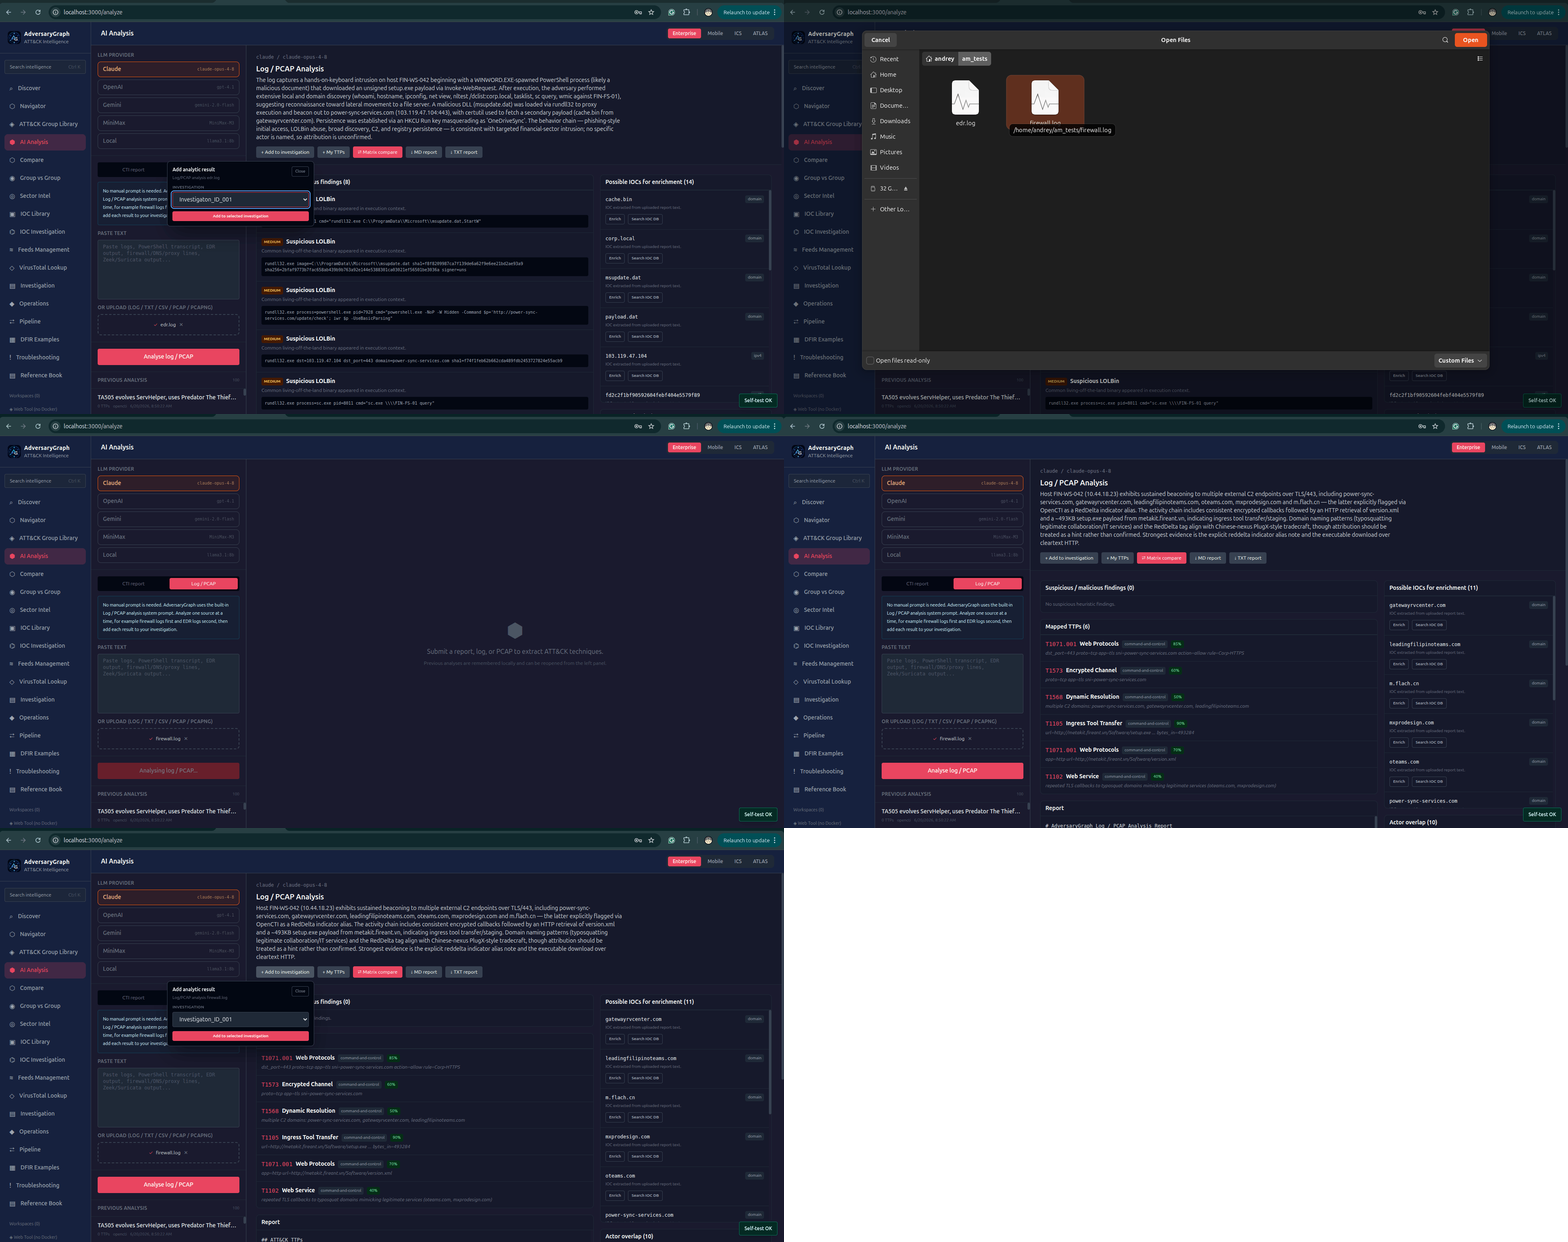
The expected output is a structured first-pass analysis: suspicious destinations, repeated C2-like connections, extracted domains/IPs, possible TTPs, and evidence snippets.
Step 3: Analyze EDR Logs Separately
Run the EDR logs as a second analysis source. Keeping sources separate makes the evidence easier to audit later.
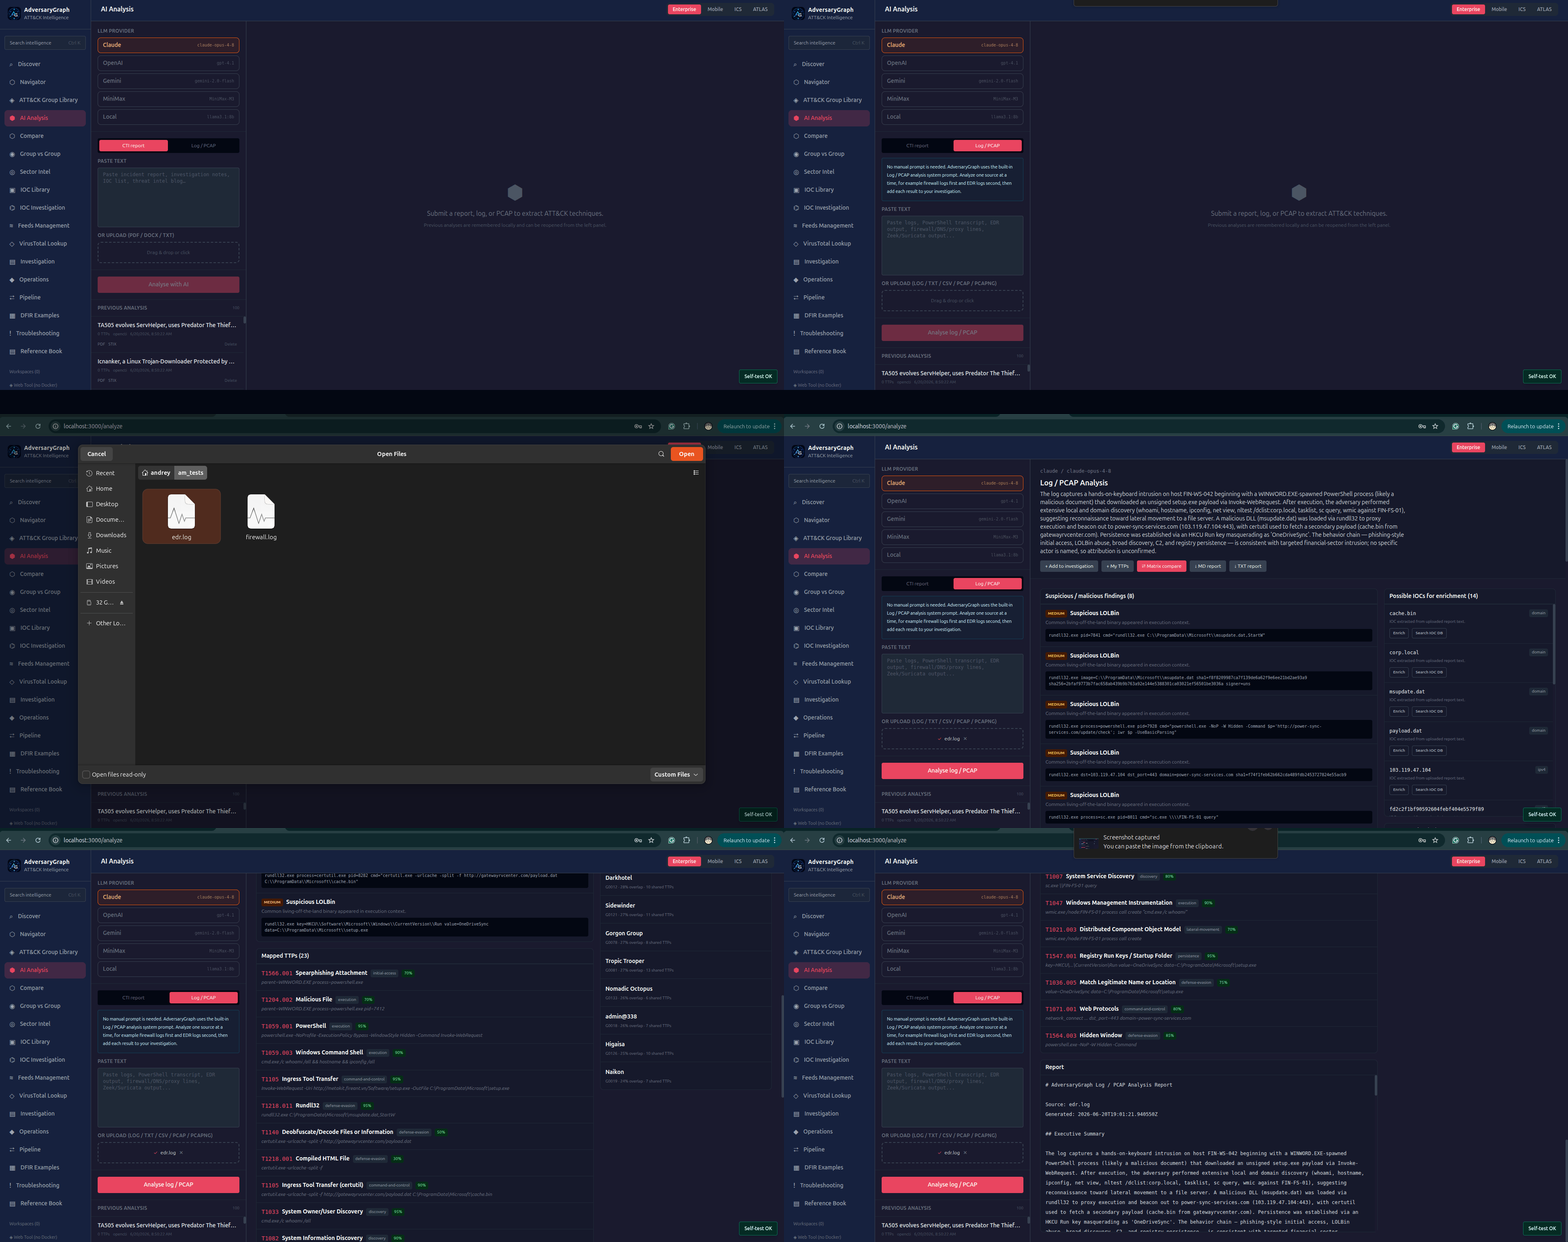
The EDR result should identify suspicious process chains, command-line behavior, staging paths, persistence leads, and extracted hashes or file names.
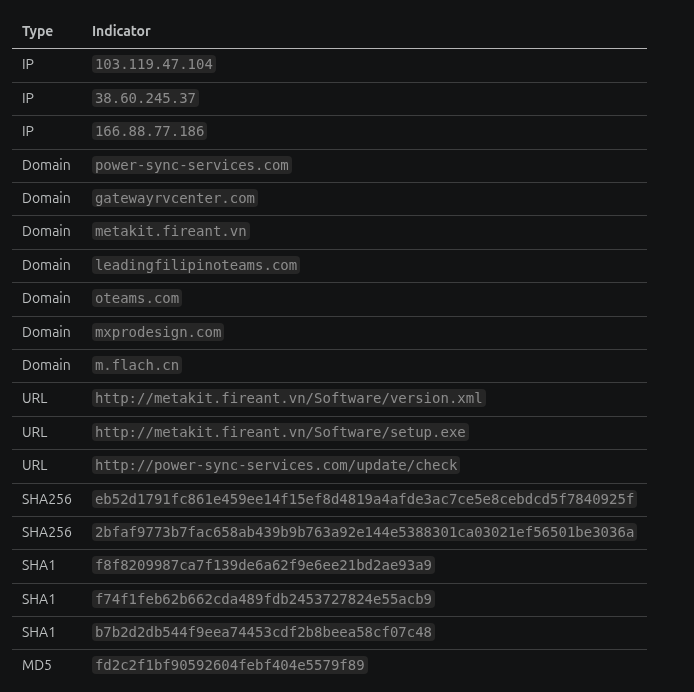
Step 4: Review Extracted IOCs
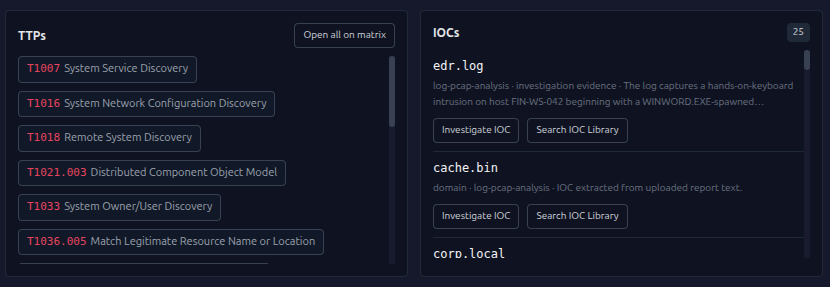
AdversaryGraph extracts IOCs from each source and keeps the source context attached.
Step 5: Review Suspicious Behaviors
Suspicious behavior rows explain what was observed and why it matters. They are useful for both CTI notes and detection engineering.
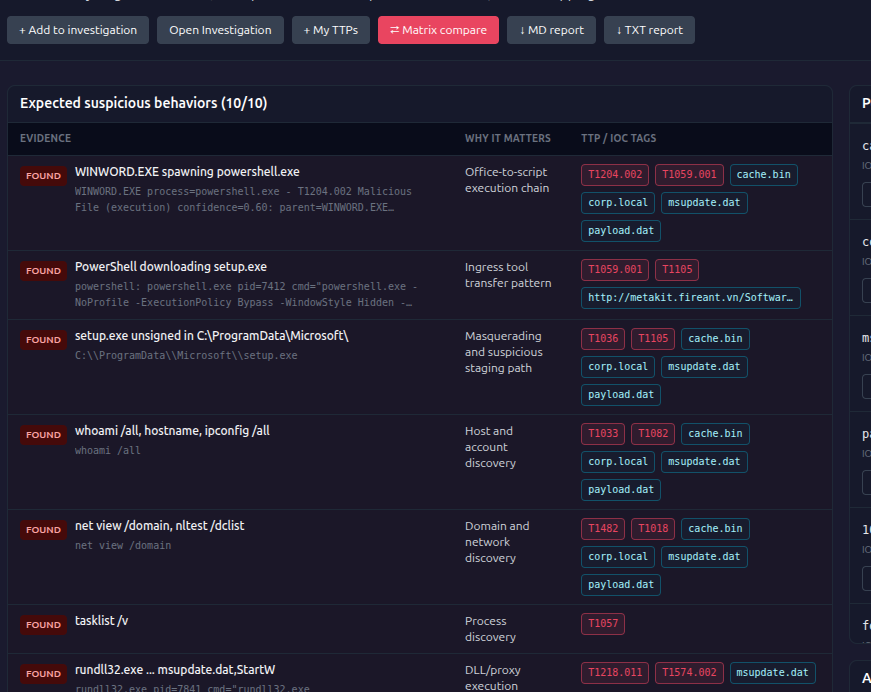
Examples include Office-to-script execution, PowerShell download behavior, discovery commands, suspicious staging paths, signed-binary proxy execution, and persistence indicators.
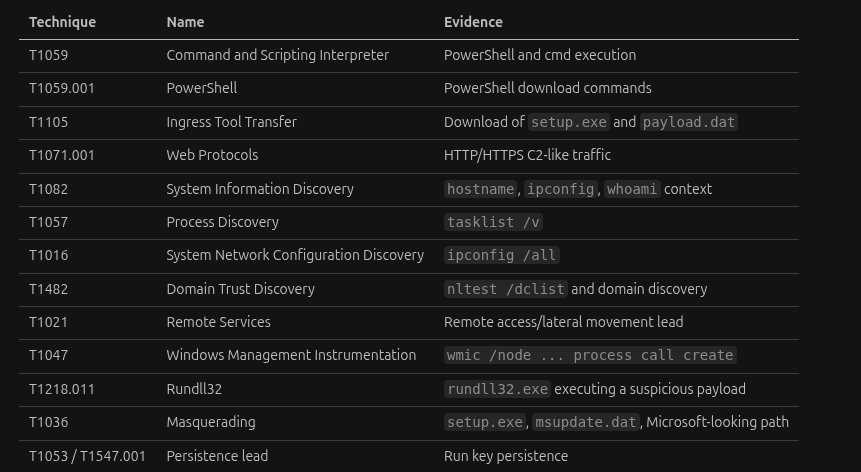
Step 6: Review ATT&CK Technique Leads
Technique leads remain analyst-review items. A TTP should be accepted only when the source evidence supports the ATT&CK behavior.
Step 7: Investigate High-Value IOCs
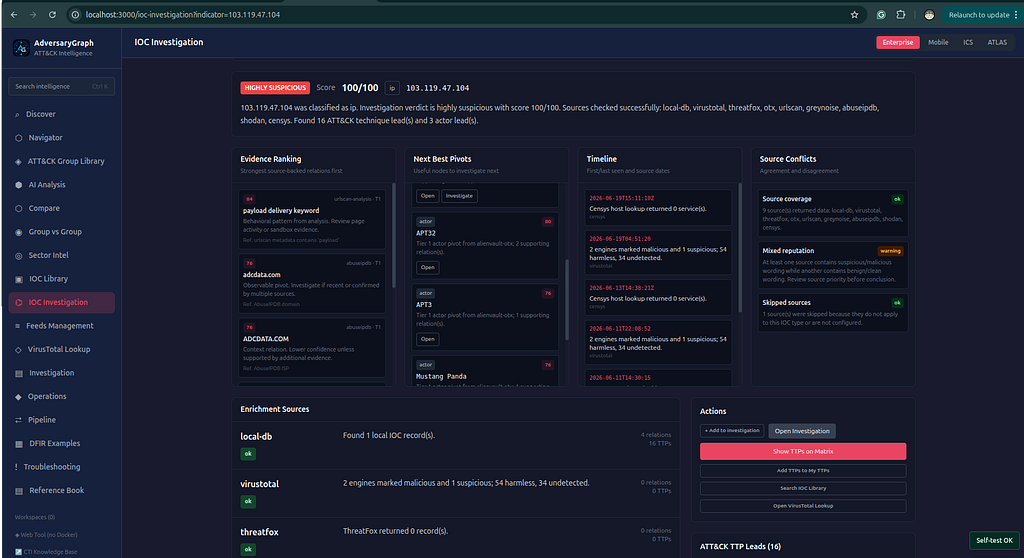
Open IOC Investigation for the strongest extracted indicator.
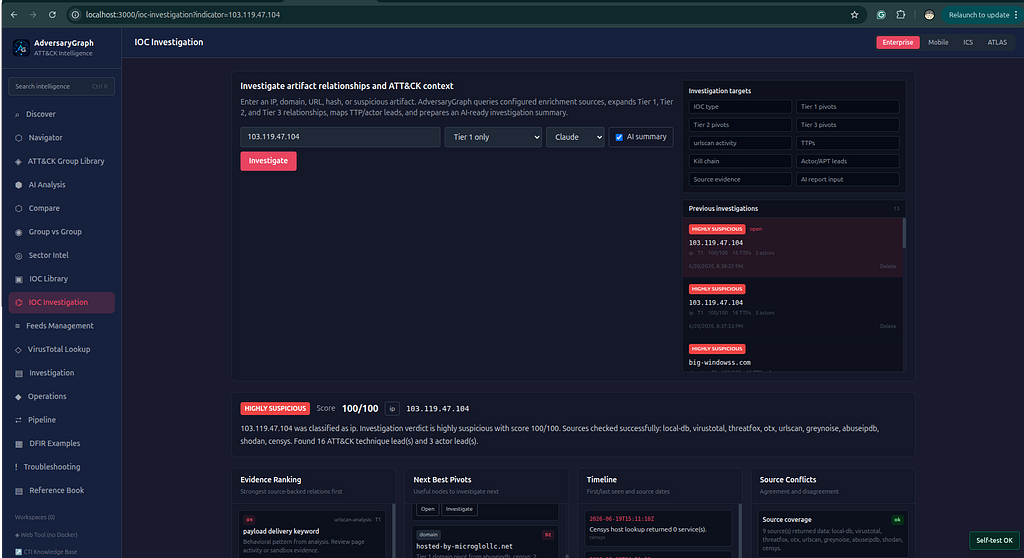
Review the verdict, source coverage, timeline, reputation signals, source conflicts, actor leads, and ATT&CK leads.
Step 8: Pivot Through The Relationship Graph
The graph is used for source-backed pivots. Click nodes to review connected domains, IPs, URLs, hashes, malware leads, actor leads, collections, and source context.
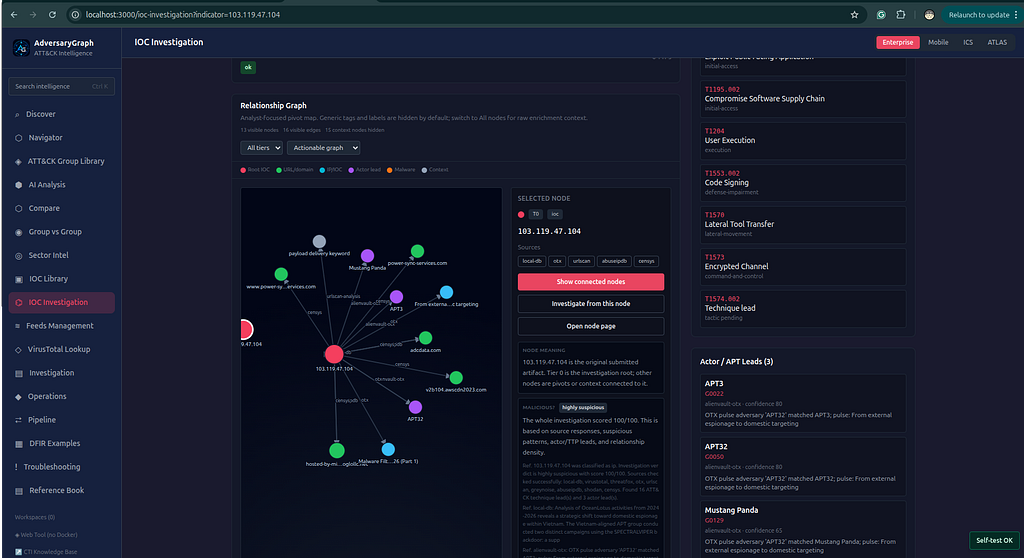
Treat graph links as investigation leads until corroborated by stronger evidence.
Step 9: Add IOC Investigation Results
Add useful IOC investigation output back into the active investigation.
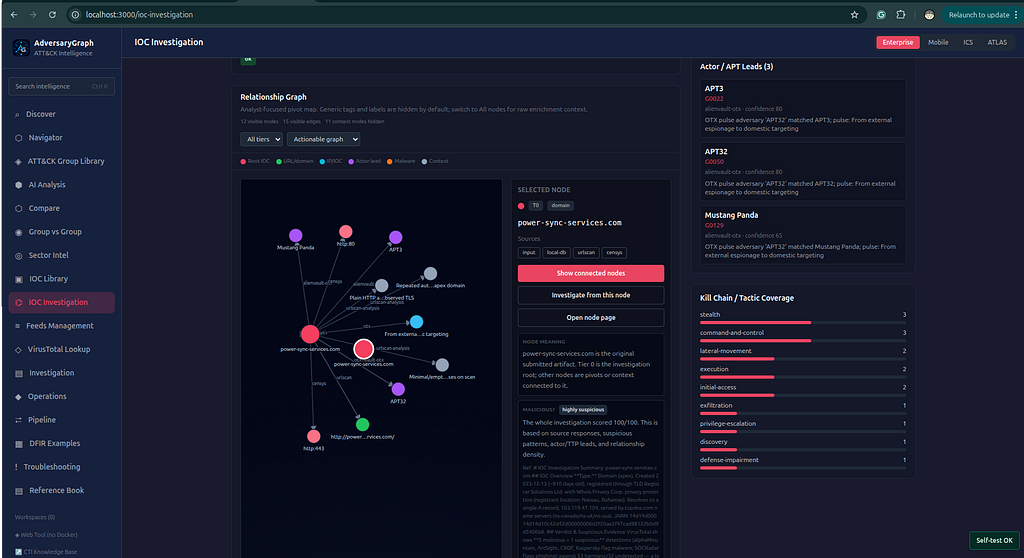
This keeps the IOC verdict, pivots, TTP leads, and source evidence in the same workspace as the original log analysis.
Step 10: Review The Investigation Workspace
The investigation workspace merges all accepted evidence.
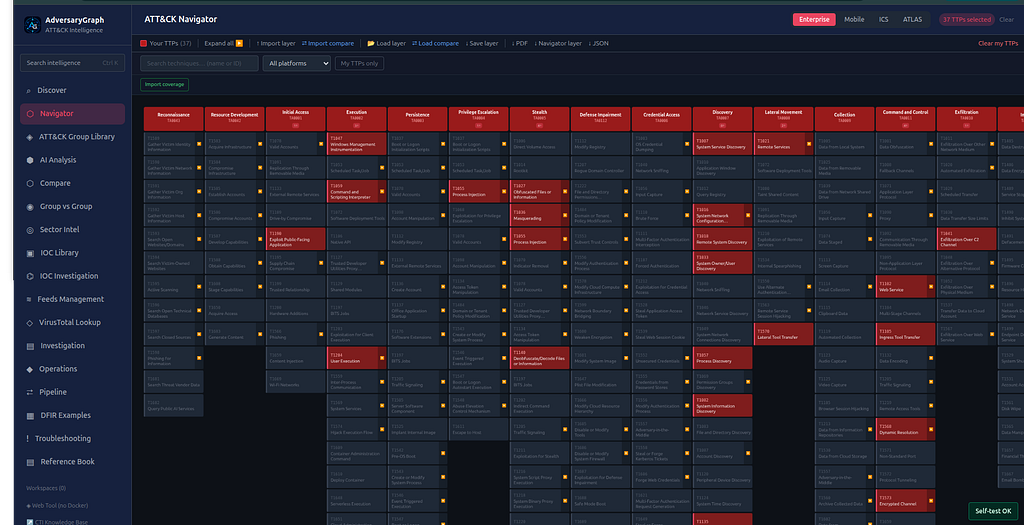
Use this view to check whether the case has enough evidence for a report, whether more IOC pivots are needed, and whether weak TTPs should be removed or marked for review.
Step 11: Send TTPs To The Matrix
Create a Navigator-like layer from investigation TTPs and send it to the ATT&CK matrix.
This helps show coverage across tactics and makes the behavior easier to compare with known actor profiles.
Step 12: Compare With Threat Actors
Use overlap comparison as a hypothesis-generation tool, not attribution.
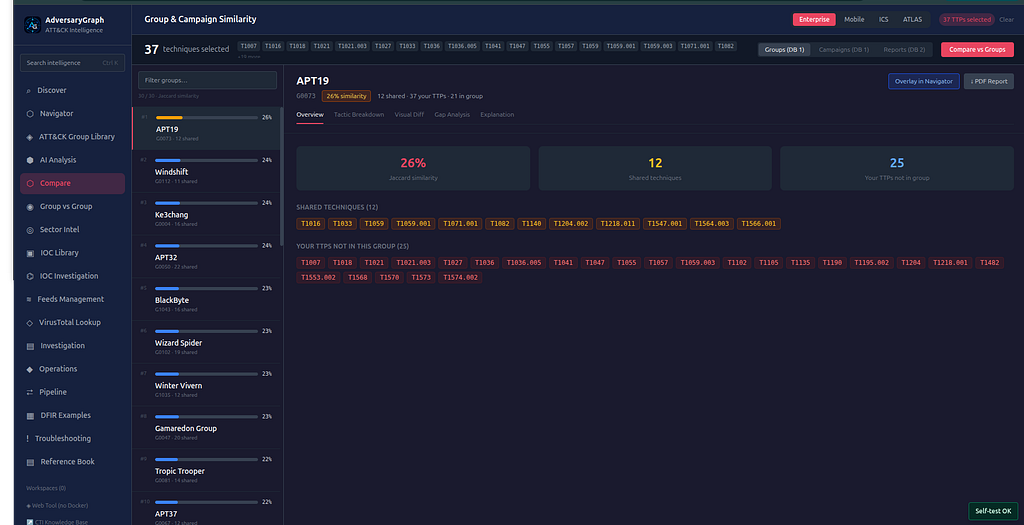
Shared TTPs should be reviewed for distinctiveness. Common techniques such as PowerShell, Valid Accounts, Phishing, or Data Encrypted for Impact carry less weight unless paired with stronger evidence.
Step 13: Generate AI Summary And Report
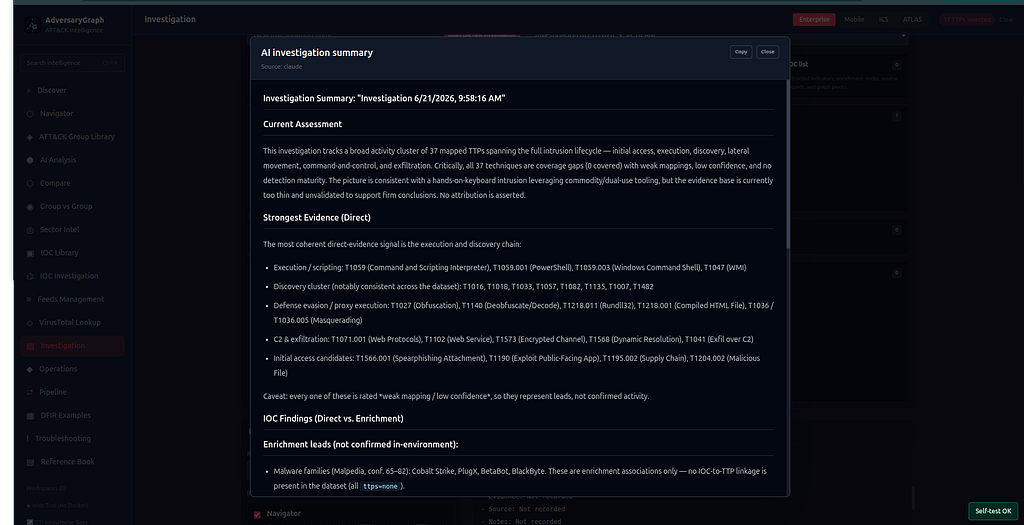
Generate an AI investigation summary from the saved evidence.
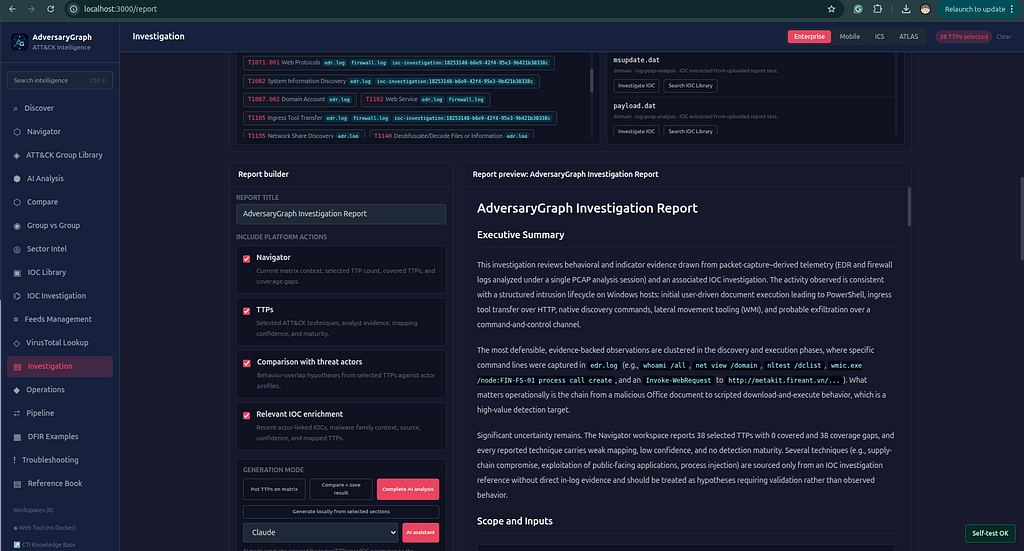
Then build the final report.
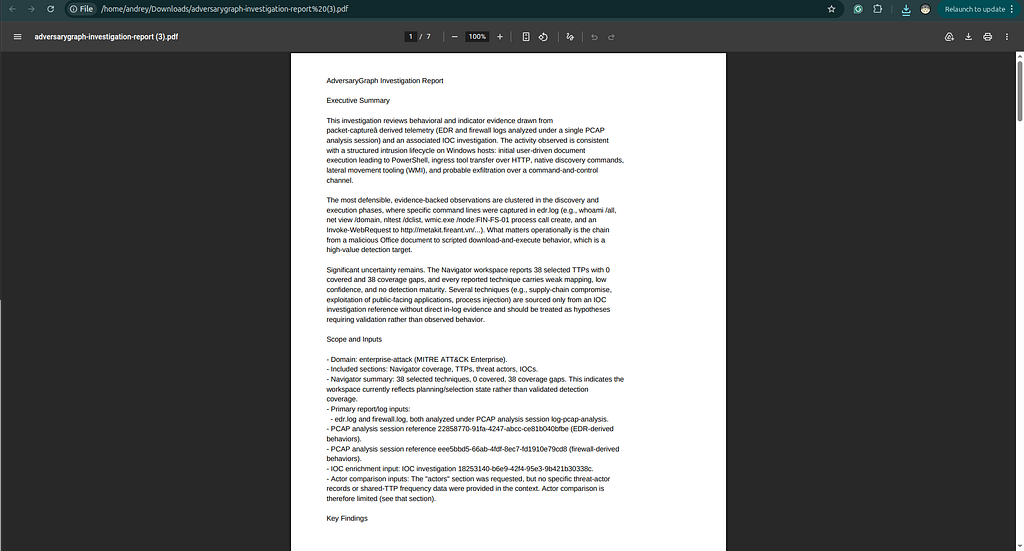
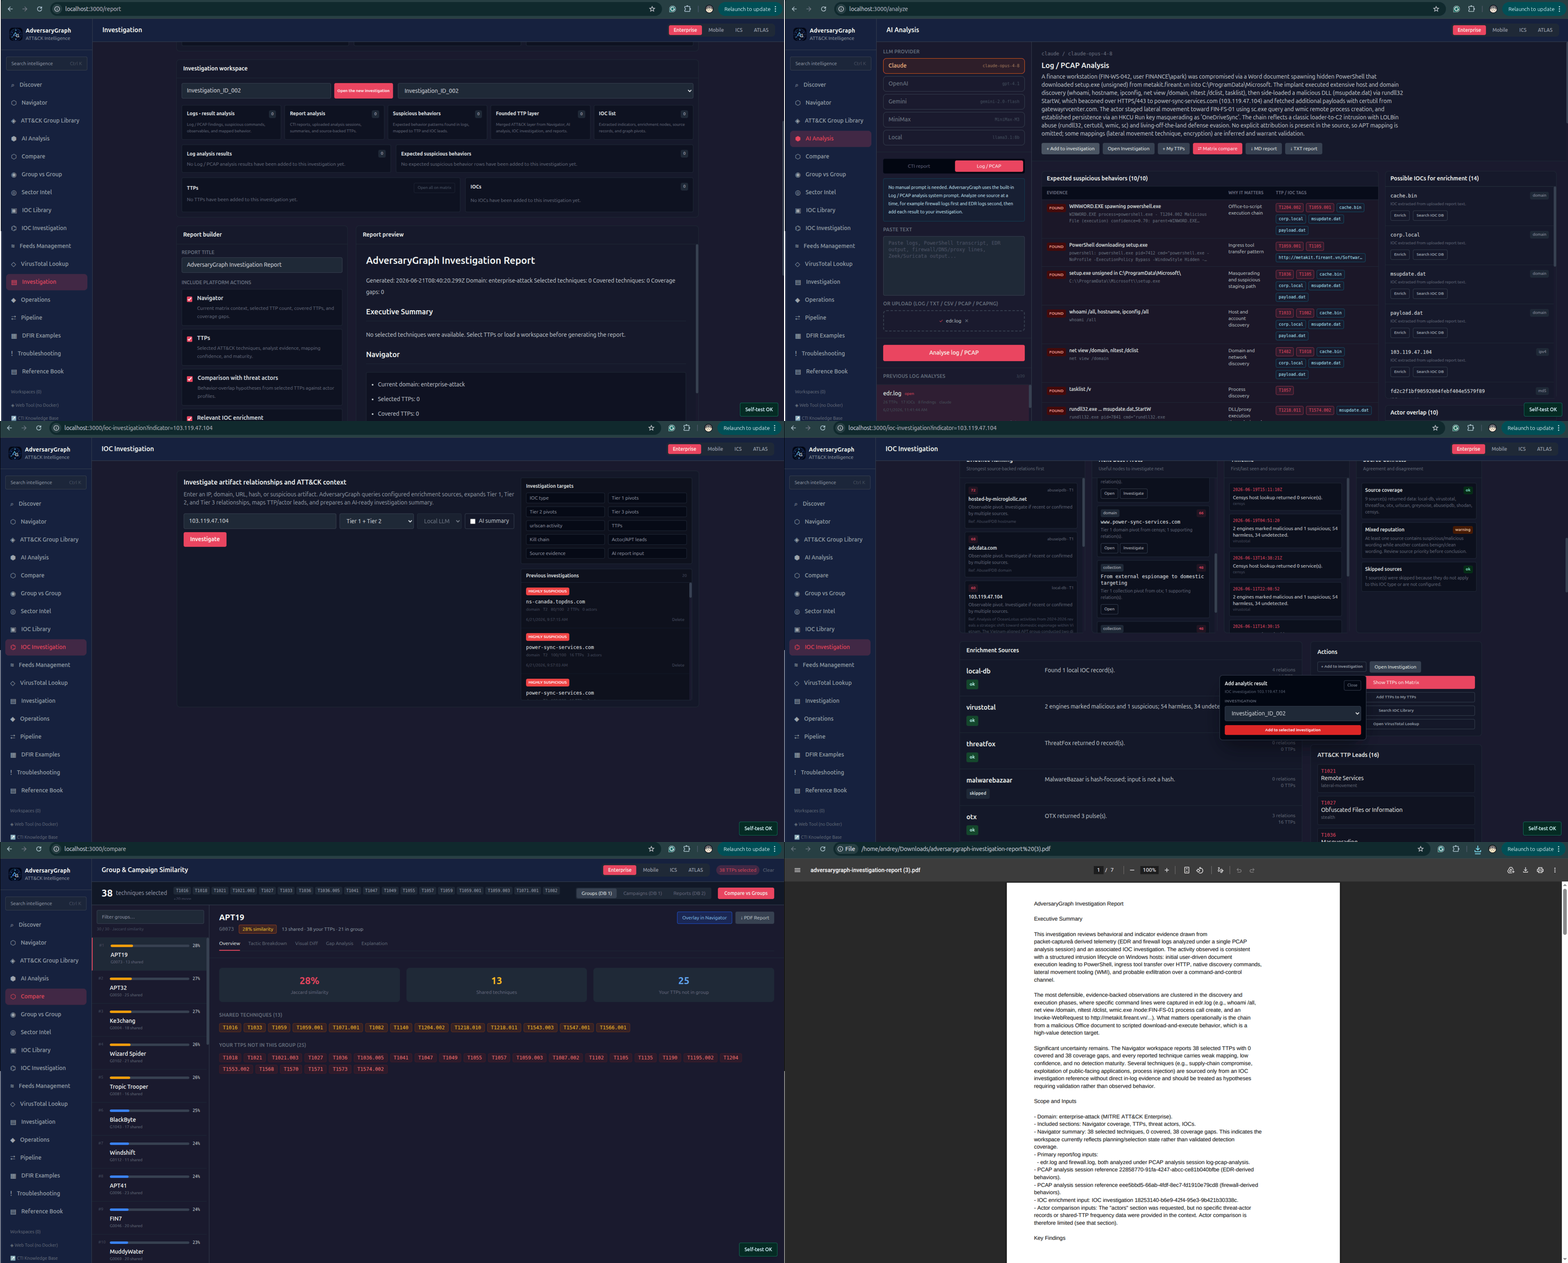
Expected Result
The final output is a structured investigation package with source-tagged logs, extracted IOCs, reviewed suspicious behaviors, ATT&CK TTP leads, enrichment evidence, graph pivots, matrix context, actor-overlap hypotheses, and a report that can be exported as PDF, Markdown, or TXT.
Review Notes
- Keep firewall and EDR logs as separate analysis runs.
- Add each useful result to the same investigation.
- Do not treat actor overlap as attribution.
- Keep source tags attached to each IOC and TTP.
- Discount high-frequency techniques unless the surrounding evidence is distinctive.
- Use the final report as a reviewed handoff artifact, not as raw LLM output.
Platform Areas Used
- Investigation
- AI Analysis -> Log / PCAP
- IOC Investigation
- IOC Library
- Relationship Graph
- Navigator matrix
- Group comparison
- Report builder
- PDF / Markdown / TXT exports