Malware Analysis
AdversaryGraph v4 adds a Malware Analysis workspace backed by the isolated MalwareGraph service. It is designed for analyst triage, evidence organization, ATT&CK mapping, IOC extraction, unpacking workflows, AI-assisted reverse engineering notes, and controlled dynamic-analysis preparation.
Malware Analysis output is analyst-assistance data. Static findings, AI summaries, decompilation views, unpacking output, dynamic-analysis notes, family leads, and ATT&CK mappings must be validated before operational use.
What The Module Does
The module gives analysts one place to work through a sample:
- Create or open a malware-analysis case.
- Upload a raw file or password-protected ZIP.
- Review first-pass static triage: hashes, magic bytes, entropy, packer and obfuscation signals, PE metadata, sections, imports, and extracted files.
- Check hash and reputation feeds without uploading the binary to third-party services.
- Extract strings and classify IOC, API, registry, command, PowerShell, mutex, filename, URL, domain, hash, and ATT&CK leads.
- Run static unpacking and deobfuscation workflows.
- Open the decompilation/debug IDE for function-level review.
- Prepare dynamic-analysis sessions only when the operator explicitly enables a disposable isolated runtime profile.
- Use AI to summarize function purpose, suspicious behavior, dynamic findings, validation gaps, and recommended next actions.
- Pivot extracted IOCs and TTPs into AdversaryGraph IOC Library, IOC Investigation, Navigator, Compare, reports, and operations workflows.
Safety Model
The default policy is static-only.
| Control | Default | Why it matters |
|---|---|---|
| Sample execution | Disabled | Prevents accidental malware execution during triage. |
| Dynamic debugging | Disabled | Requires explicit service configuration and runtime disclaimer. |
| Outbound network from analysis jobs | Disabled | Prevents uncontrolled command-and-control callbacks. |
| Binary upload to external services | Disabled | Hash and IOC lookups are used by default. |
| Storage boundary | Separate MalwareGraph storage | Keeps samples out of the main AdversaryGraph app containers. |
| Runtime workflow | Disposable isolated profile | Dynamic analysis must run outside normal production networks. |
Use Malware Analysis only in a private lab or self-hosted deployment. Do not upload live malware to public demos or shared environments.
Architecture
AdversaryGraph React UI
  -> AdversaryGraph FastAPI backend
  -> MalwareGraph proxy client
  -> isolated MalwareGraph service
  -> quarantine, artifacts, logs, static analysis, unpacking, debug workspace
The MalwareGraph service can run in two modes:
| Mode | Purpose |
|---|---|
| Integrated AdversaryGraph mode | Normal operator workflow through /api/malwaregraph/* proxy routes. |
| Standalone MalwareGraph mode | Direct MalwareGraph API use for lab scripting and batch experiments. |
Technology Stack
The current implementation uses real local modules and libraries:
| Area | Actual implementation |
|---|---|
| API | FastAPI, Uvicorn, Pydantic, python-multipart |
| Static file parsing | Python struct, math, pathlib, MalwareGraph static-analysis services |
| Hashing | Python hashlib |
| Archive handling | Python zipfile, pyzipper |
| IOC extraction | Python re, ipaddress, urllib.parse |
| Strings | ASCII/UTF-16LE extraction, base64/hex decoding, entropy scoring |
| Disassembly | Capstone for x86/x64 where available, fallback hex preview |
| Static depacking | UPX binary, Python subprocess, zlib/bz2/lzma/base64/XOR recovery heuristics |
| Runtime unpack planning | Policy-gated Unipacker workflow |
| Debug workspace | MalwareGraph debug workspace service with function steps, registers, stack, memory, API hooks, and graph export |
| AI assistant | HTTPX client to Claude, OpenAI, Gemini, MiniMax/OpenAI-compatible, local OpenAI-compatible, or AdversaryGraph LLM proxy |
| UI | React, TypeScript, Vite, Tailwind CSS, TanStack Query, Axios, React Router |
Not currently embedded as engines: IDA Pro, Ghidra, RetDec, CAPE/Cuckoo, YARA, Volatility, Frida, or Qiling execution. The UI can look like a debugger or decompiler, but it does not bundle those commercial or external engines.
Workflow Screenshots
The screenshots below were captured from the local v4 UI and validated as
1920x1200, nonblank images. The validation file is available at
/img/malware-analysis-v4/validation.json.
Malware Analysis Dashboard
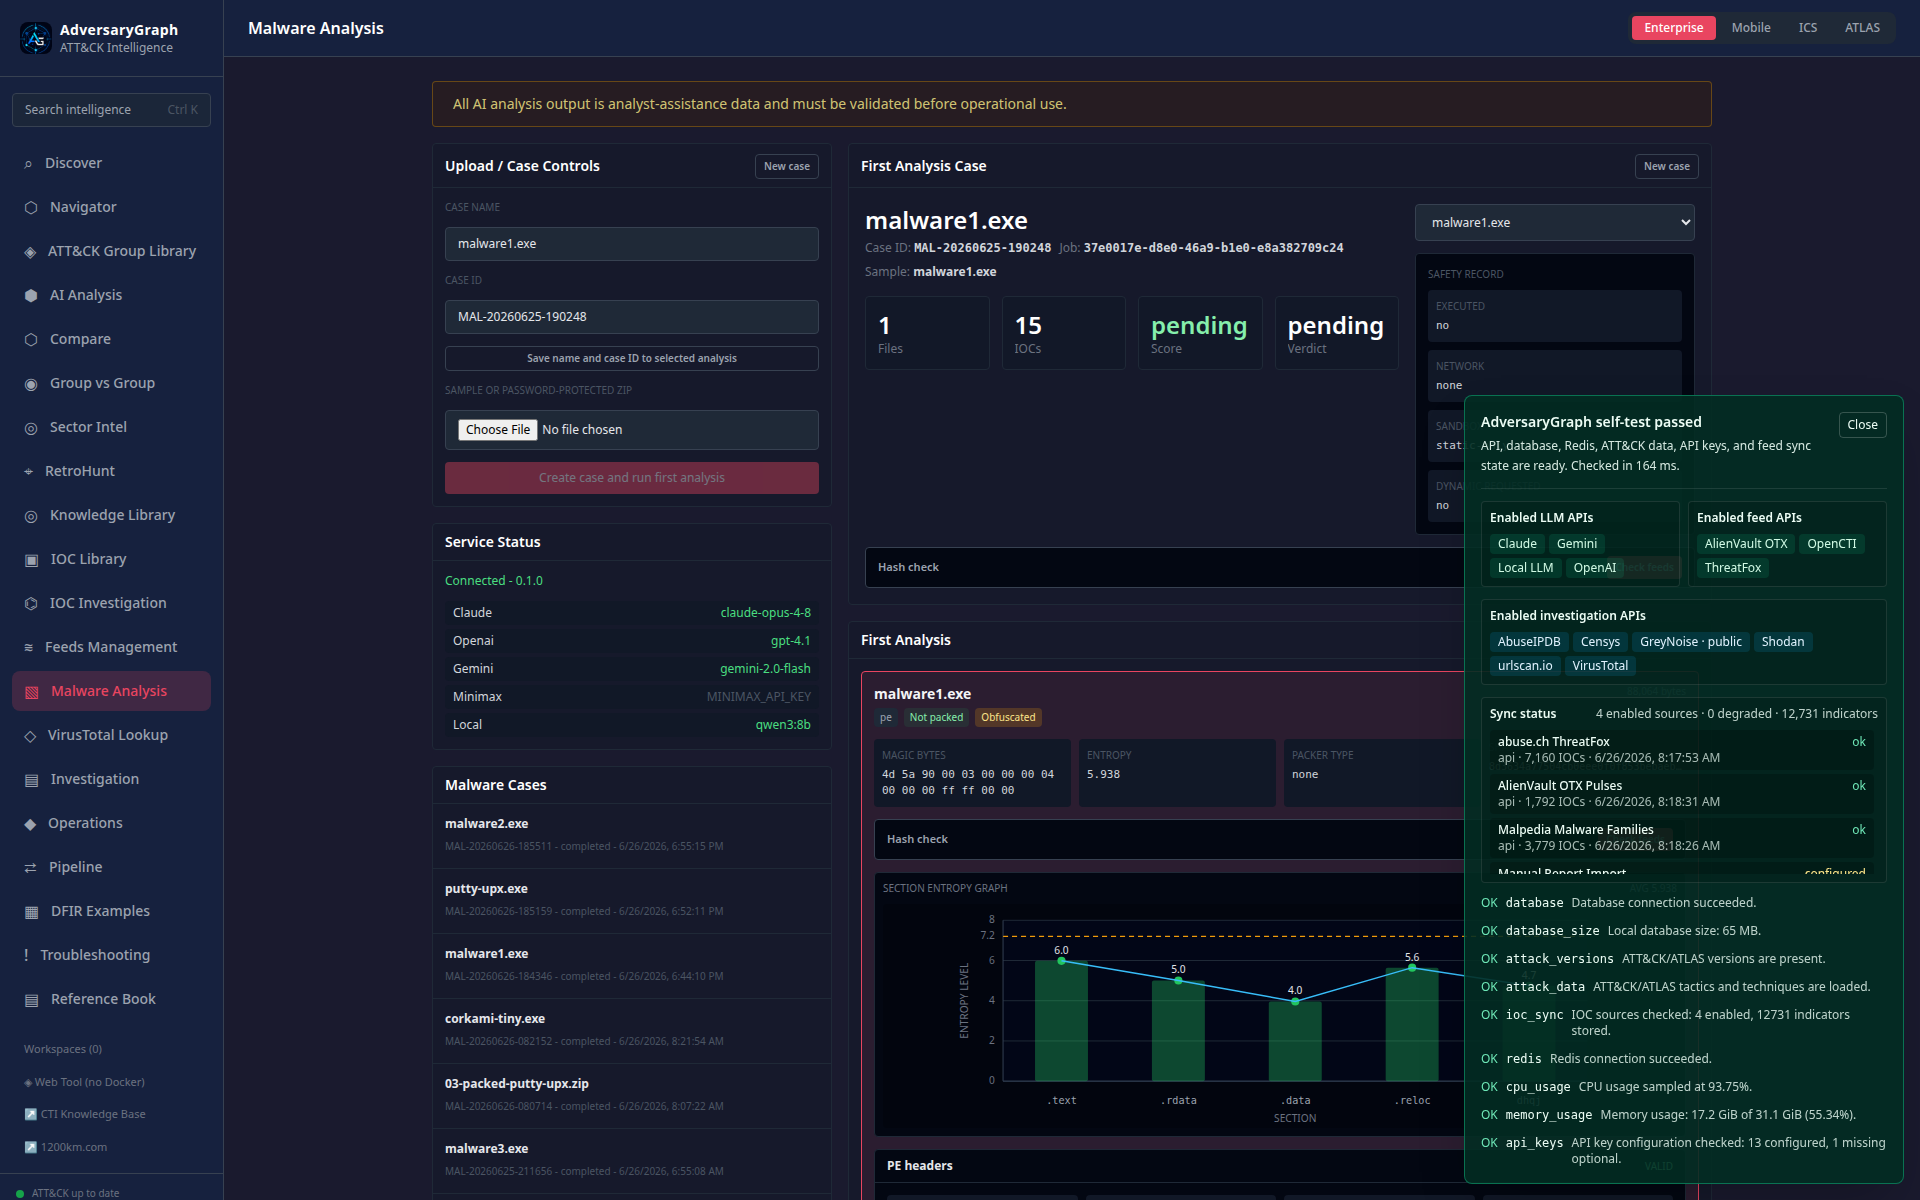
The dashboard shows upload/case controls, service status, case list, first analysis, hash check, safety record, and entropy visualization.
Hash Check And Feed Results
The hash-check result window shows reputation, detection counts, suspicious family names, local IOC records, and external feed summaries without cutting the content.
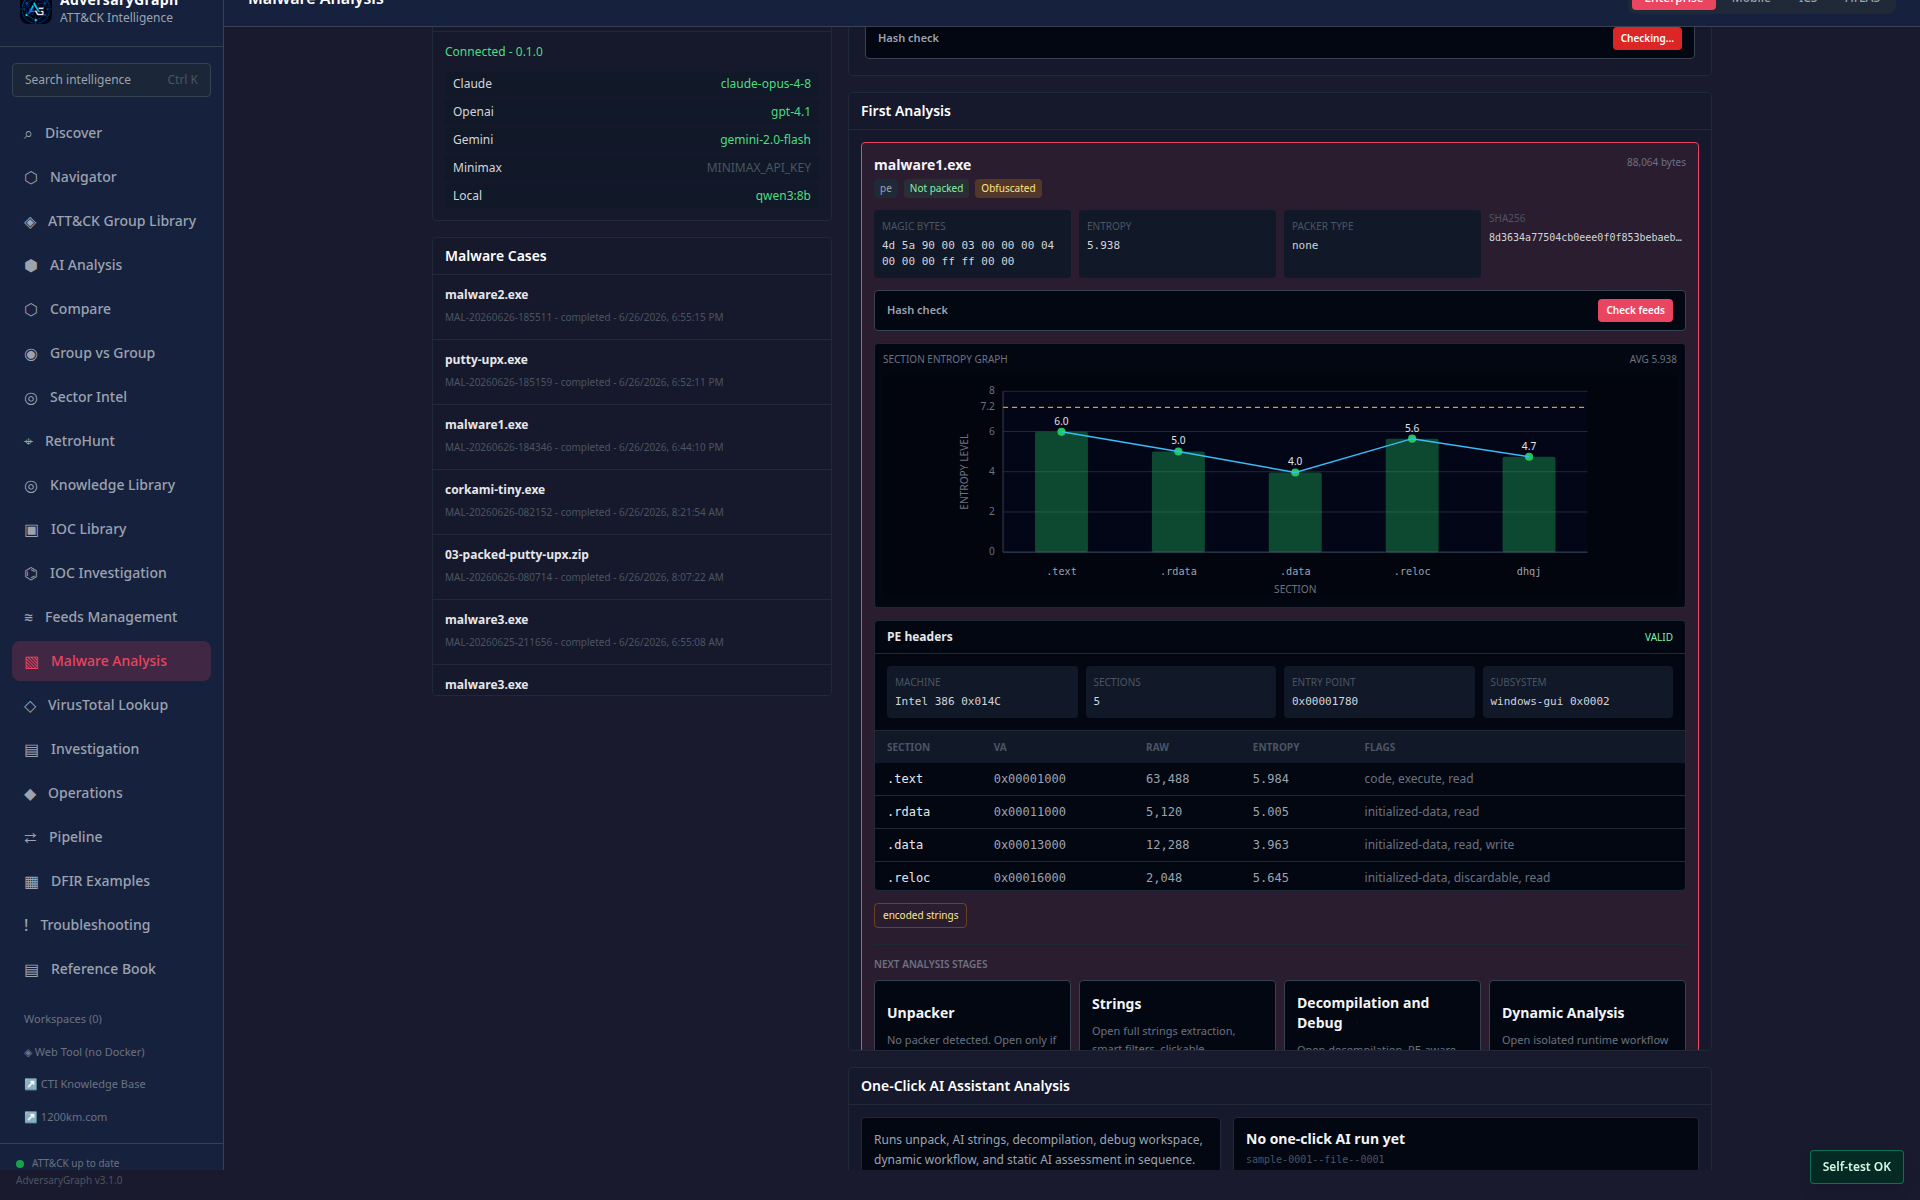
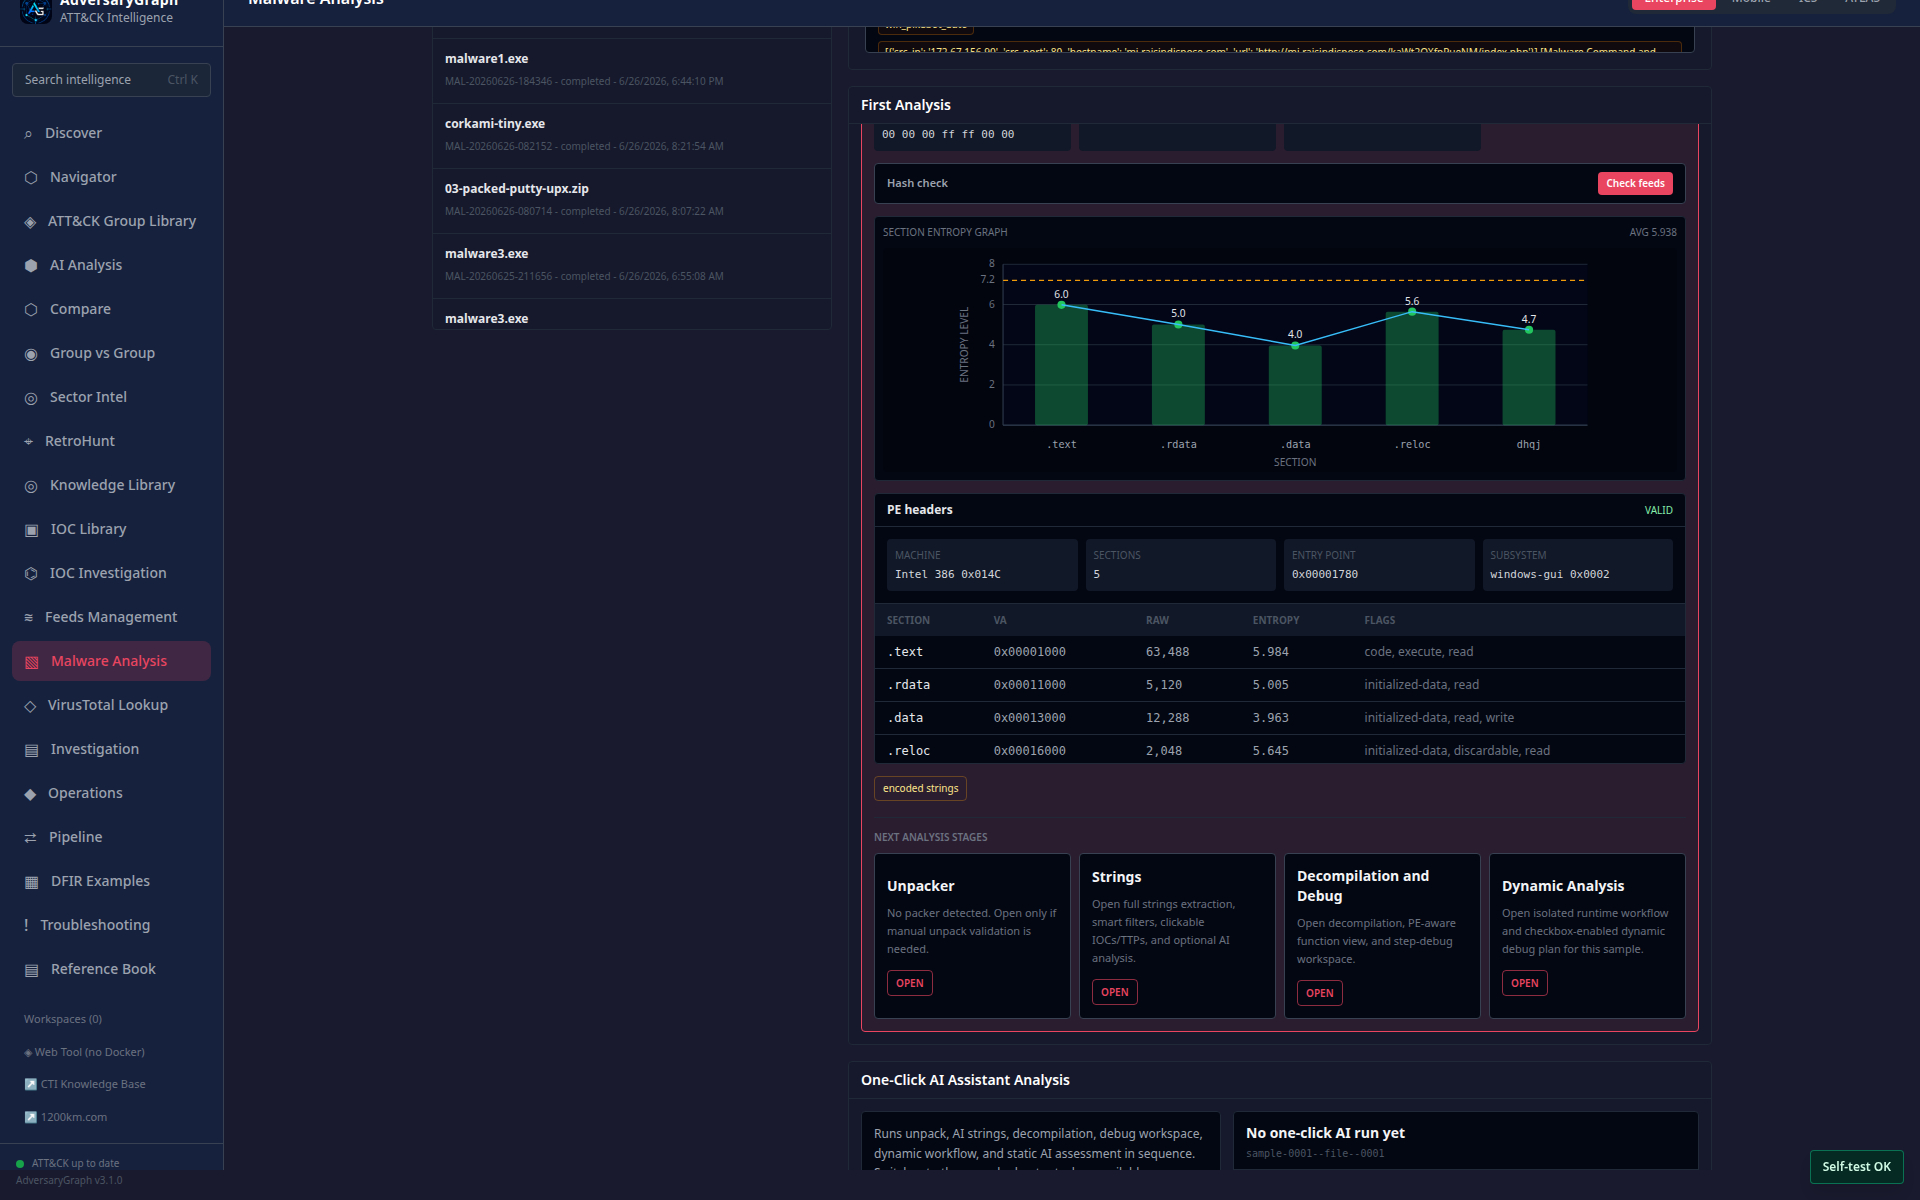
First Analysis Tools
The first-analysis card gives the analyst the next safe actions: strings, unpack, debug, report, hash check, and dynamic-analysis preparation.
Report, IOCs, And TTPs
The report section keeps extracted IOCs, ATT&CK tags, suspicious functions, notes, validation gaps, and analysis evidence together.
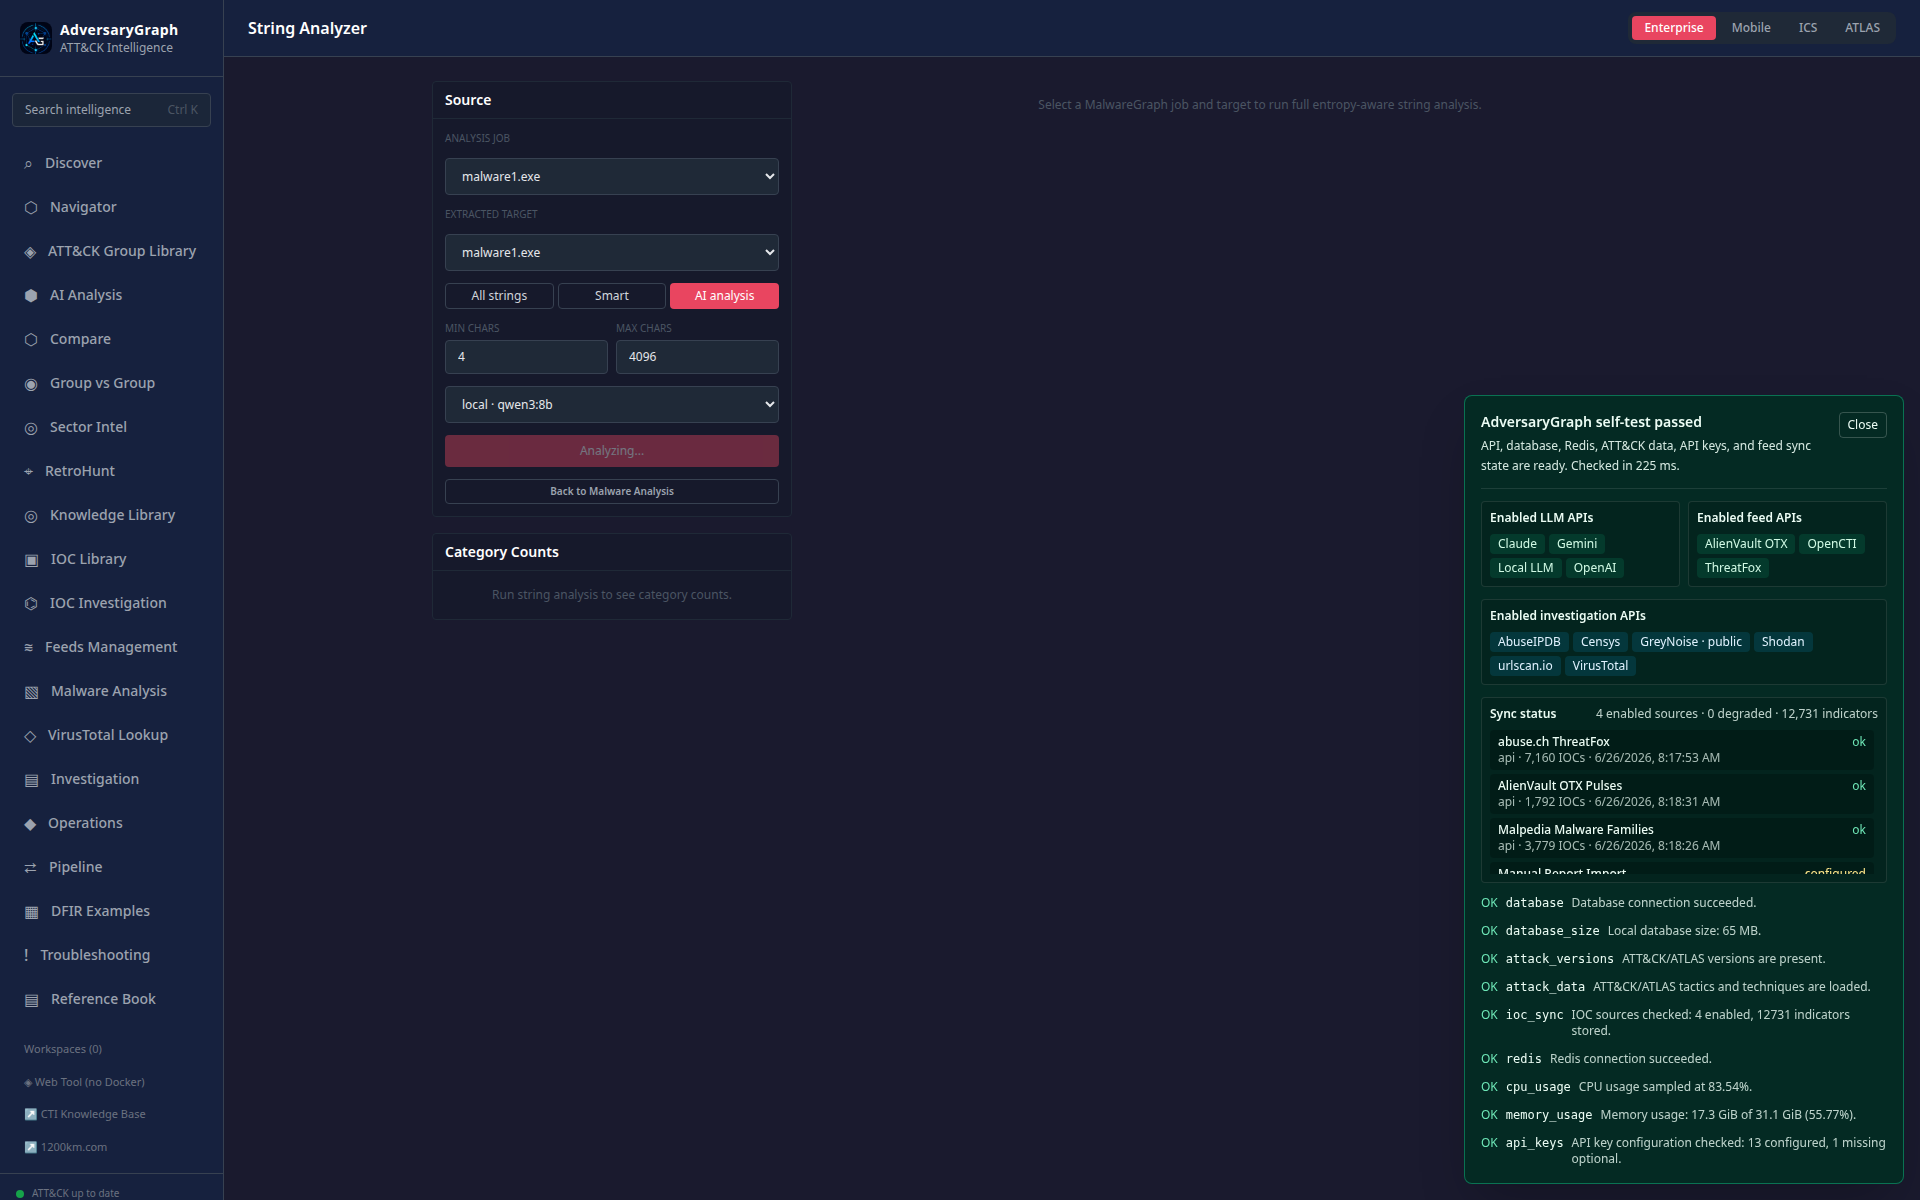
String Analyzer
All-string review is used for raw extraction, filtering, and category counts.
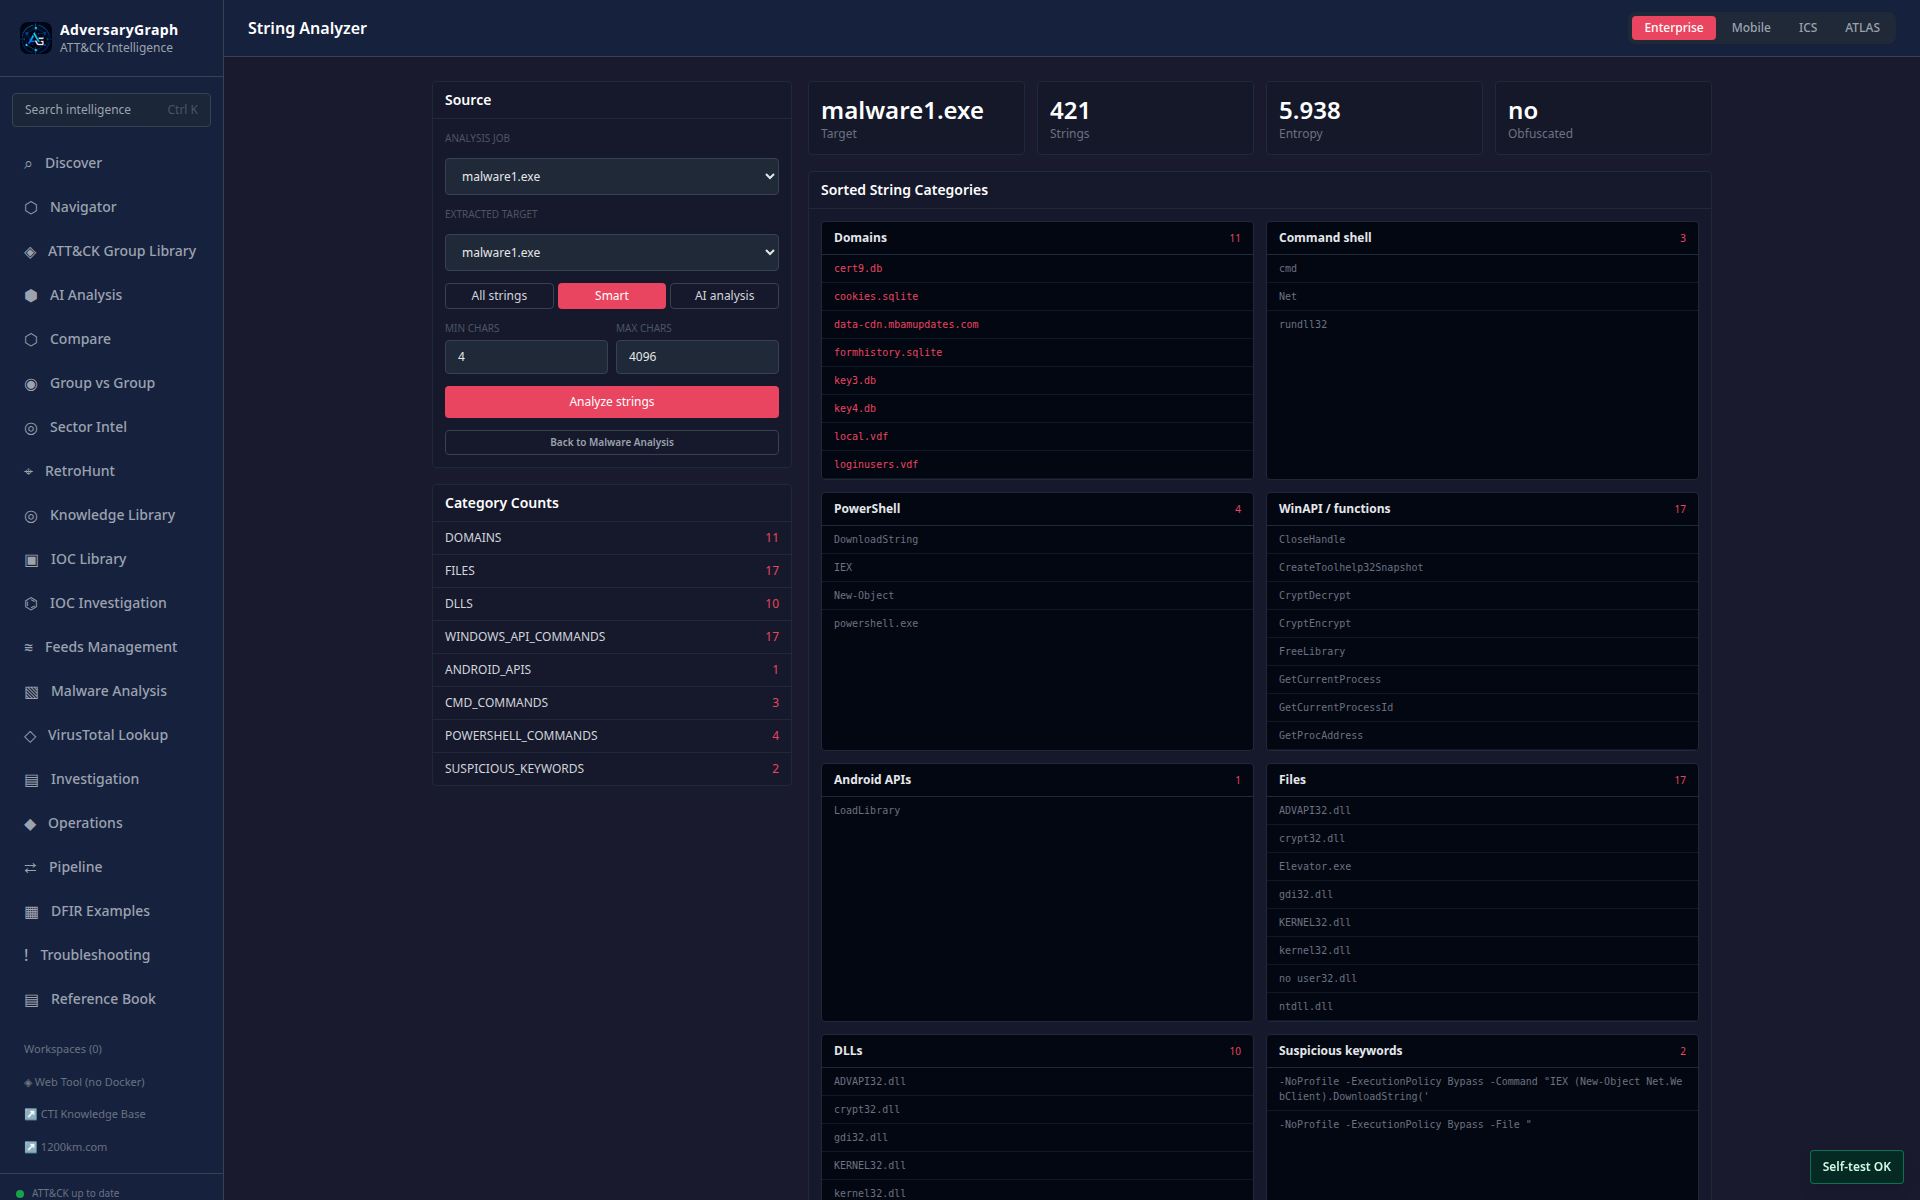
Smart mode groups likely IOCs, APIs, registry keys, commands, filenames, and ATT&CK leads for faster triage.
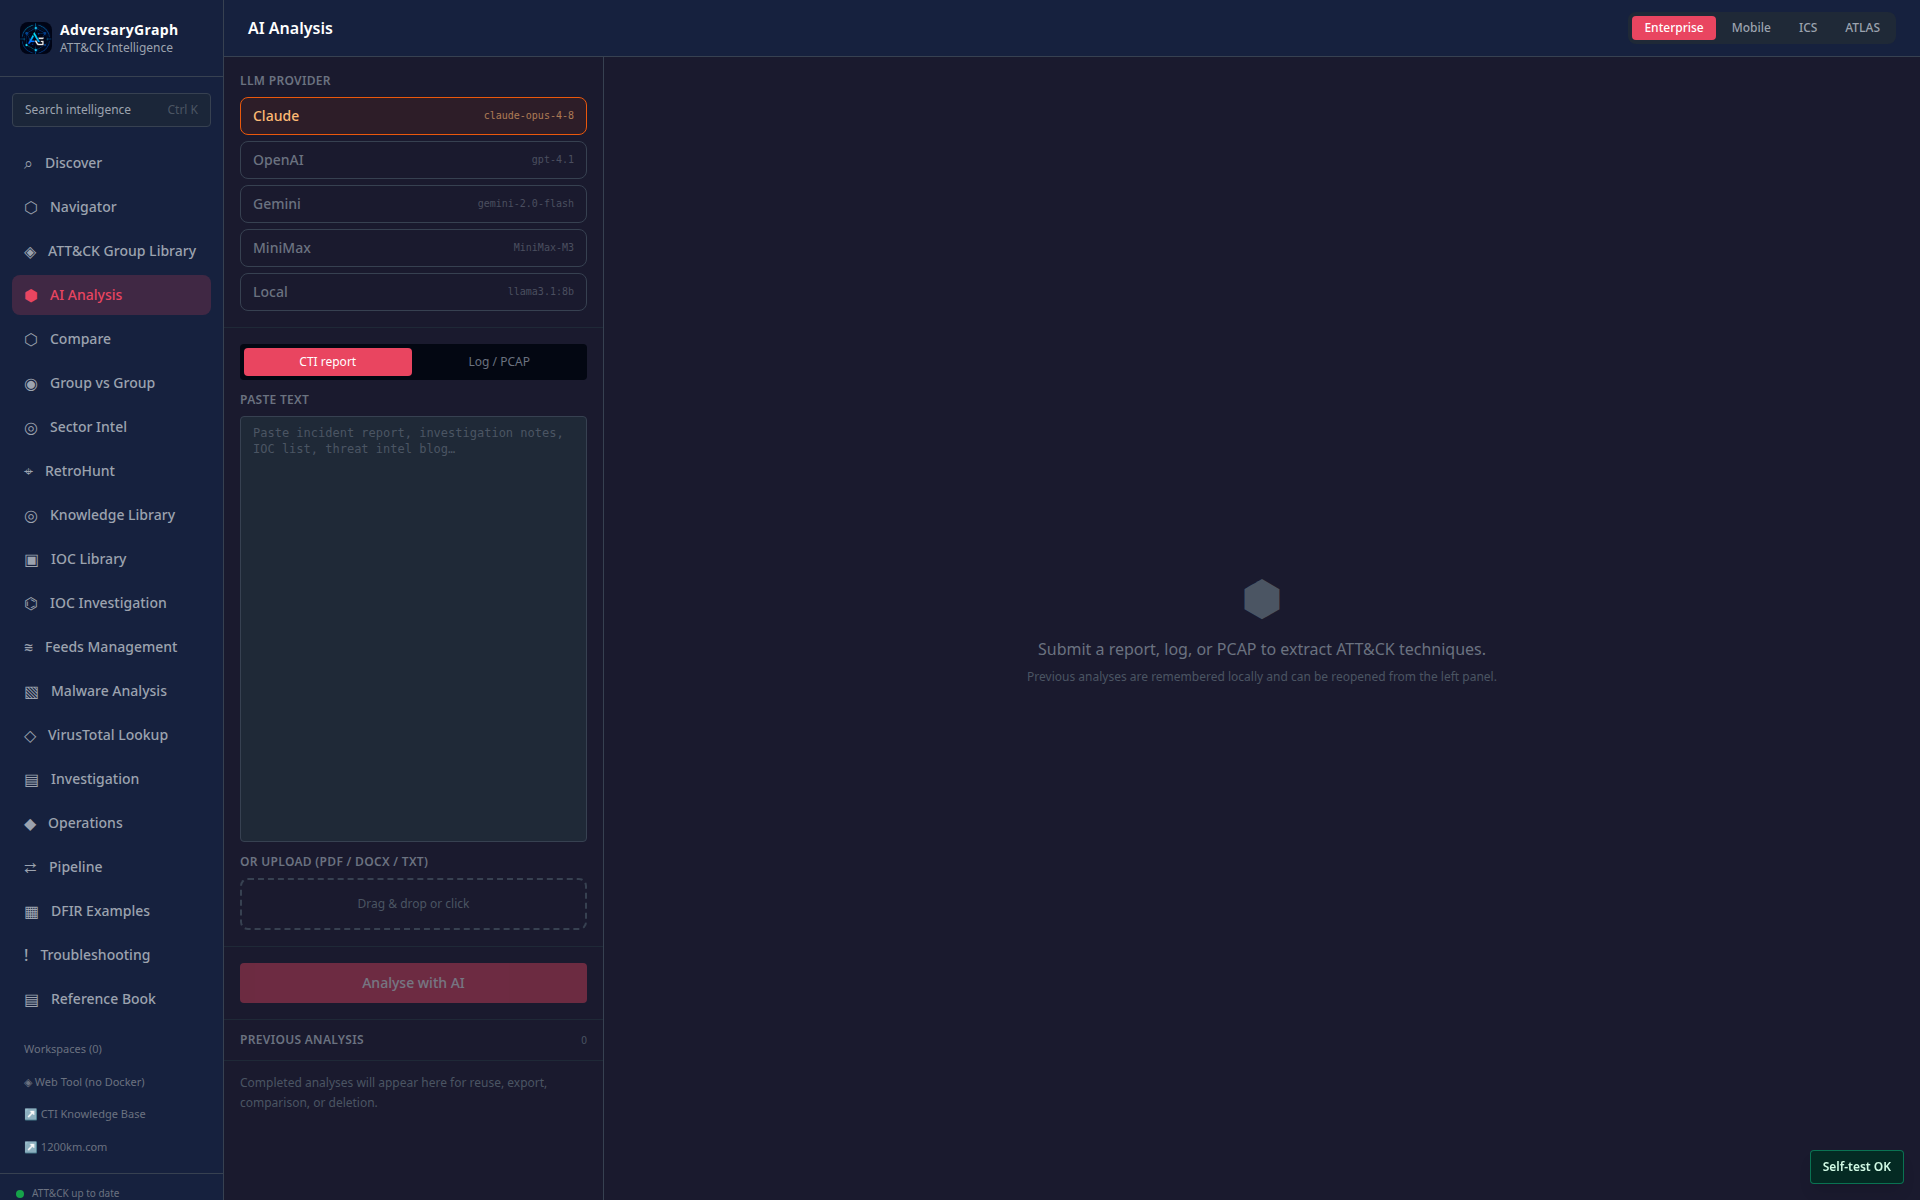
AI mode separates provider state and AI interpretation from the raw extracted strings.
Unpacker And Deobfuscation
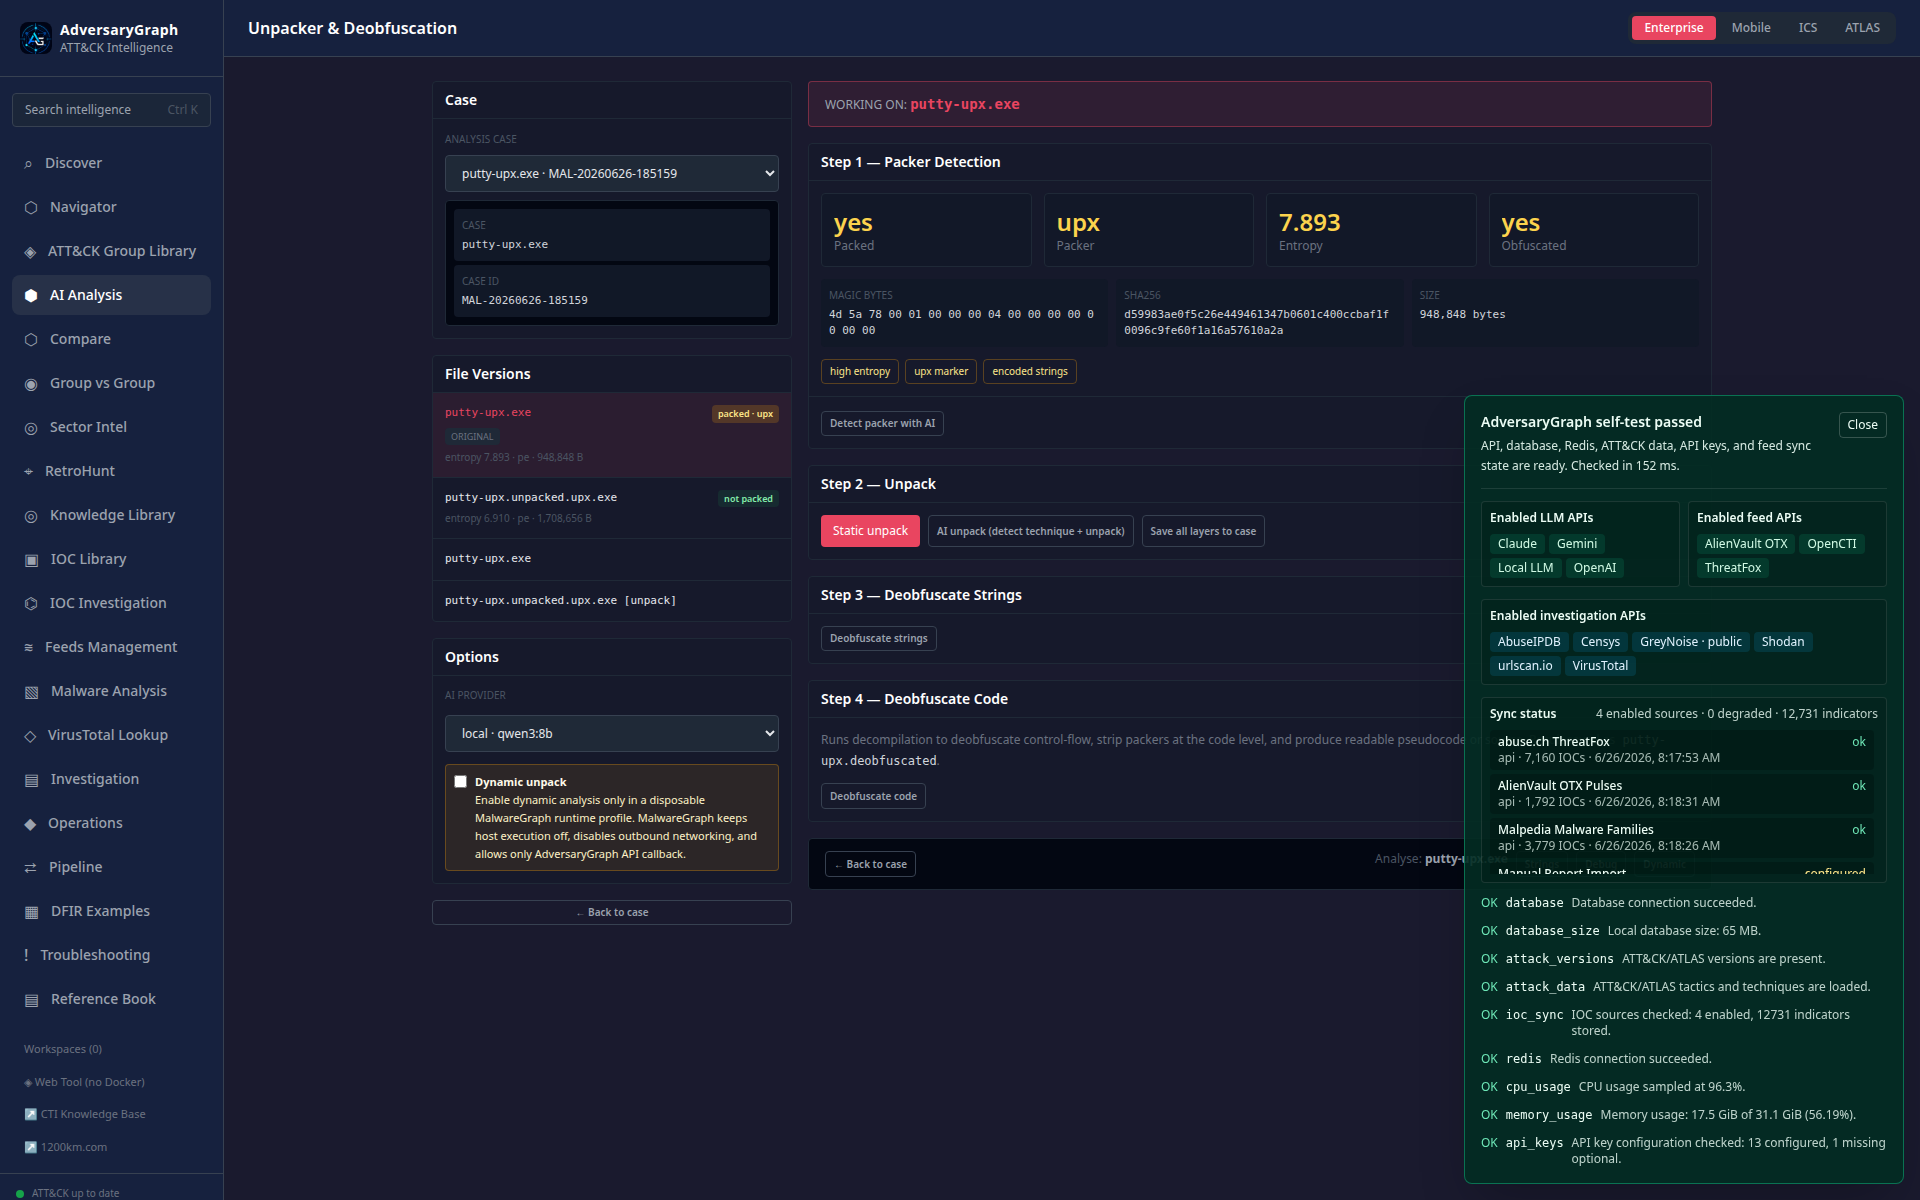
The unpacker shows packer detection, entropy, obfuscation flags, static unpack, AI unpack, file versions, and the dynamic-unpack gate.

Follow-on actions support string deobfuscation, code deobfuscation, and pivots back into strings, debug, and dynamic analysis.
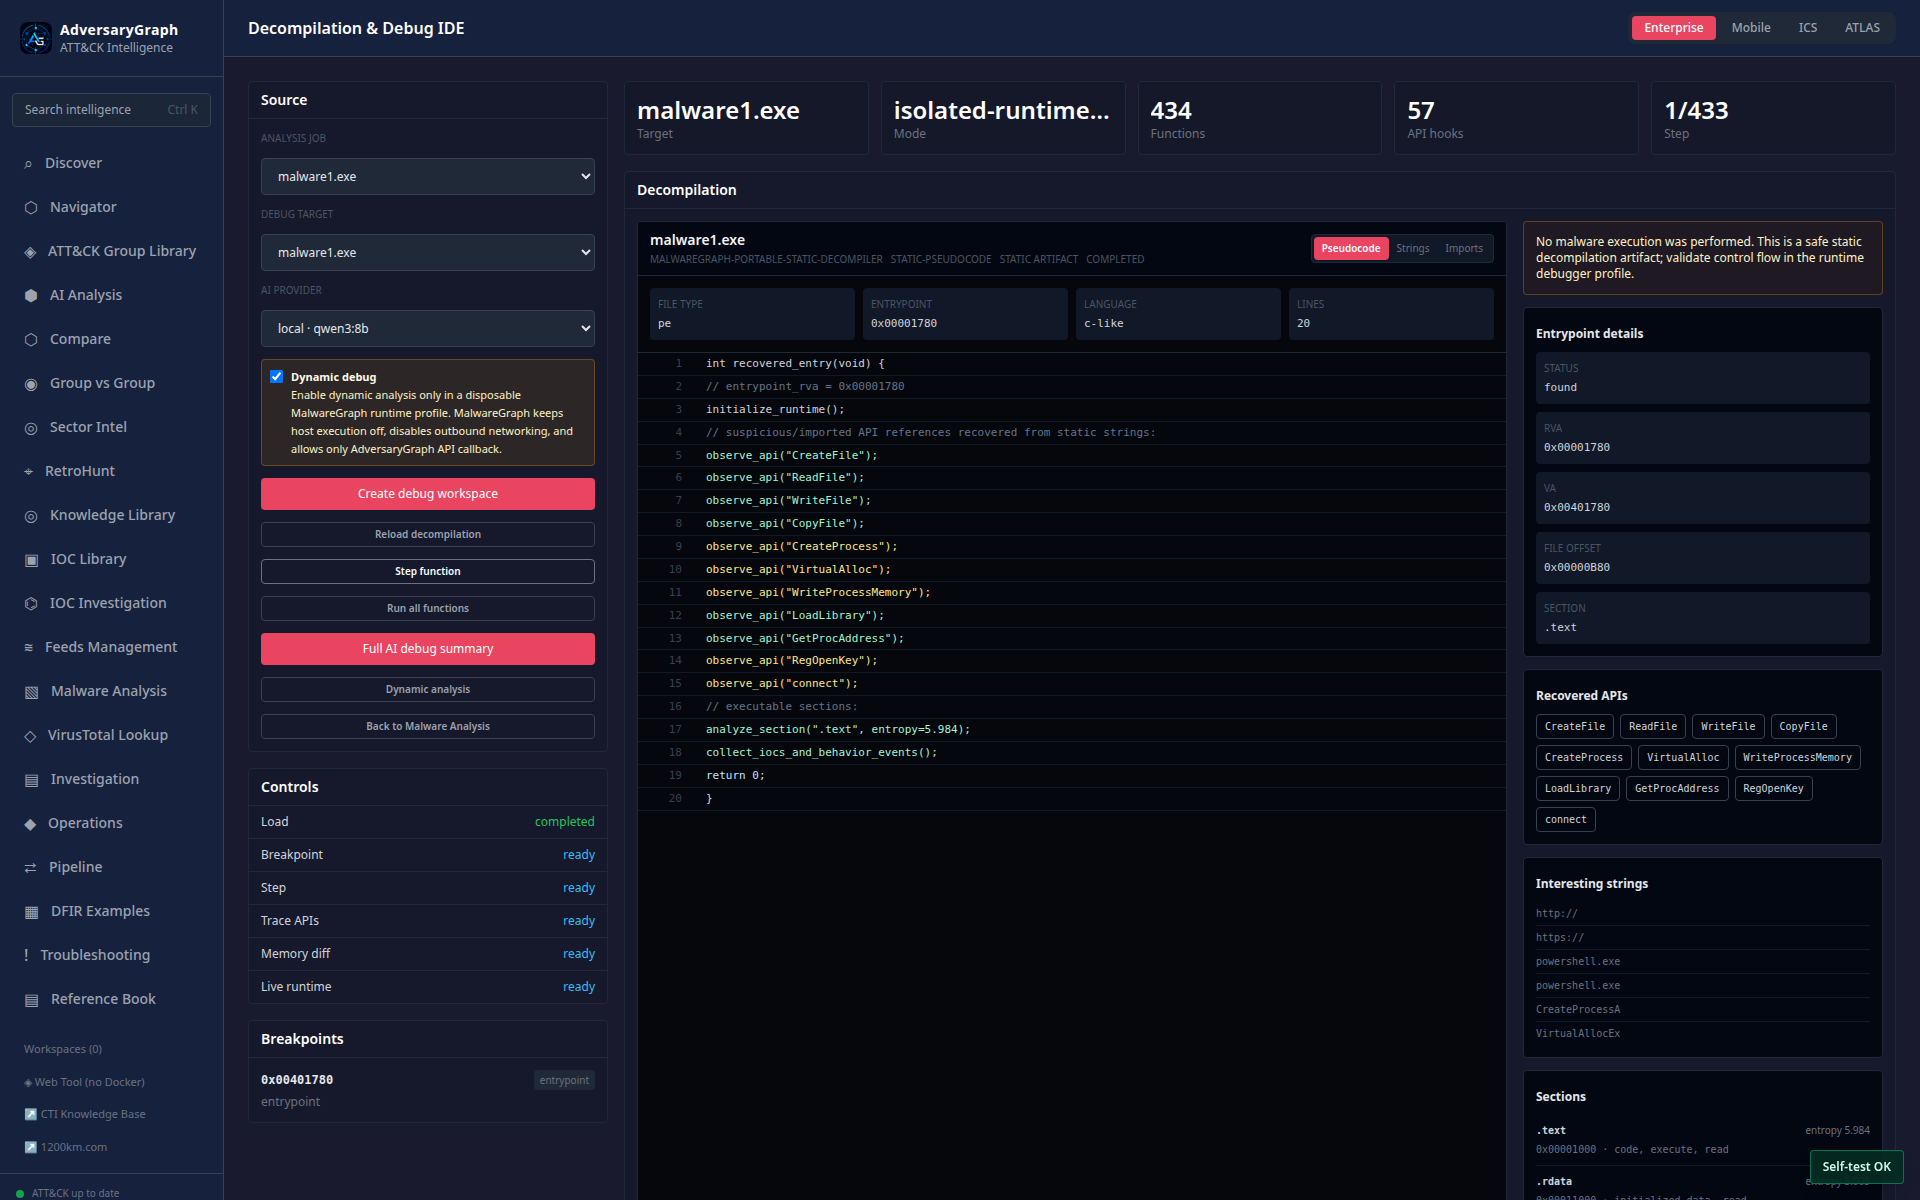
Decompilation And Debug IDE
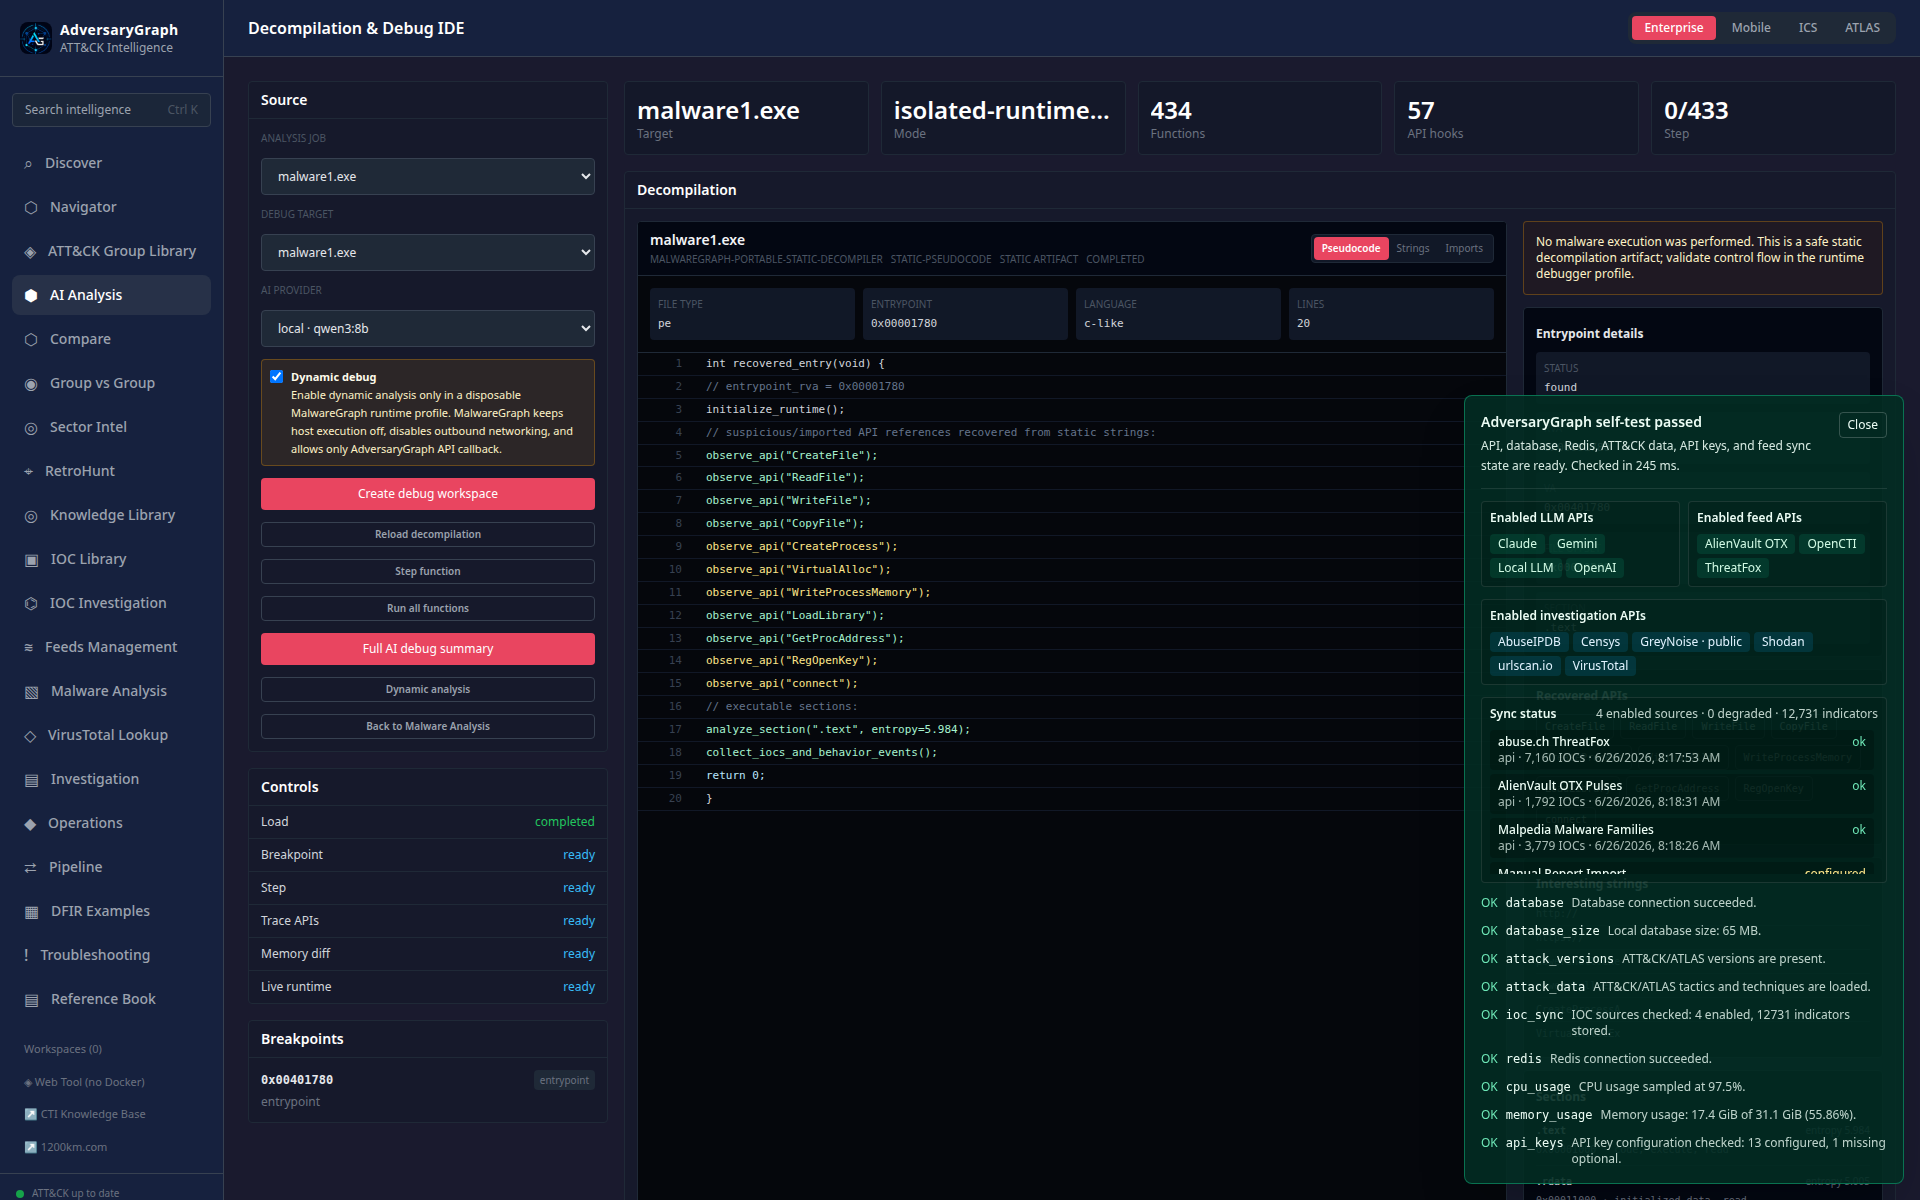
The IDE-style view shows pseudocode, recovered APIs, entrypoint metadata, controls, breakpoints, and the safety gate.
The workspace can advance through safe symbolic function steps and keep the result visible for analyst review.
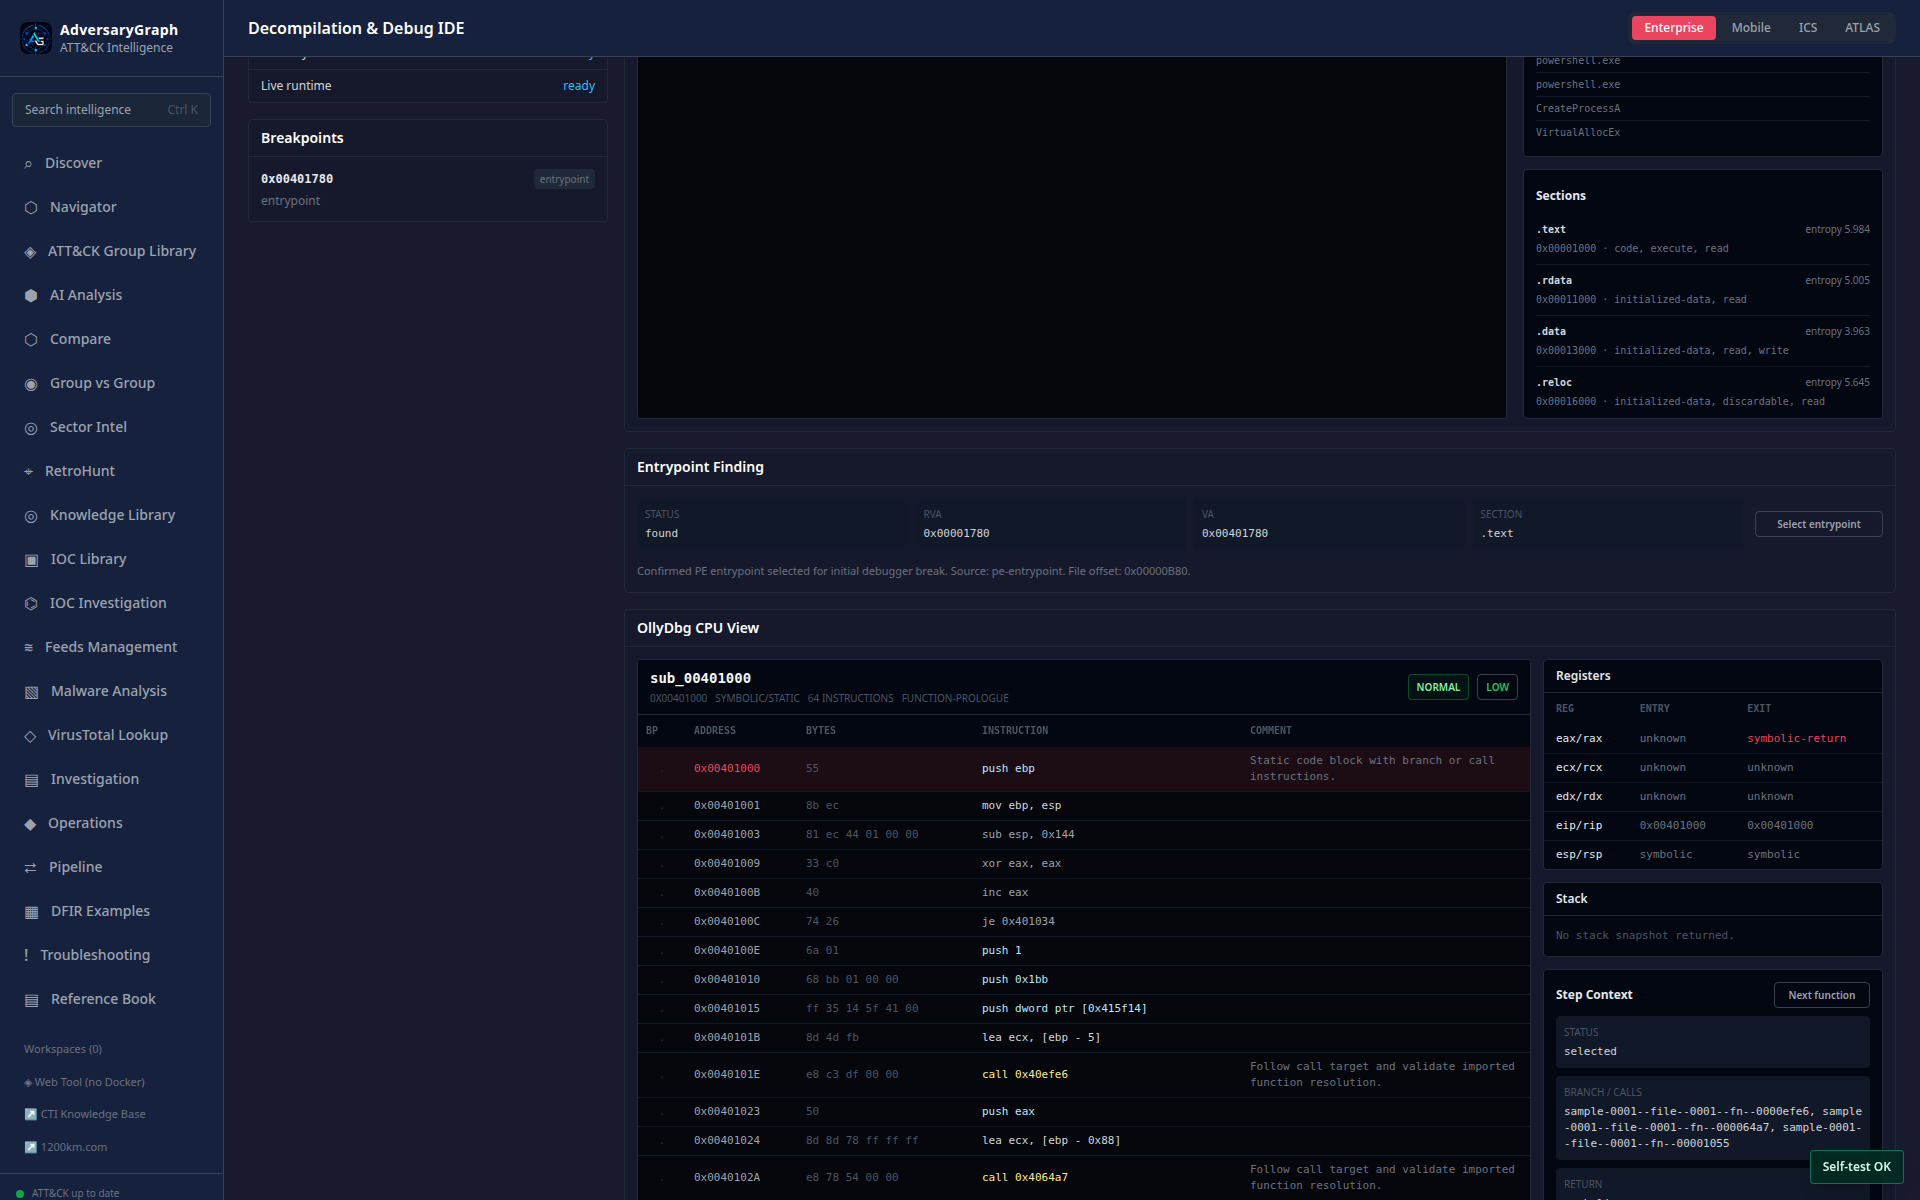
The CPU-style view keeps disassembly, registers, stack, API focus, memory context, and AI notes in one investigation surface.
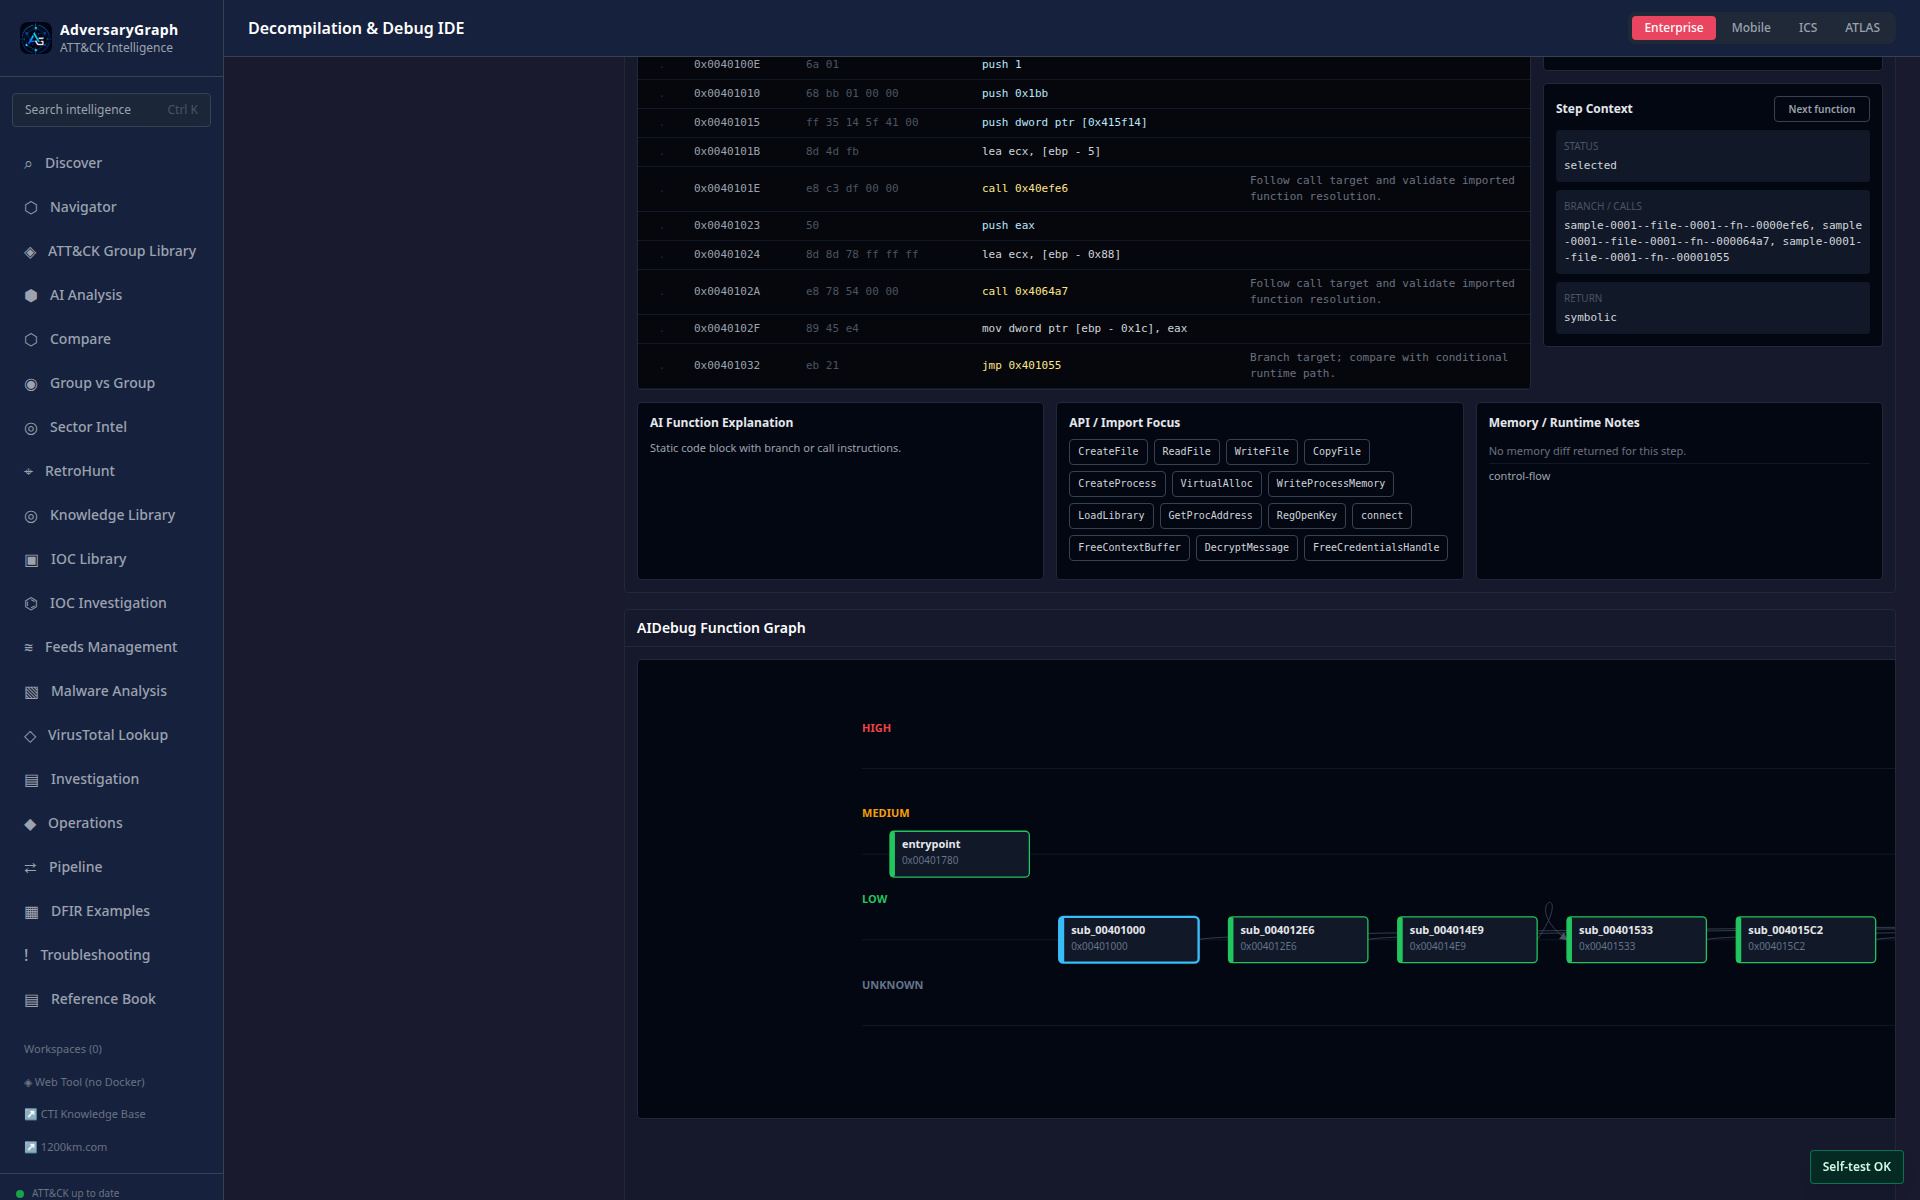
The function graph supports navigation through recovered code blocks and function-level AI explanations.
Dynamic Analysis
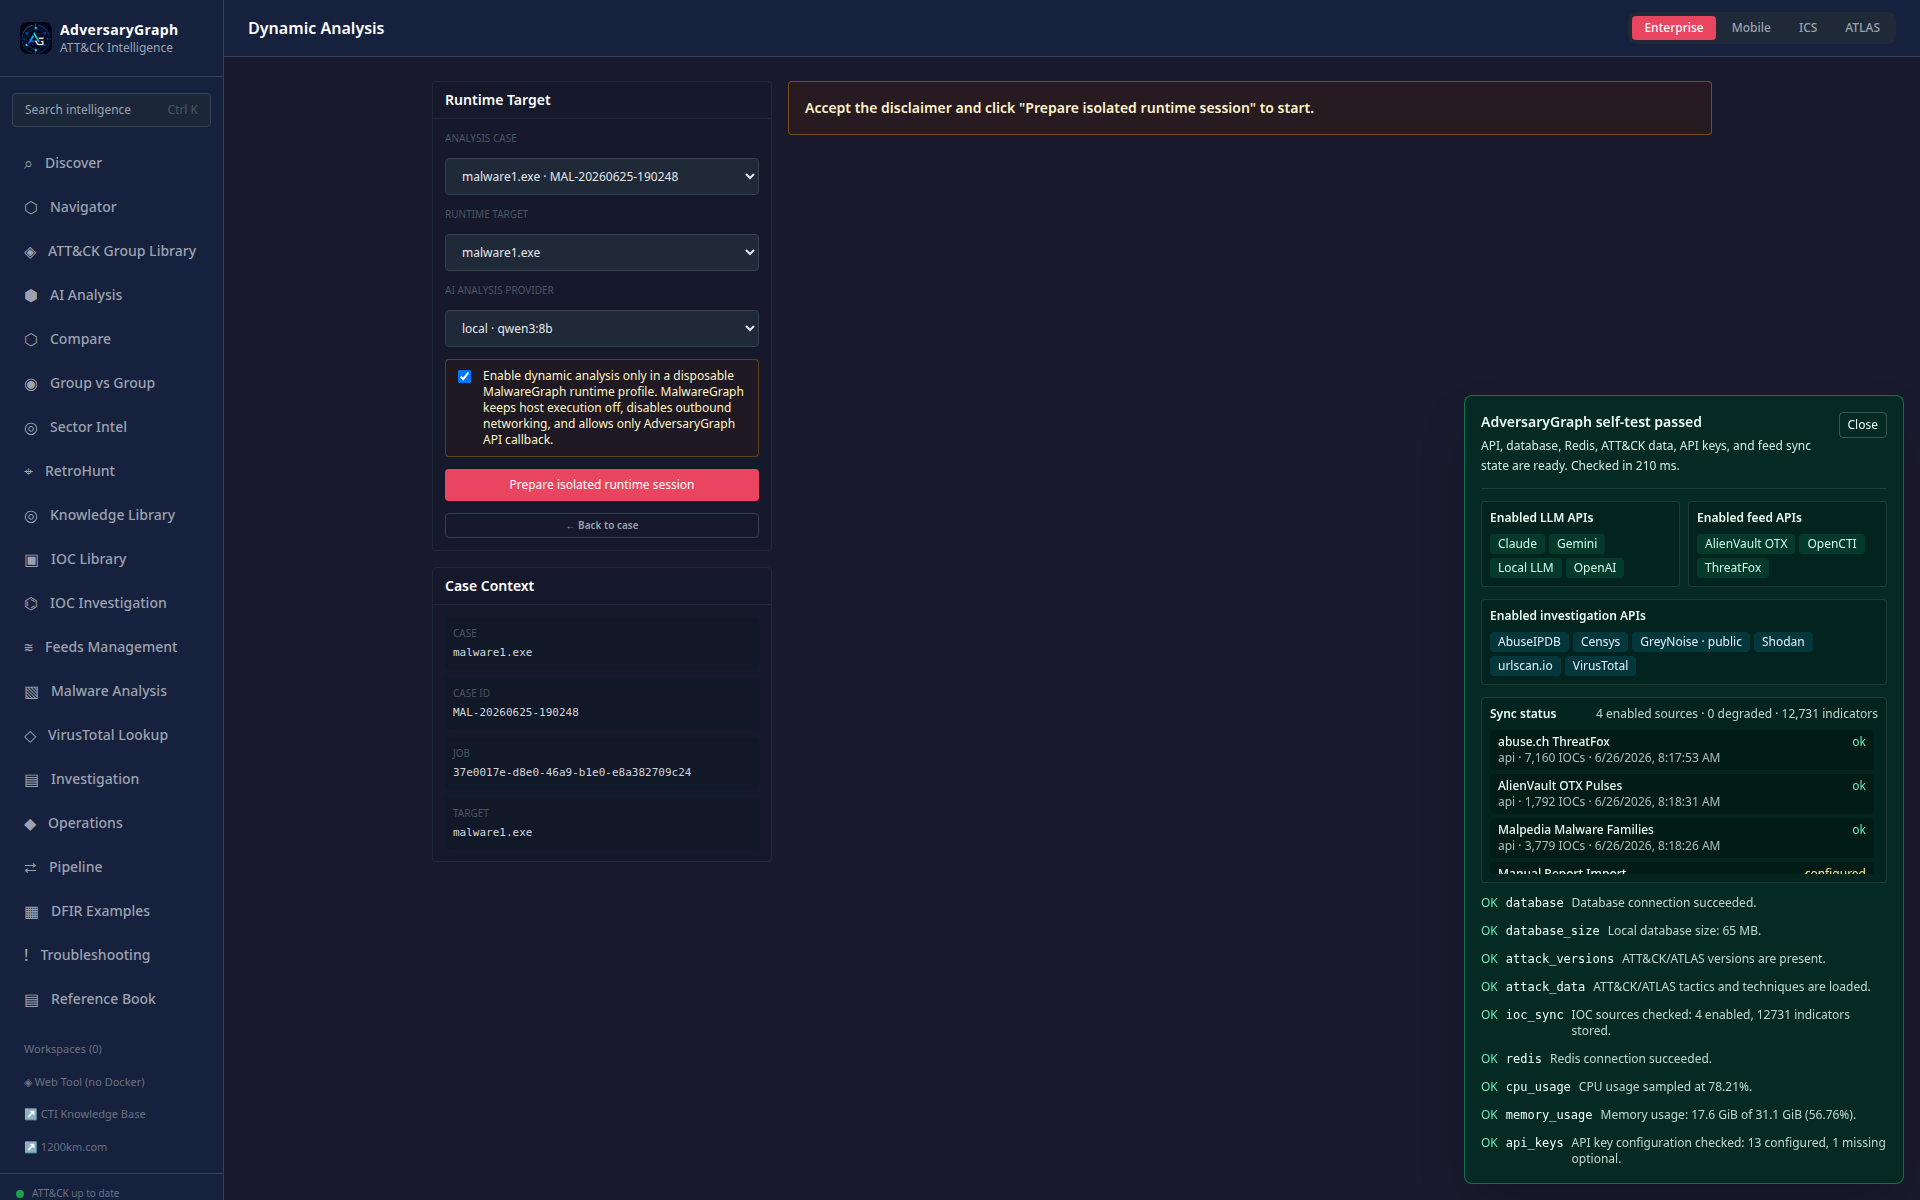
Dynamic analysis starts with a clear runtime target, AI provider selection, and explicit safety disclaimer.
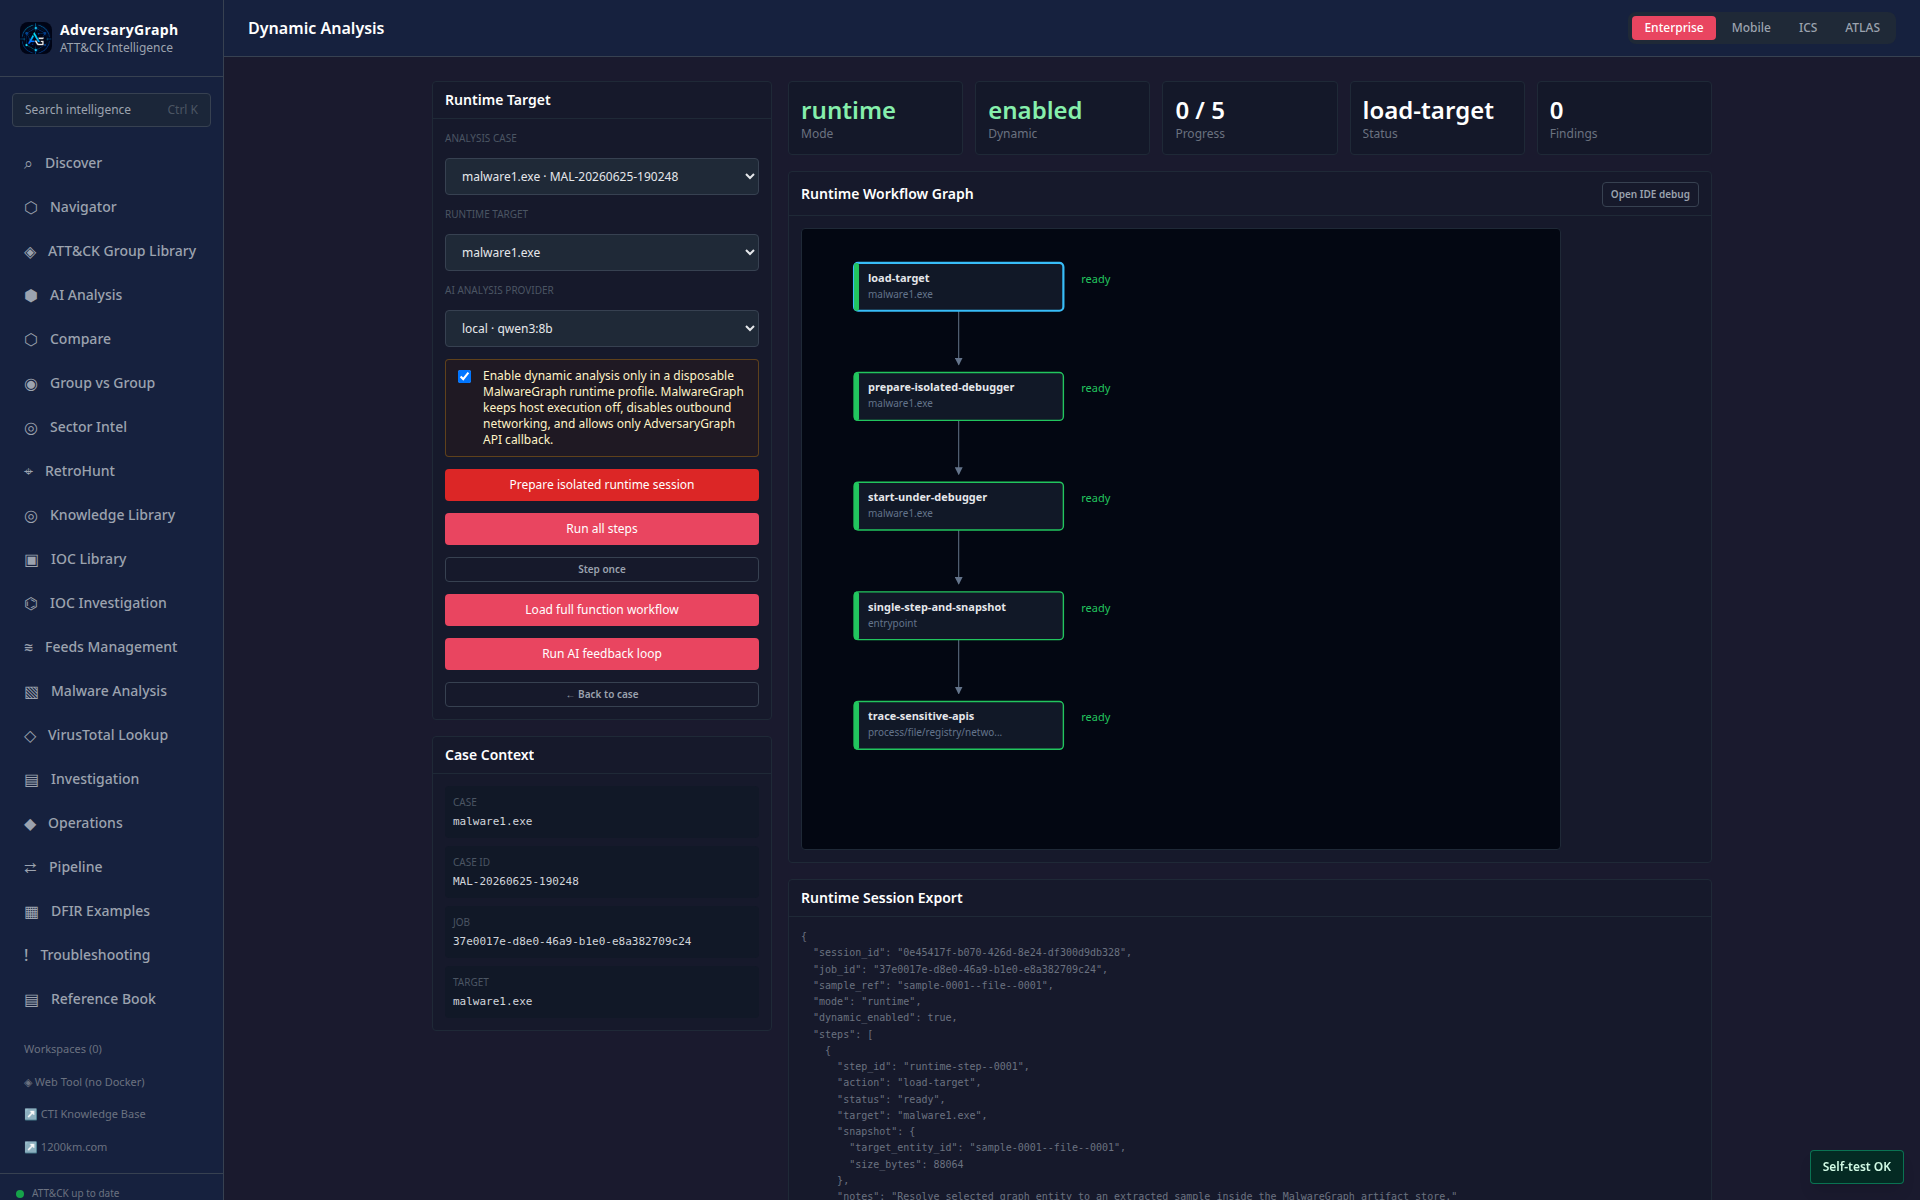
Prepared runtime sessions show profile state, controls, and behavior categories.
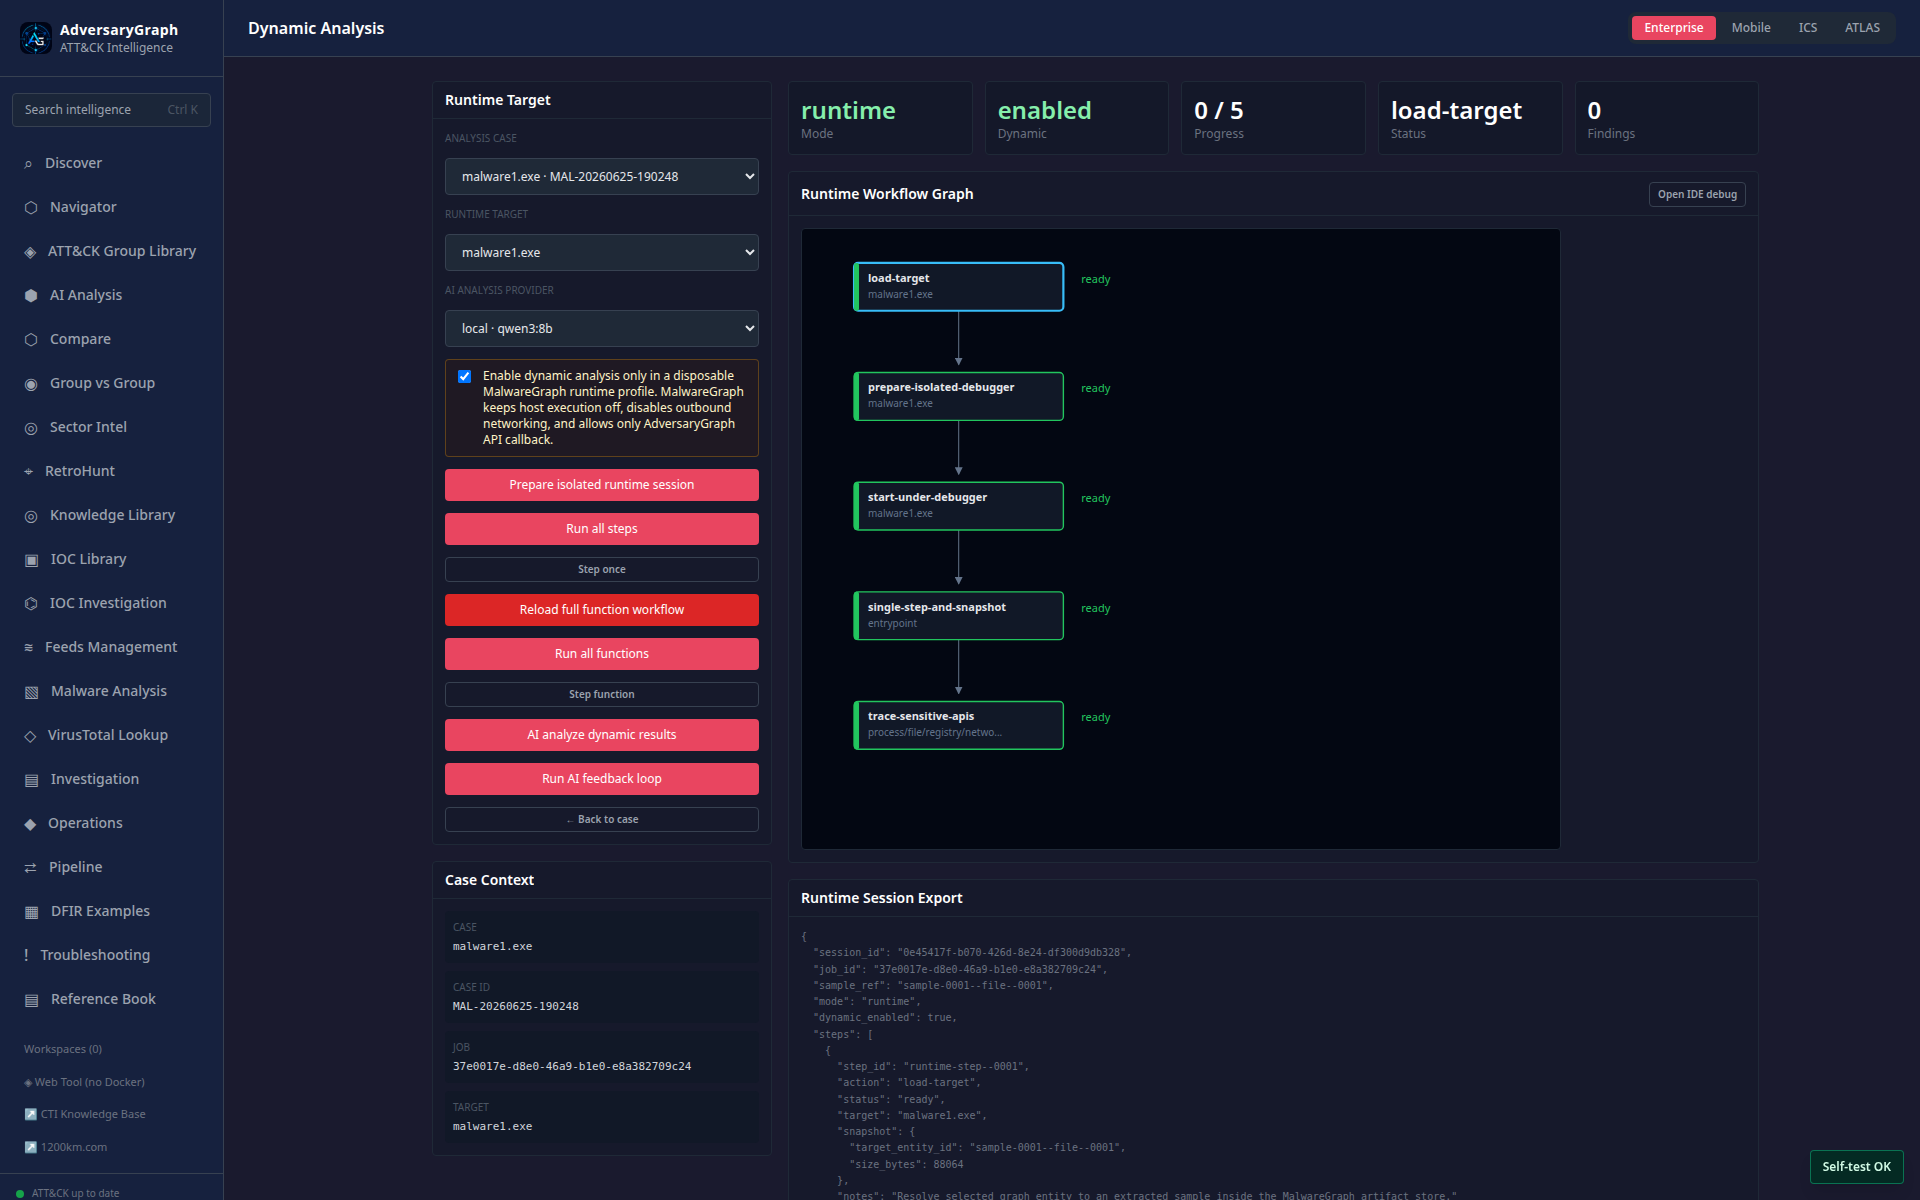
The function workflow supports step-by-step review, branch context, and AI feedback-loop summaries.
Dynamic Analysis Output Structure
Dynamic analysis summaries should be organized into clear evidence buckets:
- process creation
- command execution
- file writes, reads, and deletes
- registry changes
- network attempts
- DNS lookups
- API calls
- memory allocation and unpacking
- loaded modules
- injected code
- persistence attempts
- privilege, token, and service actions
- anti-debugging or anti-VM checks
- branch decisions that appear only under specific conditions
- dropped files and second-stage payload indicators
- C2 configuration and beaconing hints
- validation gaps and recommended next runtime checks
Each bucket should distinguish observed evidence from AI interpretation.
Analyst Validation Rules
- Treat every AI conclusion as a hypothesis until evidence confirms it.
- Keep static findings separate from dynamic findings.
- Do not claim malware behavior from strings alone.
- Do not treat actor similarity as attribution.
- Preserve hashes, sample names, source files, timestamps, and screenshots.
- Use dynamic analysis only inside a disposable isolated malware lab.