Observability, Security Scanning, And Validation Examples
AdversaryGraph includes operator-facing observability for the self-hosted platform. It is designed to help an administrator confirm API health, inspect request latency, review recent traces, tail redacted application logs, and export Prometheus-style metrics for an external monitoring stack.
The observability view is operational telemetry. It does not replace a SIEM, EDR, or production APM platform, and it does not prove that a detection worked. Use it to validate platform behavior and then confirm detection outcomes in the connected SIEM or telemetry backend.

Runtime Observability
| Area | What Is Available | Why It Matters |
|---|---|---|
| API health | /api/health plus authenticated observability summary | Confirms the API process and version are responding |
| Request metrics | Total requests, status families, top routes, average and maximum latency | Finds failed routes and slow API surfaces |
| Request traces | Recent method, path, status, duration, client host, and timestamp | Gives a compact view of what the UI or API clients are doing |
| Log tail | Redacted API log tail from the configured log file | Supports quick troubleshooting without entering the container |
| Prometheus output | /api/observability/metrics | Allows scrape-based external monitoring |
Observability endpoints are authenticated in normal deployments. Keep the dashboard limited to trusted operators because traces and log lines may reveal route names, request timing, and operational details.
What Is Logged
AdversaryGraph records operational events needed for troubleshooting and validation:
- request method, route, status family, and latency
- recent request trace metadata
- last observed backend error summary
- API log tail with common credential markers redacted
- platform health and self-test results through existing system routes
The observability layer is intentionally not a long-term evidence store. For long retention, forward platform logs to a dedicated log backend and forward attack-simulation telemetry to the approved SIEM collector.
Security Scanning
The repository validation flow now covers application code, dependencies, secrets, and containers.
| Check | Local Command / CI Job | Purpose |
|---|---|---|
| Python lint | ruff check . | Finds Python correctness and style issues |
| Backend SAST | Bandit in CI and make security-scan | Flags risky Python patterns such as weak hashes, unsafe parsing, and command execution |
| Python dependency audit | pip-audit -r requirements.txt | Checks Python dependencies for known vulnerabilities |
| Frontend dependency audit | npm audit --audit-level=high | Checks frontend packages for high severity vulnerabilities |
| Secret scan | Gitleaks in CI and local scan when installed | Finds committed tokens, passwords, and private keys |
| Docker configuration | docker compose config --quiet | Validates Compose syntax before deployment |
| Container scan | Trivy in CI and local scan when installed | Checks built images for known OS/package vulnerabilities |
Latest local validation snapshot:
- Backend route tests passed.
- Frontend production build passed.
- Ruff passed.
- Bandit passed for medium/high confidence checks.
pip-auditreported no known Python dependency vulnerabilities.npm audit --audit-level=highreported no frontend vulnerabilities.- Docker Compose config validation passed.
- Local Gitleaks and Trivy execution depends on the tools being installed; CI runs those checks.
Case Studies And Validation Examples
Use these examples to prove the platform workflow, not to claim that a production environment is covered.
Attack Simulation To SIEM
- Choose a supported ATT&CK technique in Attack Simulation.
- Run a lab-backed simulation or an AI-generated source-shaped telemetry challenge.
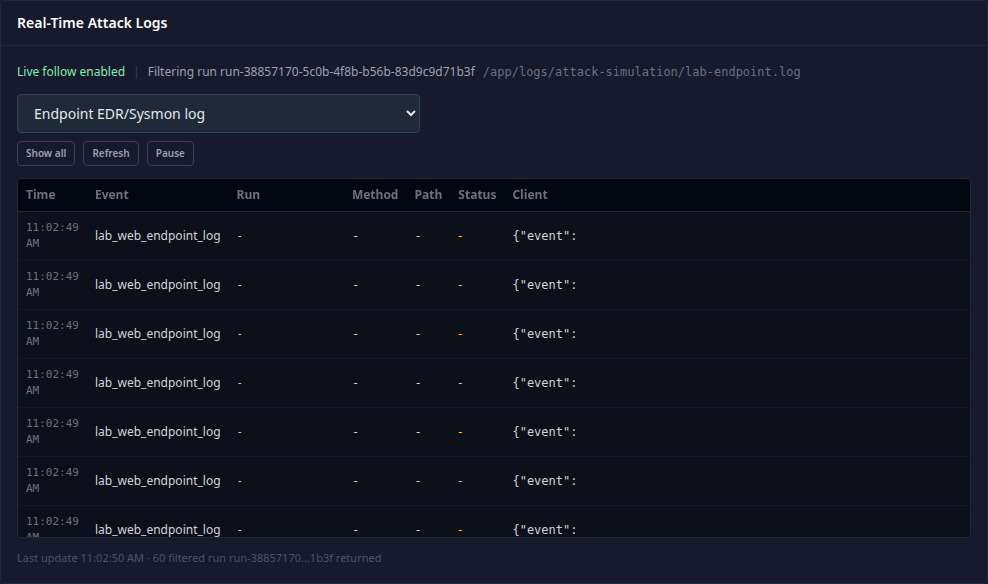
- Inspect real-time logs in AdversaryGraph.
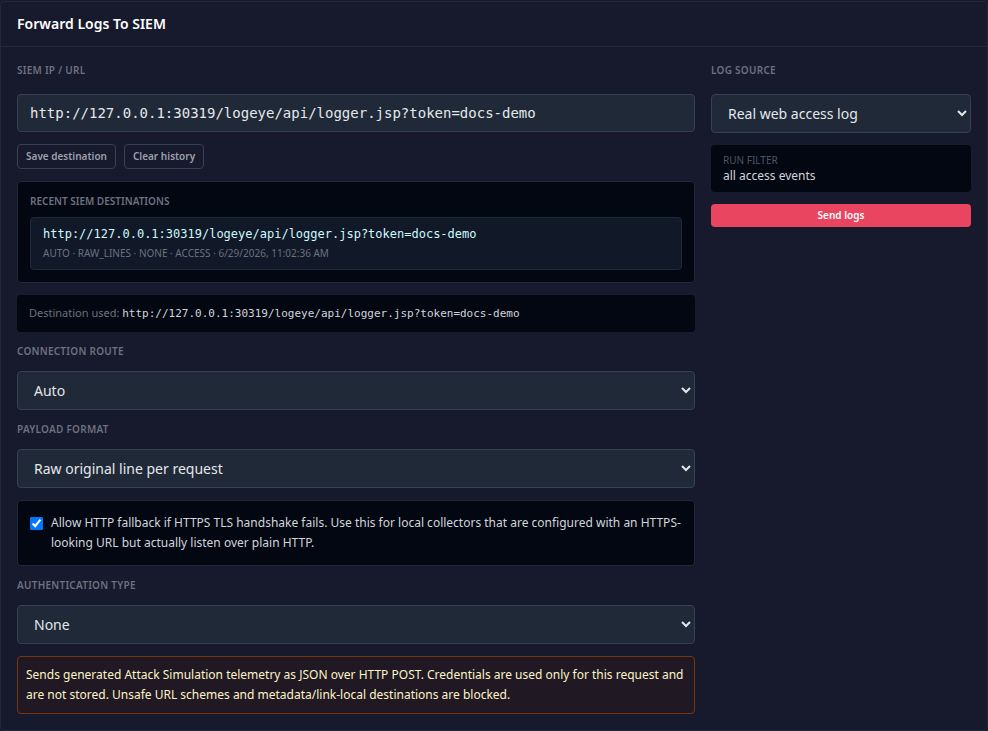
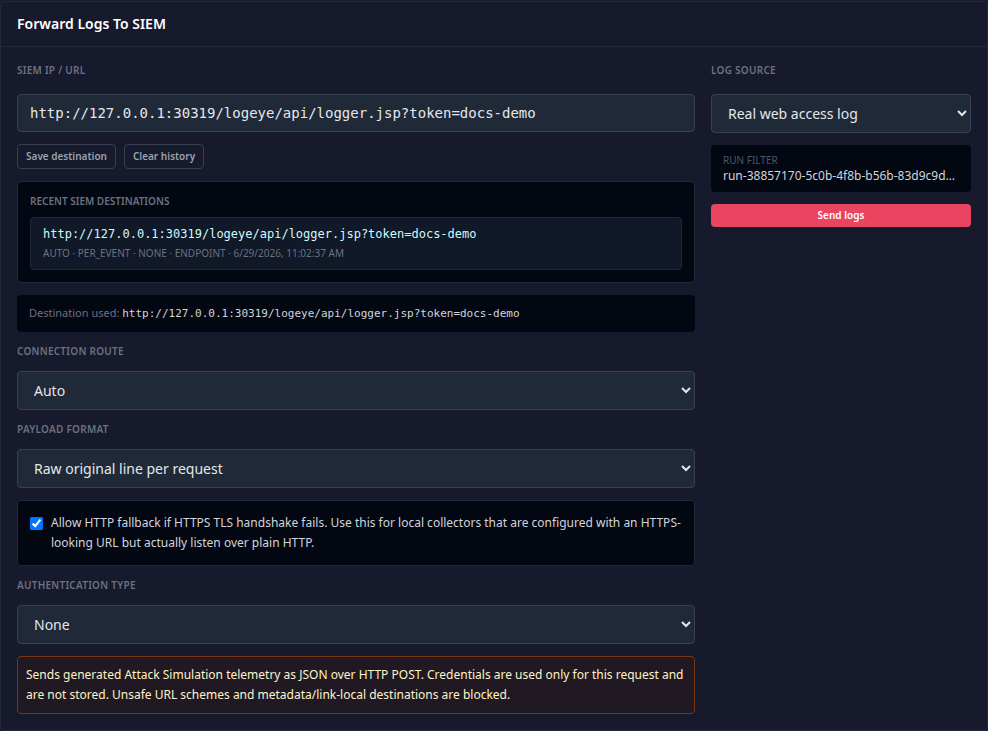
- Forward the selected event stream to the approved SIEM collector.
- Confirm parser, field mapping, rule hit, and alert context in the SIEM.
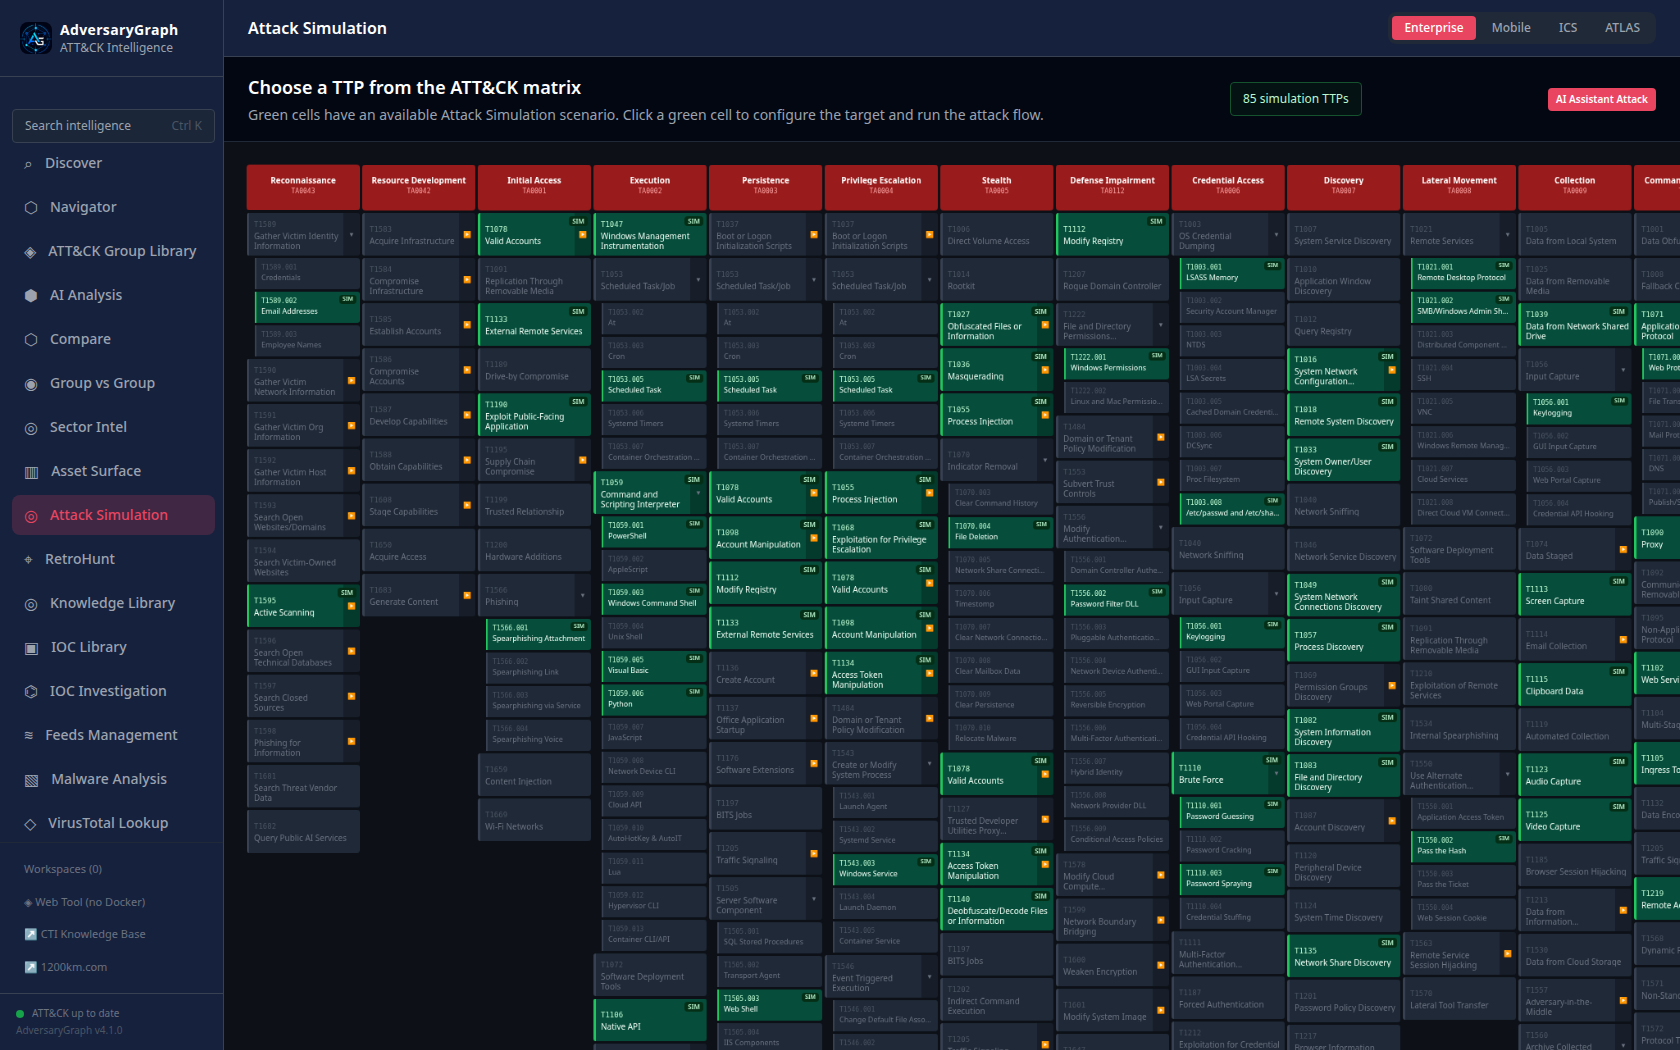
Relevant guide: Attack Simulation.
CVE To APT / TTP / IOC Correlation
- Sync NVD and CISA KEV records.
- Review CVSS, CWE, CPE, KEV status, and source metadata.
- Inspect strict CVE relationship evidence to actors, techniques, and indicators.
- Treat the relationship as an evidence link, not attribution proof.
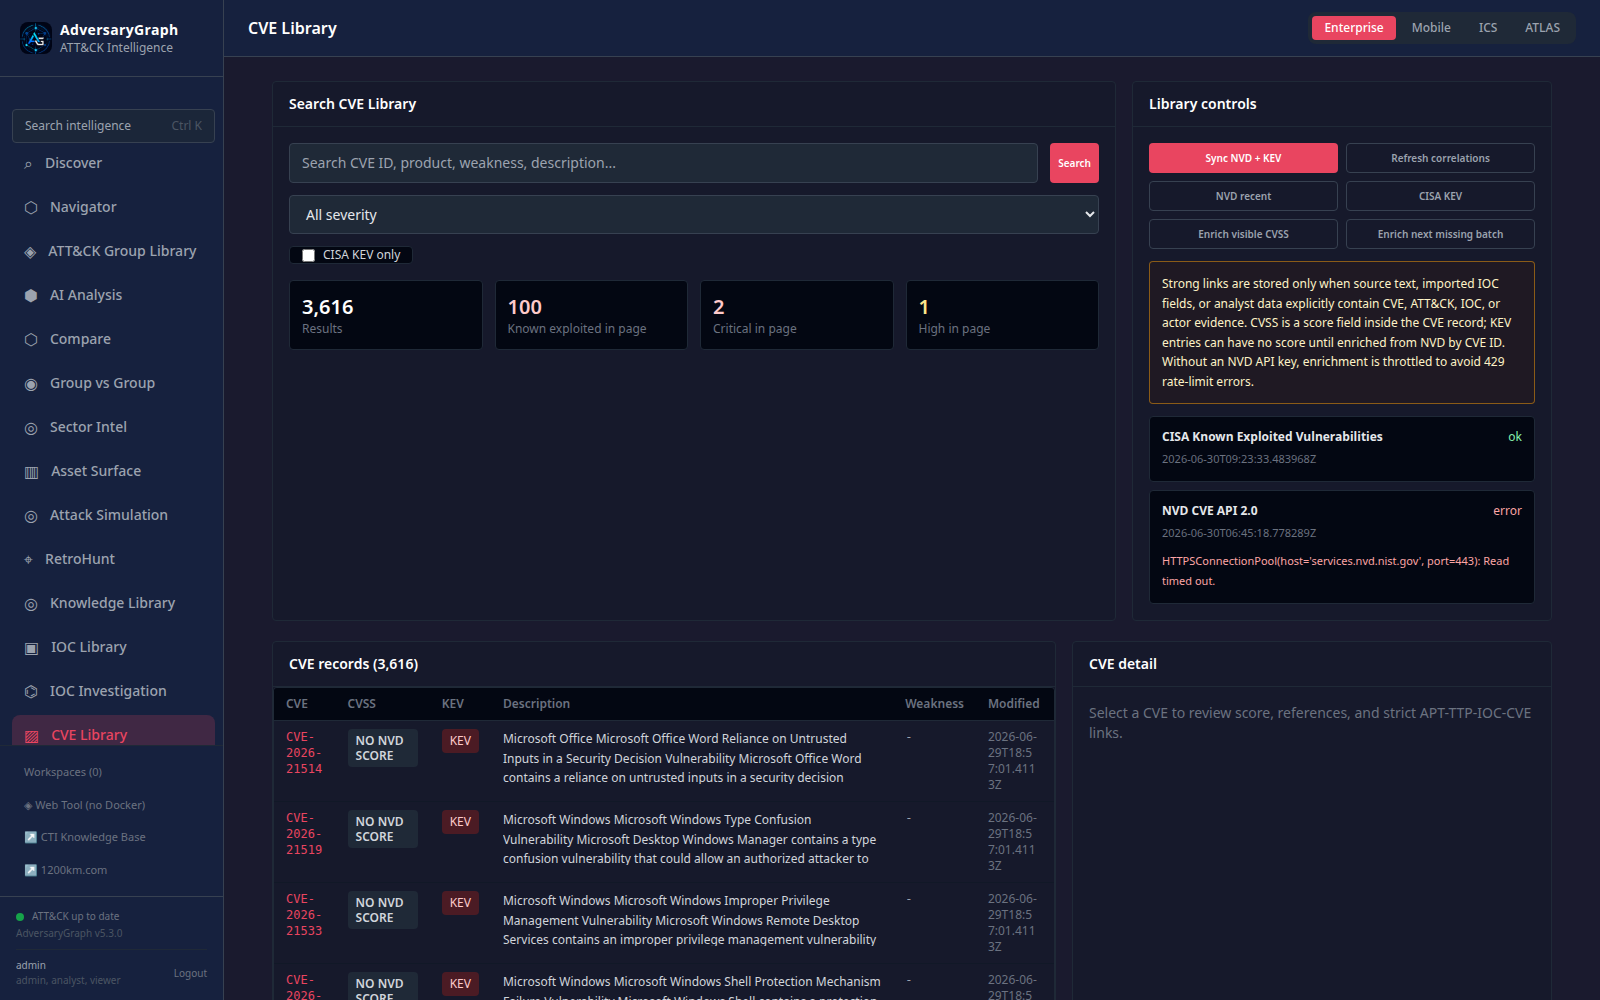
Relevant guide: CVE Library.
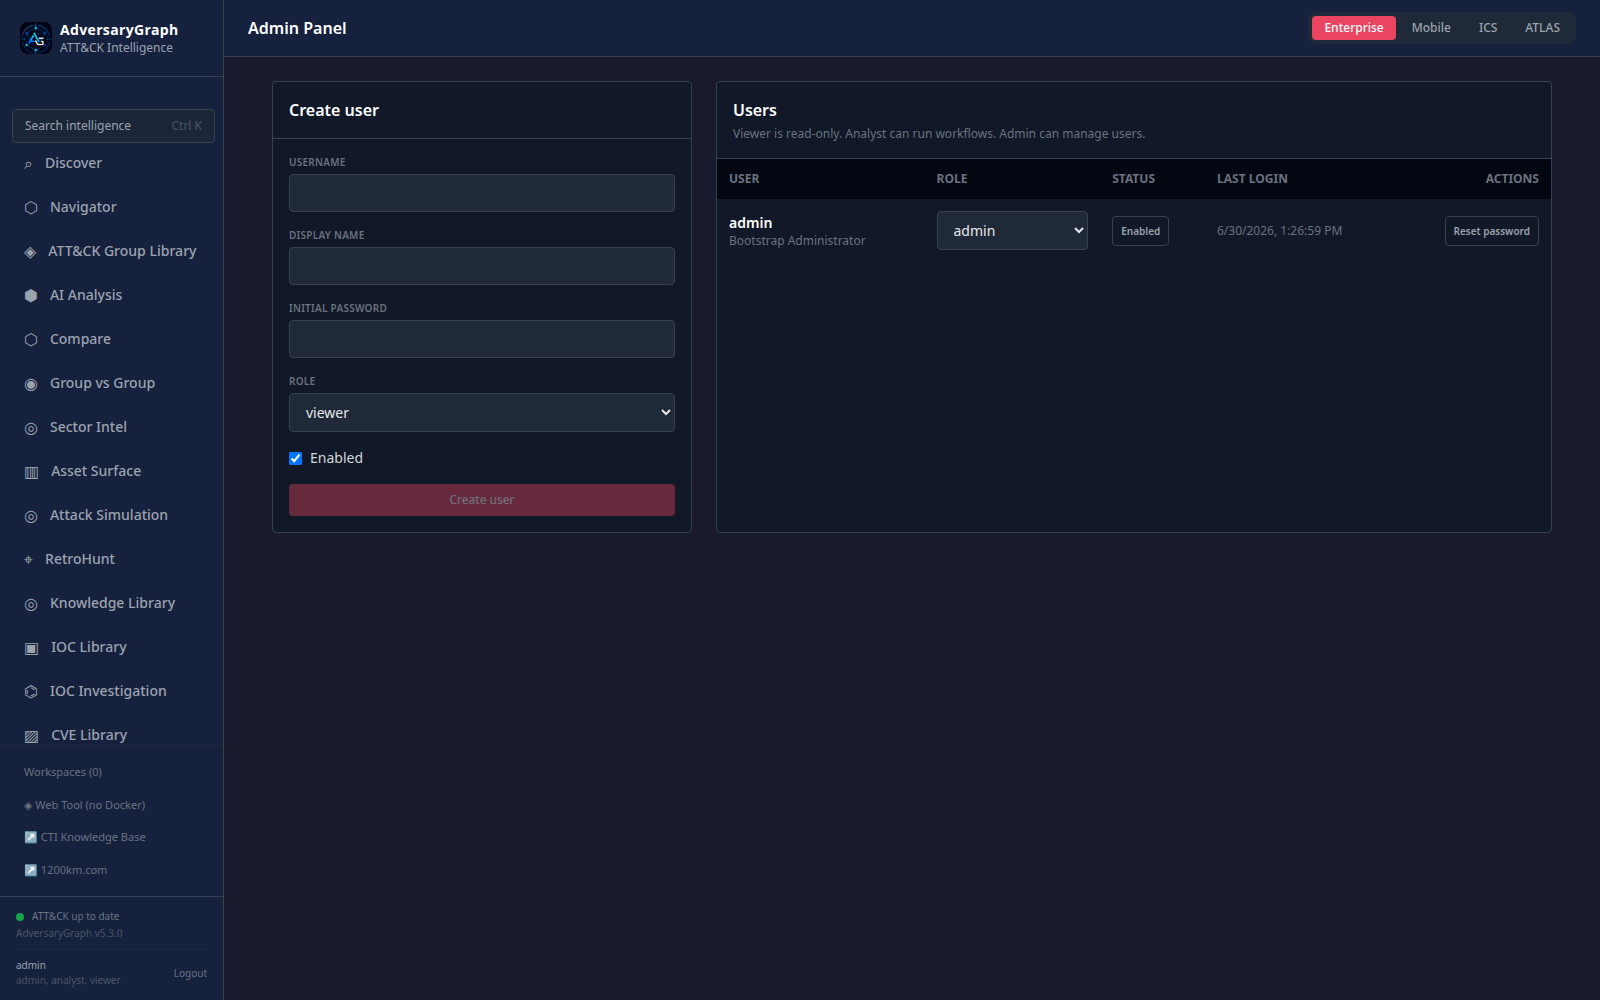
Authentication And Admin Validation
- Enable native authentication.
- Bootstrap the first administrator.
- Create named viewer, analyst, and admin users.
- Confirm role-gated access to operational modules.
- Remove bootstrap credentials from the runtime environment after permanent admin accounts exist.
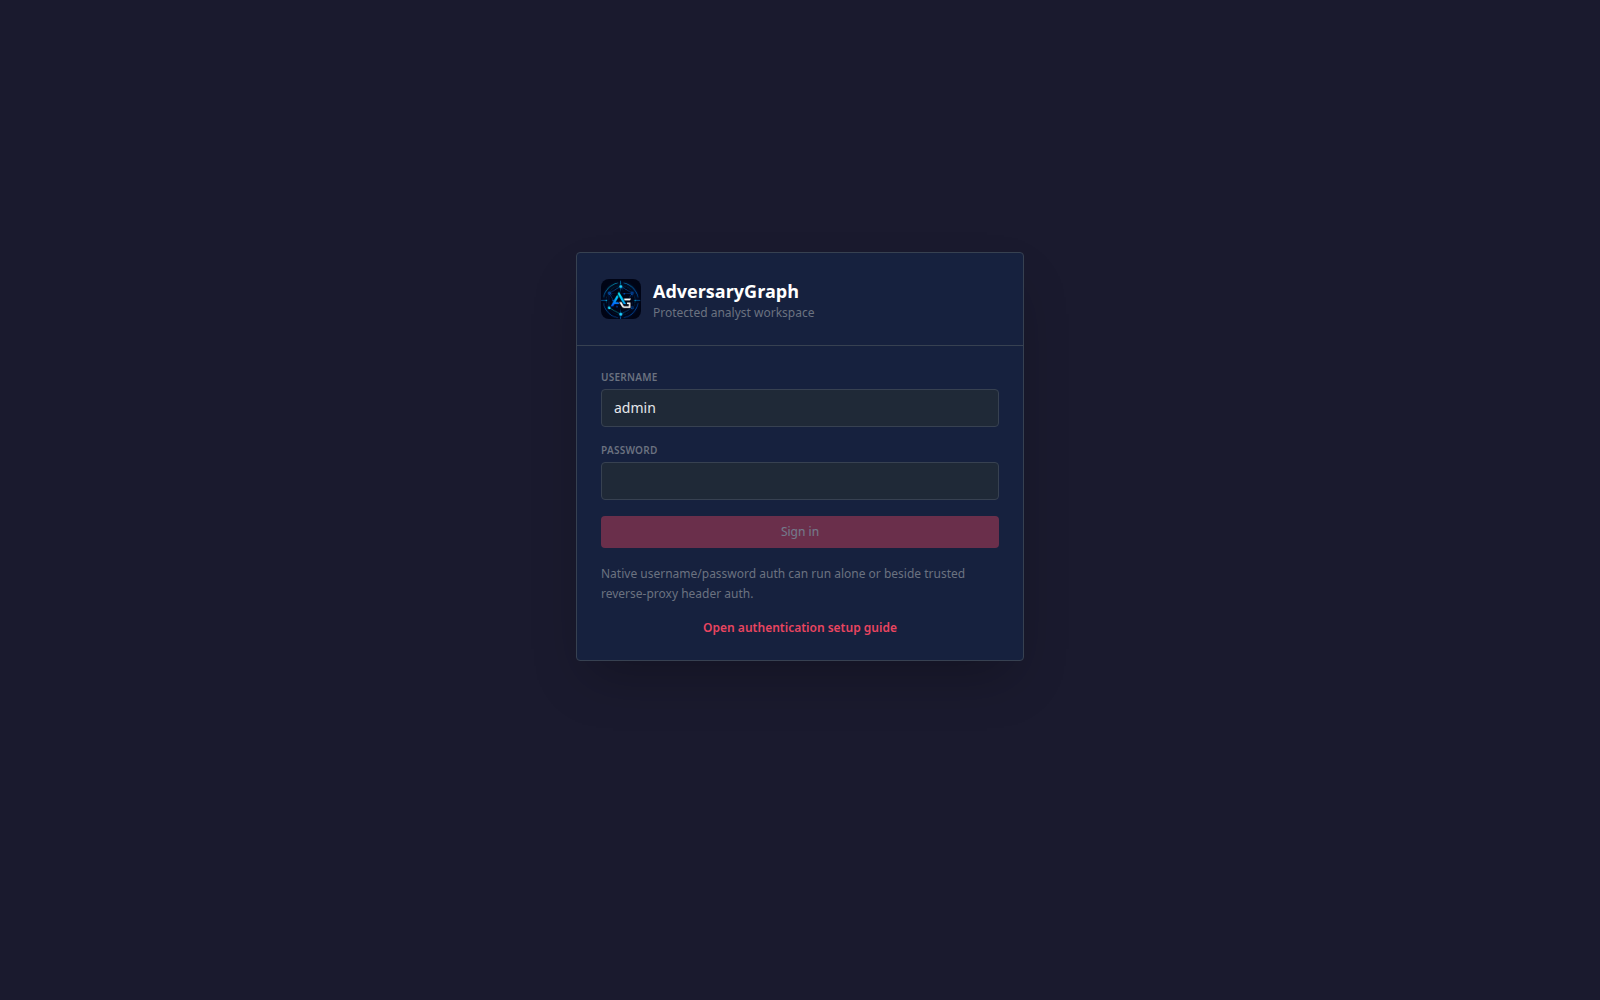
Relevant section: Authentication And User Management.
Malware Analysis Boundary Validation
- Upload or select an authorized Windows sample.
- Review static triage, strings, recovered imports, unpacking hints, and debug workspace output.
- Confirm that gated dynamic-analysis steps are clearly marked and separated from static findings.
- Treat AI summaries as analyst-assistance output requiring validation.
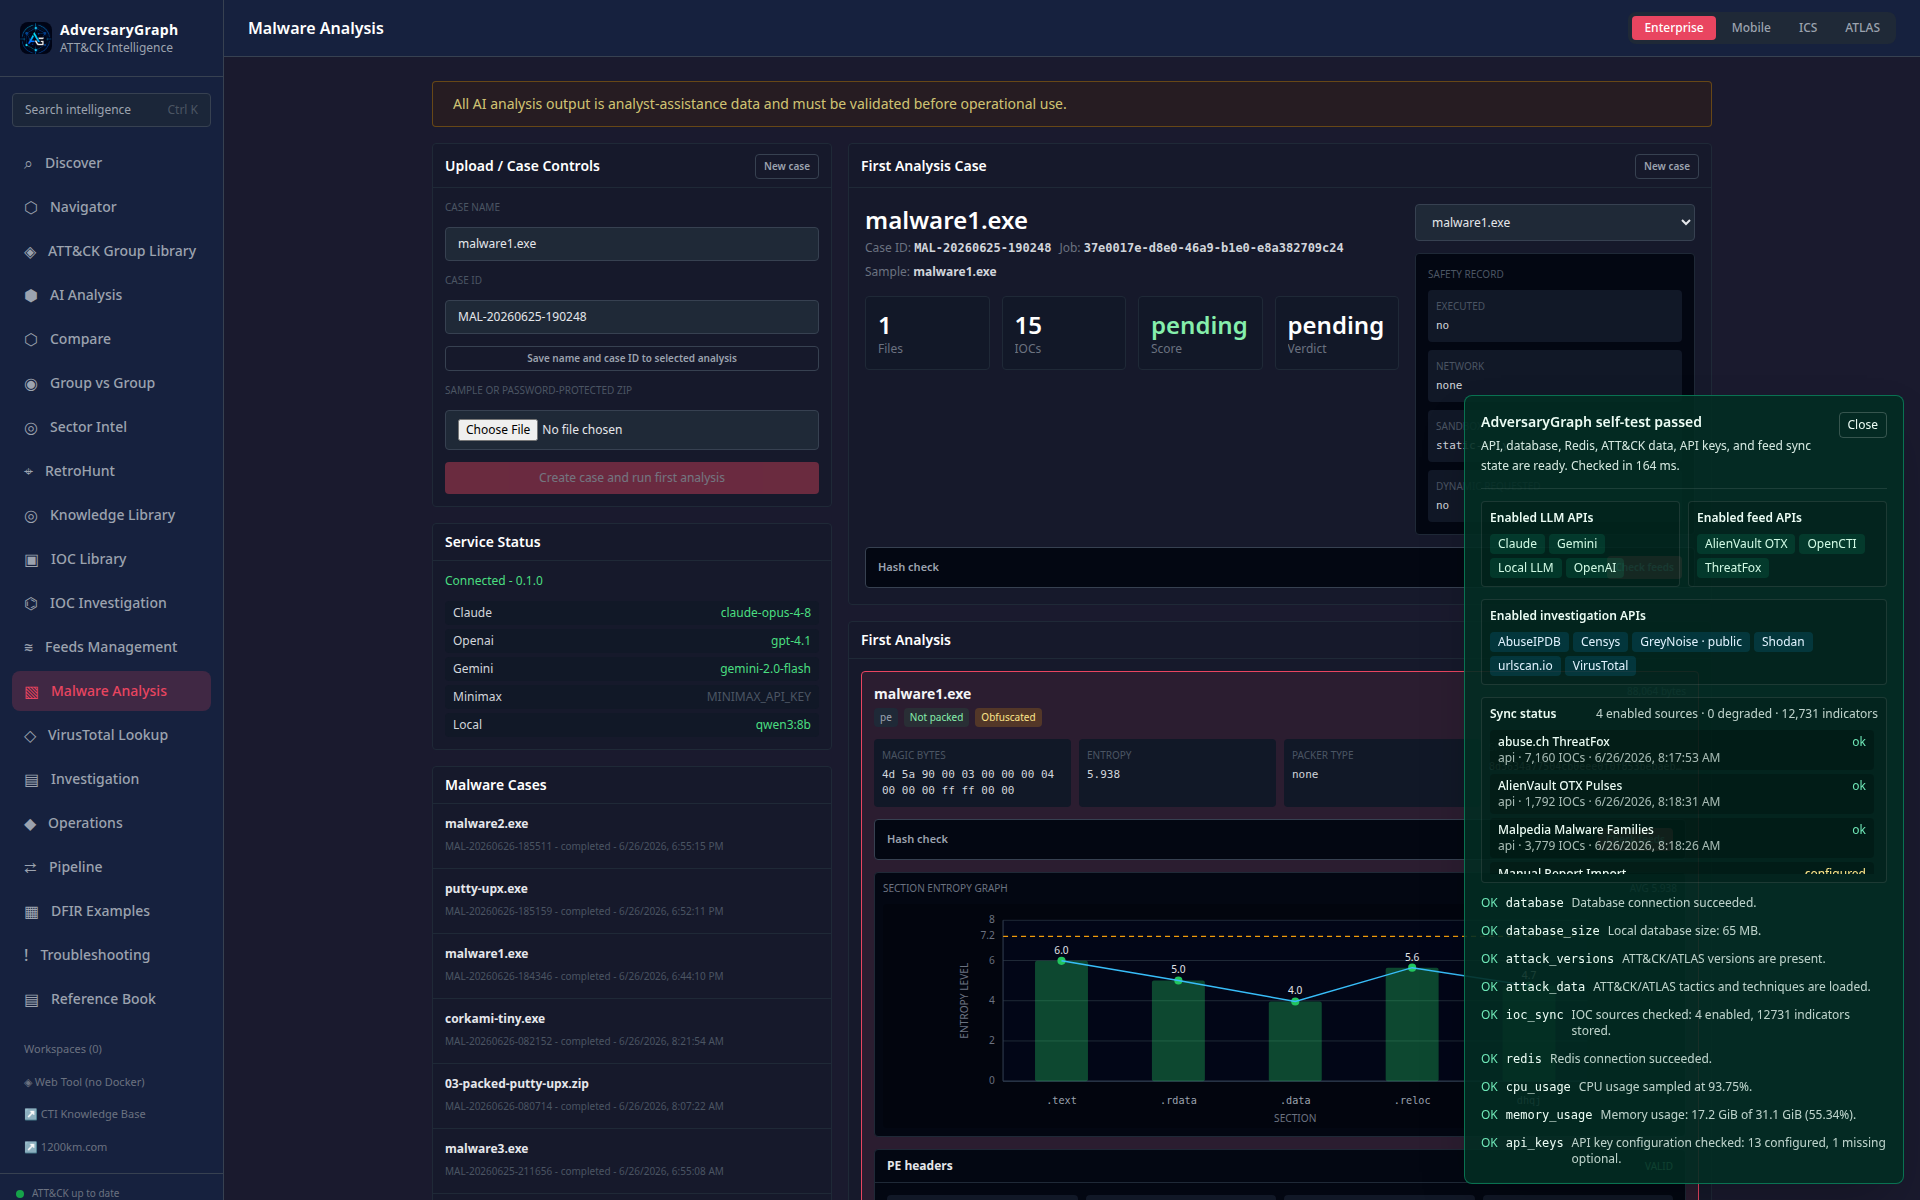
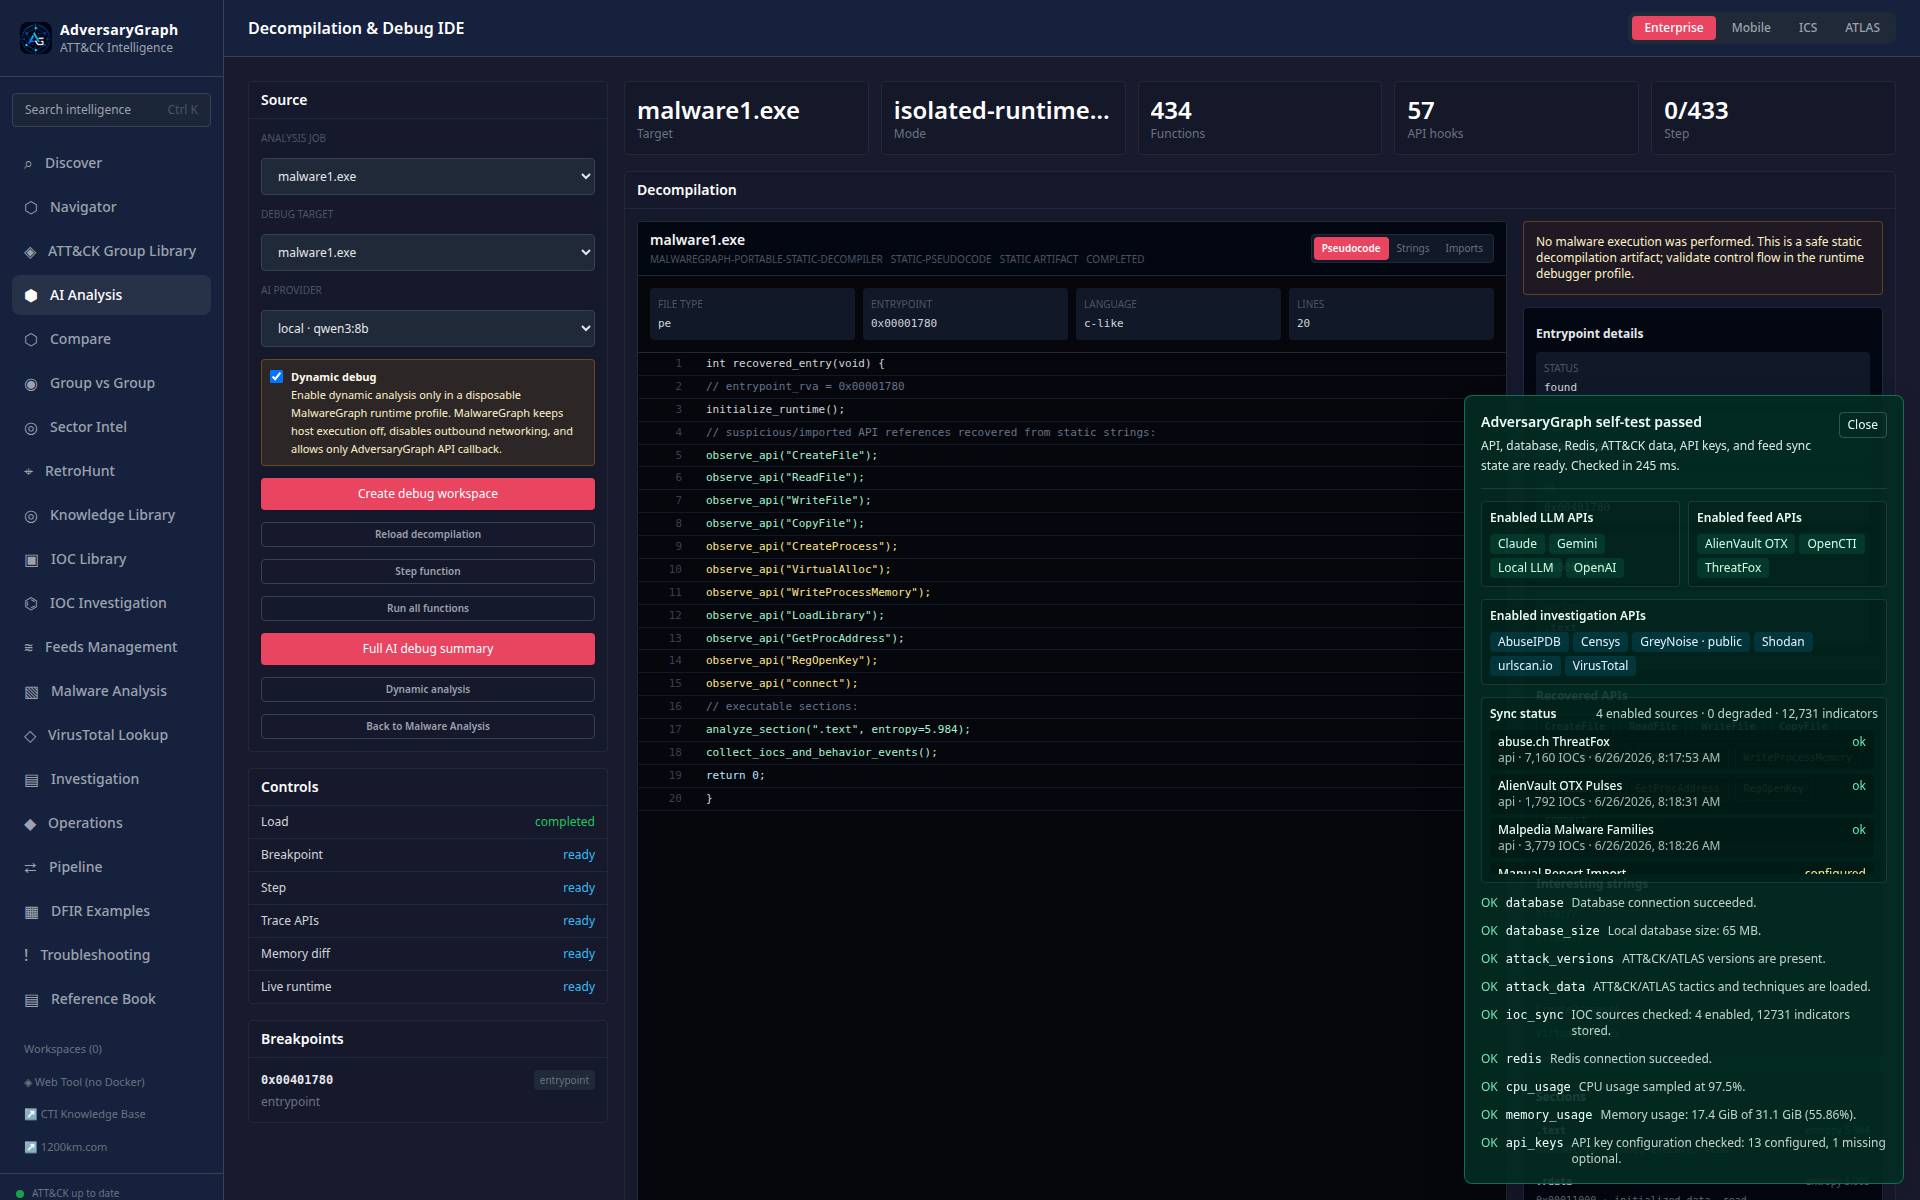
Relevant guide: Malware Analysis.
Operational Limits
- Observability is in-process and intended for troubleshooting, not long-term monitoring.
- Logs are redacted for common credential markers, but operators should still avoid exposing the dashboard publicly.
- Security scans reduce risk but do not replace manual review, threat modeling, or deployment hardening.
- Attack Simulation telemetry must be run only against authorized lab targets and approved SIEM collectors.