The Hypothesis — Scope and Definitions
Atlas home · Research path · Operational families · Anomaly models · Visual index
Consolidated 27 September 2026 from the revised publication. Source-reported incidents, proposed models, functional tests, and synthetic results remain separate evidence classes. Provenance and review scope.
The claim that malicious activity creates detectable anomaly patterns underpins UEBA platforms, ML-based SIEM analytics, network traffic analysis tools, and a large portion of behavioural detection engineering practice.
The operational hypothesis is conditional: some malicious behavior differs measurably from a suitable baseline in available telemetry. This selected case series does not establish how often that holds across attacks or enterprises. Absence of an anomaly may reflect ordinary-looking malicious behavior, the wrong comparison population or missing observations.
Definitions
Anomaly. NIST SP 800–94 defines anomaly-based intrusion detection as the comparison of normal activity profiles against observed events to identify significant deviations[1]. In operational terms, an anomaly is a measurable deviation from one or more baselines: an entity baseline (this user, this host), a peer baseline (users in this role, hosts in this class), a temporal baseline (activity at this time of day), a relationship model (who normally communicates with whom), or an event-sequence model (what normally follows what).
Point anomaly
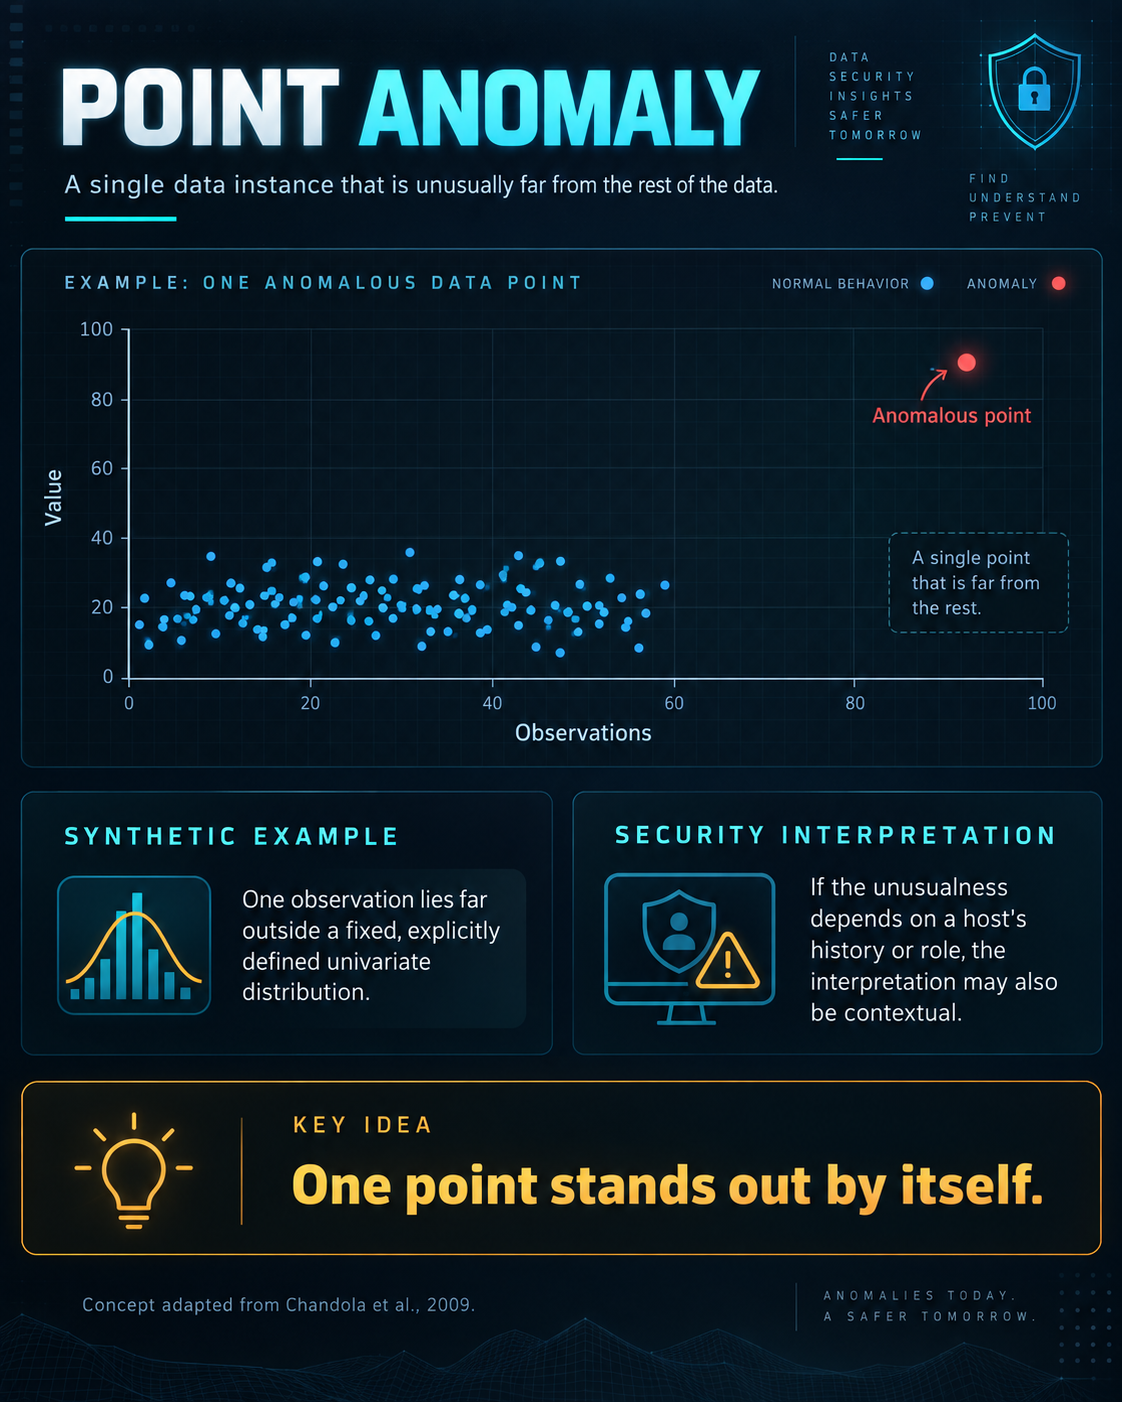
A single data instance that is anomalous relative to the rest of the data (Chandola et al., 2009)[2]. Synthetic example: one observation lies far outside the rest of a fixed, explicitly defined univariate distribution. If its unusualness depends on that host's history or role, the analysis is also contextual; these interpretations need not be mutually exclusive.
Text equivalent and full-size diagram
Distance from a reference distribution does not establish malicious intent. The plot is schematic, not a numerical detection threshold.
A single instance differs markedly from the reference data. The schematic shows a blue cluster and one higher red value.
Synthetic example: a value lies outside a fixed, defined univariate distribution. If host history or role determines the comparison, the interpretation can also be contextual.
Key idea: one point can stand out by itself. Neither the colored points nor the axis values are observations from an incident.
Contextual anomaly
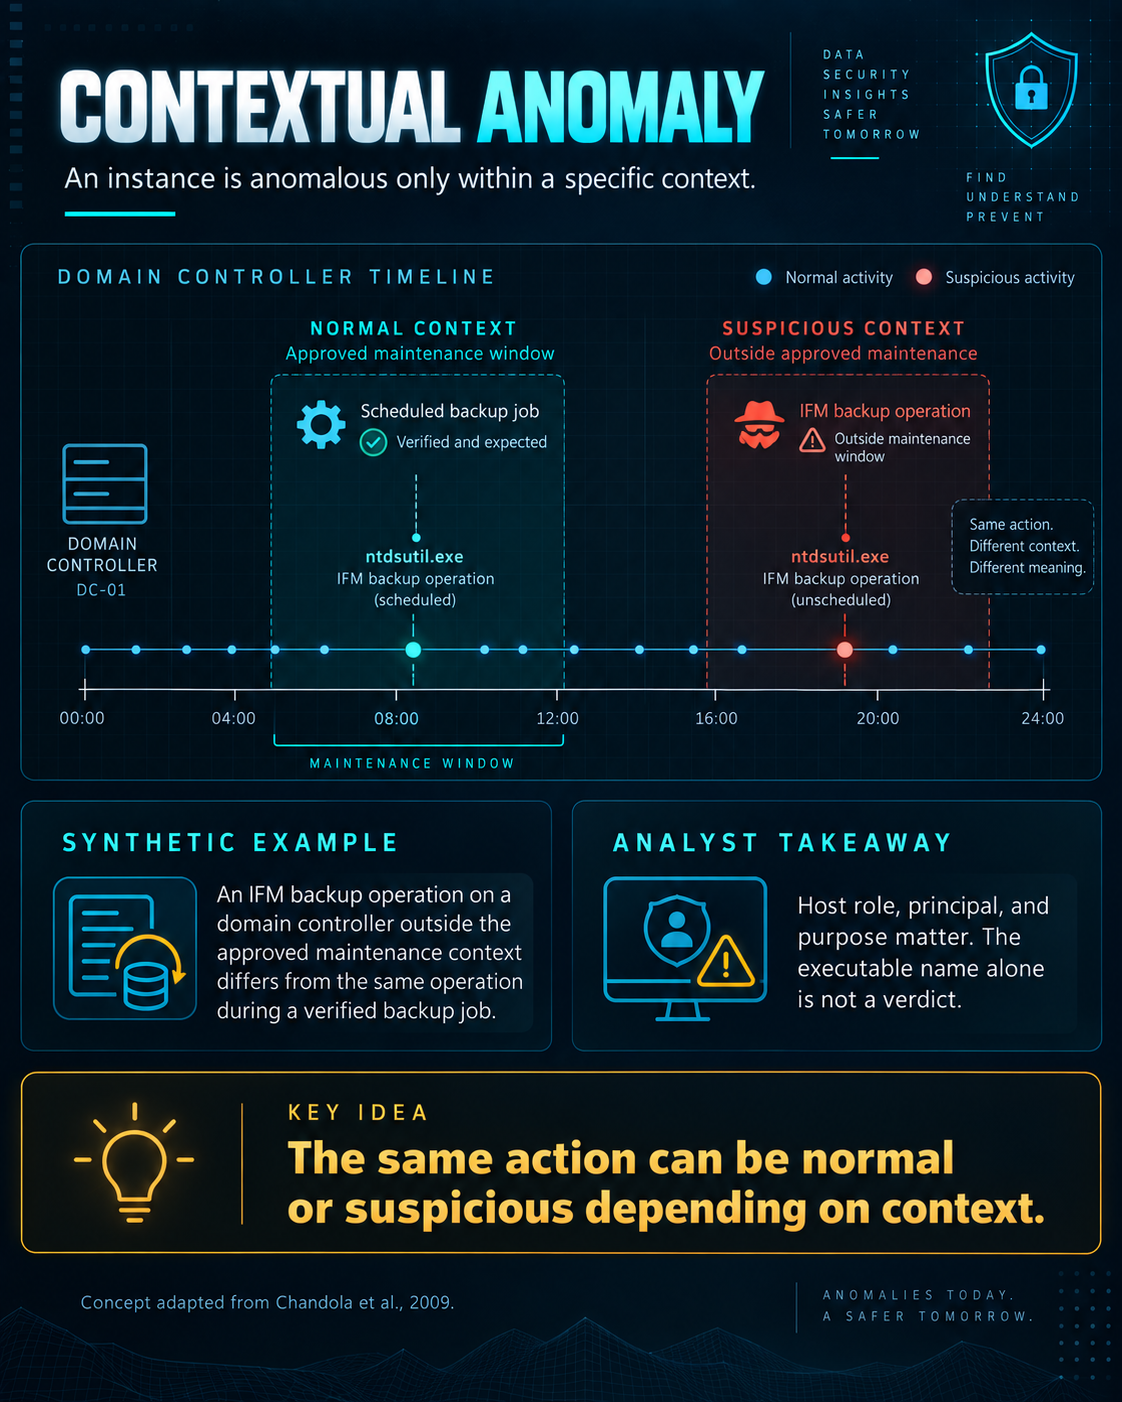
An instance that is anomalous only in a specific context[2]. Synthetic example: an IFM backup operation on a domain controller outside the approved maintenance context differs from the same operation during a verified backup job. The host role, principal and purpose matter; the executable name alone is not a verdict.
Text equivalent and full-size diagram
An unscheduled operation is a lead, not proof of credential theft. Validate the host role, account, approval and actual command purpose.
The same action can have different significance in different contexts. The diagram labels an example domain controller DC-01.
A scheduled ntdsutil.exe IFM operation appears inside an approved maintenance window; a second appears outside it. These are synthetic times, not a real incident timeline.
The image uses the shorthand IFM backup operation. More precisely, IFM creates installation media for adding a domain controller; it does not replace a full recovery backup.
Host role, principal and purpose matter. The executable name alone is not a verdict.
Collective anomaly
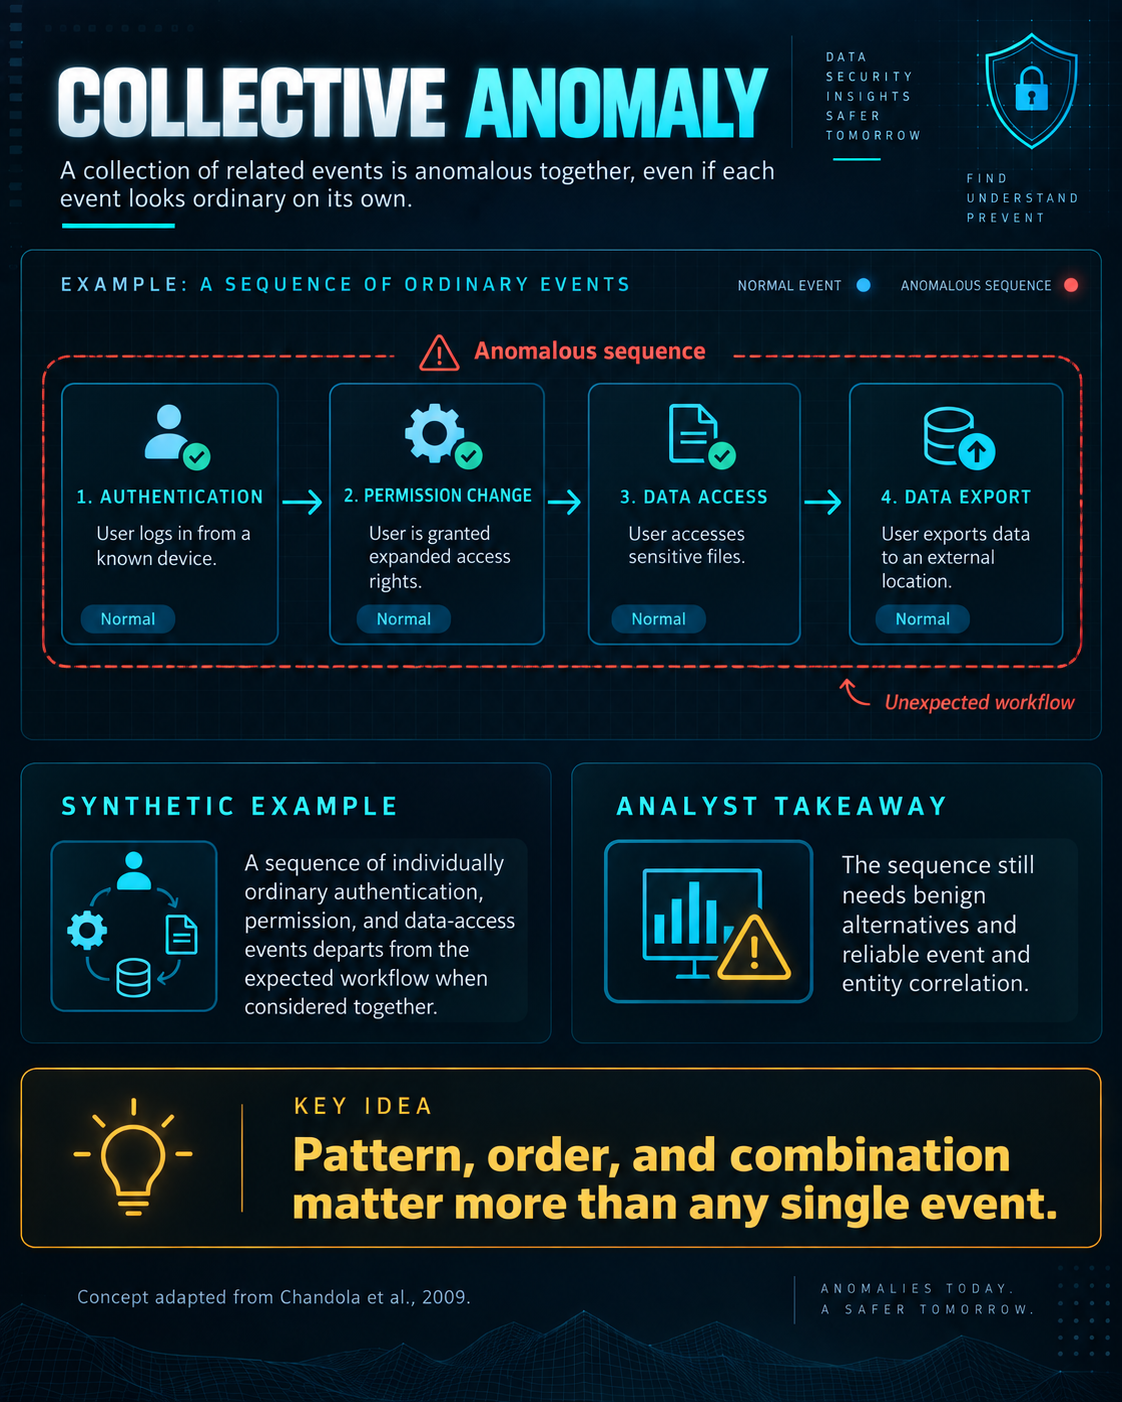
A collection of related instances that is anomalous together, even if each individual instance is not[2]. Synthetic example: a sequence of individually ordinary authentication, permission and data-access events departs from an expected workflow when considered together. The sequence still needs benign alternatives and reliable event/entity correlation.
Text equivalent and full-size diagram
Events need not be individually benign for a collective anomaly. Ordering is one possible relationship; a verified baseline and reliable entity correlation are still required.
Related events can be anomalous together even when individual events are not anomalous on their own.
The illustrated sequence is: login from a known device; expanded access rights; sensitive-file access; export to an external location. The graphic assumes each event can occur legitimately in the chosen environment.
The combined workflow differs from that environment’s expected pattern. Investigate benign alternatives and verify event and entity links.
The emphasis on pattern and order applies to this example. It does not mean a single event can never be decisive.
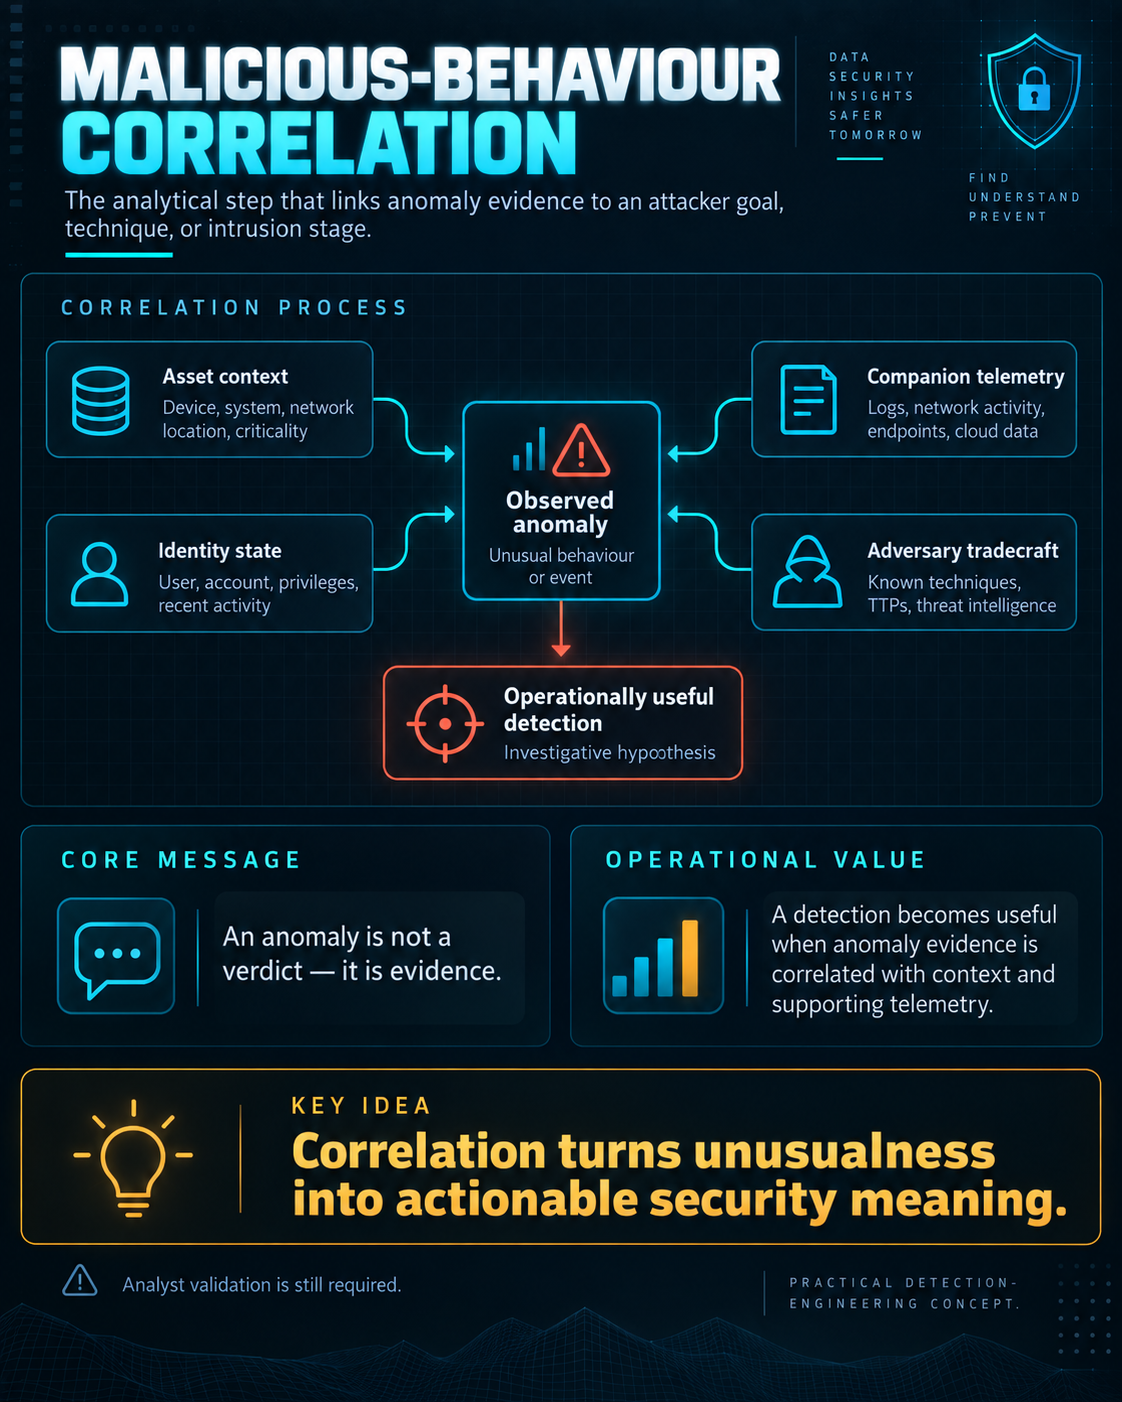
Malicious-behaviour correlation. The analytical step that links an observed anomaly to an attacker goal, technique, or intrusion stage. An anomaly is not a verdict — it is evidence. A detection becomes operationally useful when that evidence is correlated with asset context, identity state, companion telemetry, or known adversary tradecraft.
Text equivalent and full-size diagram
Correlation is an analytical step, not a fourth statistical anomaly form. Independent corroboration and analyst validation remain necessary.
Asset context includes the device, system, network location and criticality. Identity state includes the account, privileges and recent activity.
Companion telemetry includes logs, network activity, endpoint observations and cloud records. Adversary tradecraft provides candidate techniques and threat-intelligence context.
These inputs help interpret an observed anomaly and form an investigative hypothesis. An anomaly is evidence, not a verdict.
Operational value must still be tested. Adding a correlation condition can remove true alerts as well as false alerts.
The Central Tension
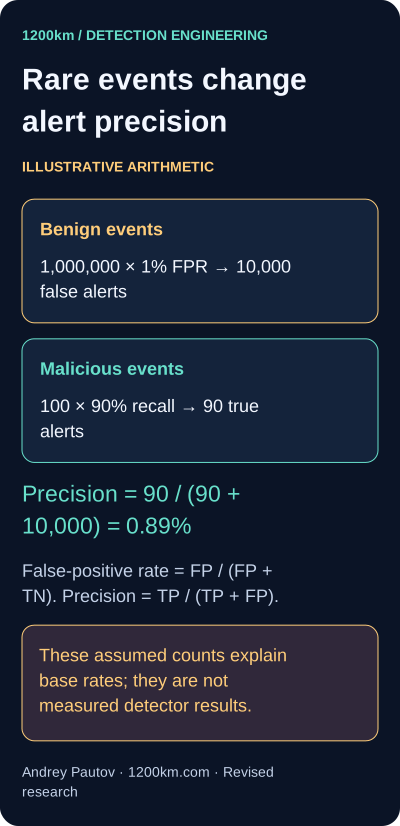
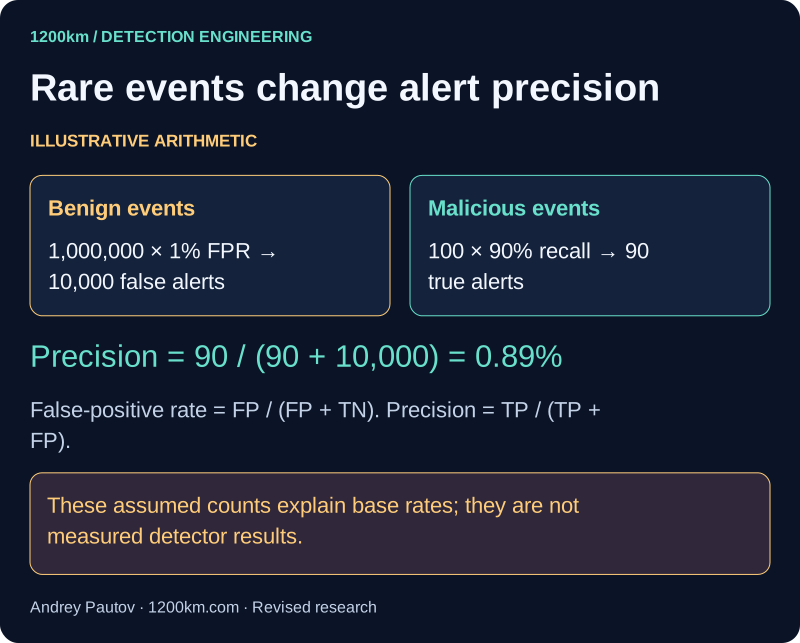
Malicious activity can be rare relative to ordinary enterprise events. Precision and false-positive rate are different quantities: precision is TP / (TP + FP), while false-positive rate is FP / (FP + TN). In an illustrative population of 1,000,000 benign events, a 1% false-positive rate produces 10,000 false alerts. If 100 malicious events are present and recall is 90%, the resulting 90 true alerts yield about 0.89% precision. These are explanatory numbers, not measured results. NIST SP 800–94 discusses the false positives caused by benign deviations from normal profiles[1].
Operational usefulness depends on the costs of misses and false alerts, available observability, and how the output changes an analyst's decision. Stable, role-appropriate baselines can help, but their value must be measured rather than inferred from a rarity score.
Text equivalent and full-size diagram
These assumed counts explain base rates; they are not measured detector results.
{
  "benign": 1000000,
  "malicious": 100,
  "fpr": 0.01,
  "recall": 0.9,
  "fp": 10000,
  "tp": 90,
  "tn": 990000,
  "fn": 10,
  "precision": 0.008919722497522299
}