TrainSec source integration · Windows internals · Technical walkthrough
VMMap Basics: How to Read a Windows Process's Memory Layout
Pavel Yosifovich, co-author of the Microsoft Press Windows Internals books, turns to one of the Sysinternals tools this time: VMMap.
In an earlier post I looked at the maximum number of handles a process can hold; this one is about what actually fills a process’s address space, and what each part of it is for. VMMap is free, part of the Sysinternals suite, and it will tell you more about what a process is doing with memory than Task Manager ever will. This is aimed at Windows developers and security researchers who want to look at a running process and actually understand its memory, not just its total footprint.
What Does VMMap Actually Show You?
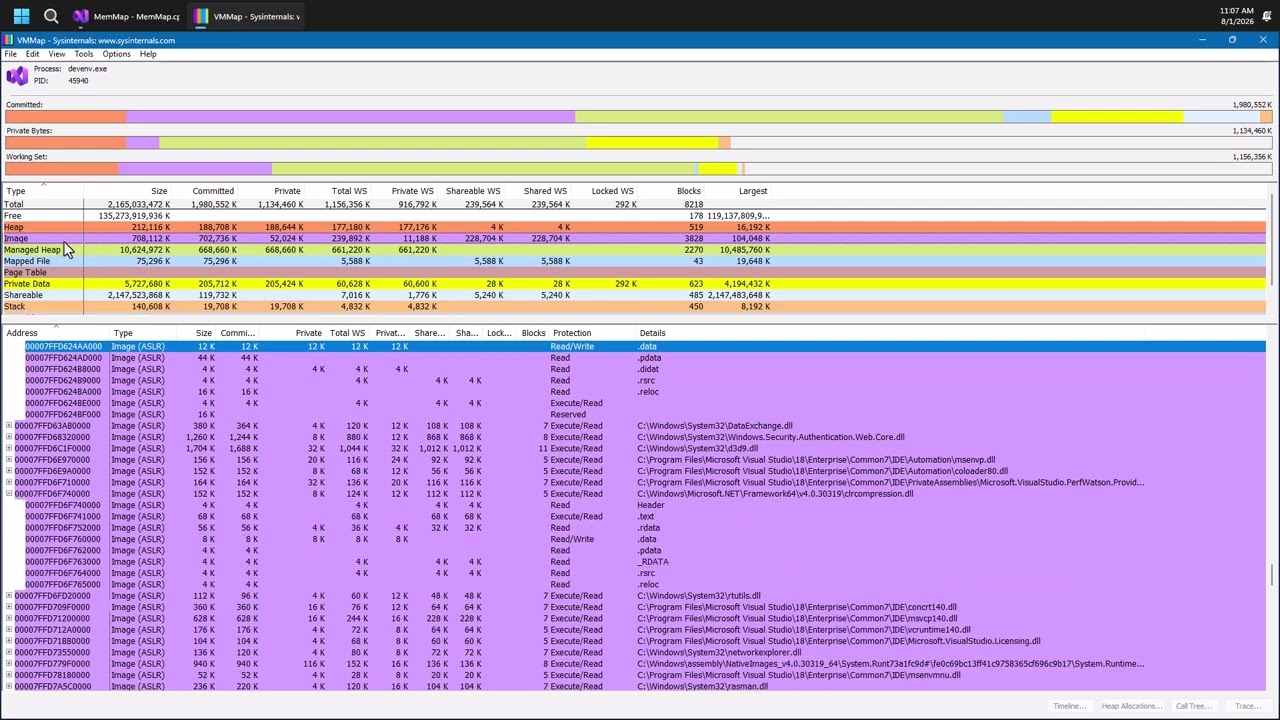
VMMap opens against a single process and gives you three views at once: a summary of the whole address space at the top, a breakdown by memory type in the middle, and the full address space map at the bottom, which you can expand block by block. Pick a process like Visual Studio, and the summary immediately tells you the committed memory, the private bytes, and the working set, color coded by category. Select one of the rows in the middle section and the bottom view filters down to just that category, and you can drill into individual blocks to see exactly what is there.
How Big Is a Process Address Space, Really?
Every process gets its own address space, starting at address zero. On 64-bit Windows that space spans up to 128 terabytes. On 32-bit, it is a lot smaller, around 2 GB by default. Either way, almost none of it is actually used. When a process starts, only the executable and ntdll get mapped in by the kernel. Ntdll then takes over, loads whatever other DLLs the executable depends on, and eventually calls the entry point, typically a C runtime stub that in turn calls the main function you actually wrote. Everything else you see in VMMap, every heap, every stack, every mapped file, gets added to that space afterward, while the process is running.
What Do Committed, Private Bytes, and Working Set Actually Mean?
These three numbers look similar and are not. Committed memory is memory that has actually been allocated with something like VirtualAlloc, meaning you can use it right now. Private bytes, which Task Manager calls Commit Size, is the subset of that committed memory that belongs only to this process. Some committed memory is shareable: DLL images, for instance, are mostly shared between every process that loads them, so the purple bar for images in VMMap is large in the committed view but tiny in the private view. Heaps, on the other hand, are always private, so their bar looks exactly the same size in both views. Nothing about a heap can be shared with another process.
Then there is the working set, which is the part of committed memory that is currently sitting in physical RAM rather than paged out somewhere else. A process can commit far more memory than is actually resident at any given moment, and the gap between committed size and working set is exactly that: memory that has been allocated but is not currently occupying RAM.

Why Does Memory Always Come in 4 KB Chunks?
Every low-level allocation, whether through VirtualAlloc or something built on top of it, works in units of pages, and a page on Windows systems is 4 KB by default. That is why the smallest block you will ever see in VMMap is 4 KB, and why the last three hex digits of any address here are always zero. There is also a two-step dance behind every allocation: you first reserve a range of address space, then commit some or all of it. A reserved-only block has nothing behind it; try to touch it and you get an access violation. A committed block has real memory and a real protection, like read/write or execute/read, and it is possible for a single reserved region to have only parts of it actually committed, which is exactly the kind of structure you see when you expand a block in VMMap.
What Are the Memory Categories VMMap Breaks Down?
This is really where VMMap earns its keep. Select Images and you get every PE file mapped into the process, DLLs and the executable itself. Expand one and you see it broken into sections that map straight to what is in the PE file: a read-only header, a text section where the code lives, protected as execute and read, a data section, resources, and so on. Most of an image is shareable, since multiple processes load the same DLL, but any section with private, writable data gets its own private copy per process if needed (Copy on Write).
Mapped files look similar to images but are not necessarily PE files at all. Anything memory-mapped as a plain data file, including something like a font file, shows up here, and like images, this memory is shareable, at least potentially.
Heaps are always private. Every call to HeapCreate, and everything built on top of it including the classic C runtime malloc, manages smaller allocations not on page granularity so pages are not wasted on tiny requests. A process can and often does have many heaps, each numbered by VMMap starting at zero. Any DLL loaded into the process can create its own.
Managed heap only shows up if the process is running .NET code, and stays empty otherwise.
Stacks are per thread. Each one has a committed part that is currently usable, a guard page just below it that triggers the memory manager to commit more when the thread needs it, and a reserved region below that where the stack can keep growing, since stacks grow downward in Windows.
Shareable memory is memory backed by a section object rather than a specific file. It is not necessarily shared with anyone right now, but it could be, and once every handle to that section closes, the memory is simply gone with nothing persistent behind it. One block here looked genuinely strange until I dug into it: a reserved region of roughly two terabytes with only a hundred-odd megabytes actually committed, and committed with no access at all, which sounds pointless until you recognize it. That turns out to be the bitmap behind Control Flow Guard, a security feature present in most Microsoft-built processes, and its no-access protection is entirely intentional: nothing is supposed to read it directly.
Private data is everything left over, the catch-all for VirtualAlloc blocks that VMMap cannot tie to any of the categories above. It is not completely useless, though. It is also where you find Thread Environment Blocks, a per-thread data structure every thread has in user mode, which brings up the one genuine bug in the tool.
What Can’t VMMap Do, and Why Does That Matter?
VMMap takes a snapshot. It does not refresh automatically, so if you want current numbers you either hit F5 (Refresh). The Timeline feature, which tracks changes across repeated refreshes and is far more interesting on a process that is actually doing something than on one sitting idle. More importantly, VMMap will show you that a block is committed and what category it falls into, but it will not show you the actual bytes inside that block. For that you need a different tool, something like System Informer (formerly Process Hacker), which can open a process and let you read its memory live.
There is also a harder limit worth naming directly: protected processes are out of reach for VMMap entirely, because you cannot obtain a powerful enough handle to open one without a kernel driver, and VMMap, at least in its current form, does not use one.
What This Means Practically
- Open VMMap against a suspicious or unfamiliar process before reaching for a debugger, to get committed, private, and working set numbers at a glance.
- Expand the Images row on any process to see a PE’s actual sections in memory, not just its file layout on disk.
- Recognize a huge reserved region with almost nothing committed as a strong hint you are looking at a security bitmap like Control Flow Guard, not a memory leak.
- Treat a “Thread Environment Block” entry in Private Data as real only when a thread ID is shown next to it; a reserved-only block cannot be a TEB, no matter what the label says.
- Reach for System Informer, not VMMap, the moment you need to read the actual bytes inside a committed block instead of just knowing it exists.
Keep Learning
If you want to go deeper into the Sysinternals tools and the Windows internals behind them, these TrainSec courses go further:
- Sysinternals Tools Deep Dive: covers VMMap alongside Process Explorer, WinObj, DebugView, CPU Stress, Not My Fault, and LiveKD, with the internals context behind each one
- Windows Internals Master: the full learning path if you want to understand processes, memory, and the kernel from the ground up
Related reading in the knowledge library: Protected Processes & PPL, on why some processes are off limits even to tools like VMMap, and Maximum Handles in a Process, another look at per-process limits from a different angle.
Original publication: TrainSec Knowledge Library ↗
Original text, screenshots, infographics, videos, and author biography remain attributed to TrainSec.net and the named author. This page is hosted by 1200km.com with permission from the TrainSec rights holders.