The Intelligent Shield: Building an AI-Powered CTI Platform with OpenCTI
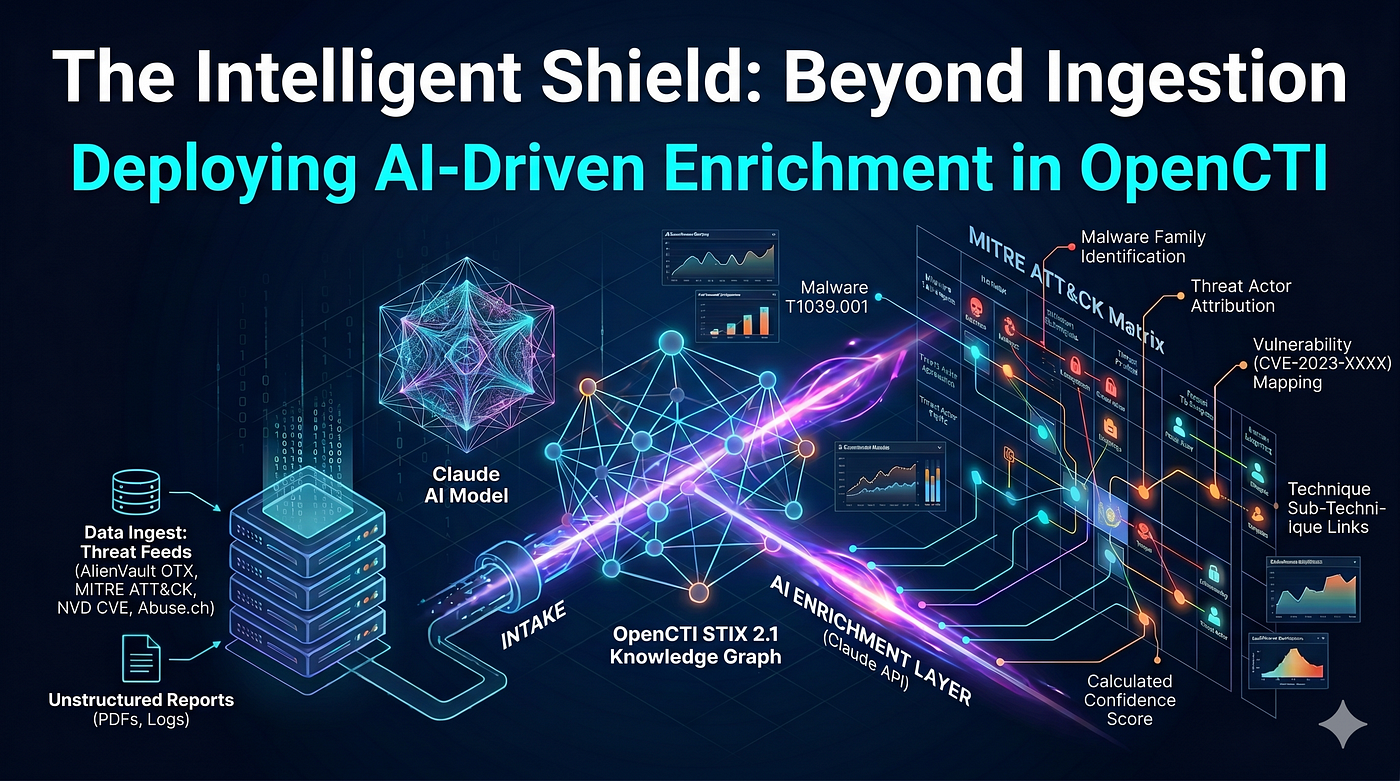
Most CTI programs get stuck at collection. Raw feeds flow in — OSINT, ISAC alerts, vendor reports — and analysts spend their time manually tagging, deduplicating, and cross-referencing data that never quite connects into structured intelligence. OpenCTI solves this, but only if you deploy it correctly and feed it properly.
This guide walks through the complete setup: architecture, feeds, a custom Claude AI enrichment connector, security hardening, and real investigation workflows. By the end you'll have a running platform that automatically converts ingested data into STIX 2.1 objects, maps indicators to MITRE ATT&CK techniques, and surfaces attribution chains — without manual pivoting.
This project is part of a broader CTI practitioner ecosystem that includes the CTI Analyst Field Manual, CTI as a Code methodology, and actor-specific research in the Israel Threat Actors CTI knowledge base.
Table of Contents
- What OpenCTI Actually Is
- Core Capabilities
- Architecture Overview
- Intelligence Feeds
- Hardware Requirements
- Deployment: Three Docker Compose Stacks
- Connector Configuration
- AI Enrichment: The Claude Connector
- Inference Rules
- Security Hardening
- Monitoring and Operations
- Real Investigation Workflows
- Integrating with the CTI Ecosystem
What OpenCTI Actually Is
OpenCTI is an open-source threat intelligence platform developed by Filigran. It implements STIX 2.1 natively — every object stored in the platform is a STIX Domain Object (SDO), STIX Cyber Observable (SCO), or STIX Relationship Object (SRO). This isn't cosmetic compliance; the entire graph database is built around STIX semantics.
What that means in practice: when OpenCTI stores a threat actor, it isn't a free-text label in a spreadsheet. It's a structured object with a UUID, confidence score, TLP marking, and typed relationships to malware, attack patterns, campaigns, and infrastructure — all queryable via GraphQL API.
Before vs After: What Changes When You Deploy OpenCTI
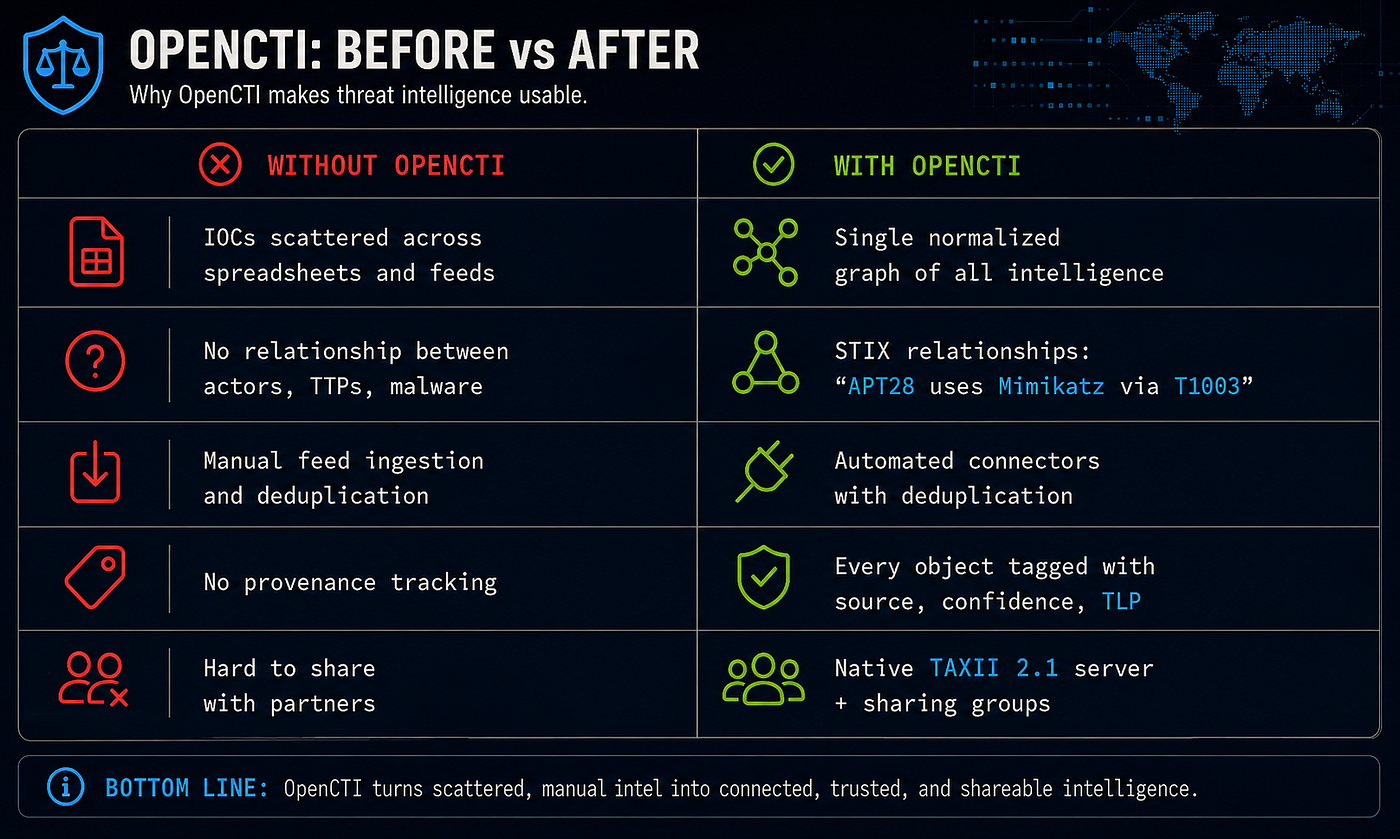
The gap between "before" and "after" isn't just organizational. Before OpenCTI, threat intelligence typically exists as:
- Unstructured PDFs and email alerts
- Flat IOC lists with no relationship context
- MITRE ATT&CK technique IDs referenced in reports but never linked to actual observables
- Attribution claims with no confidence scoring or provenance tracking
After a properly configured OpenCTI deployment, the same intelligence becomes:
- STIX 2.1 objects with typed relationships
- Indicators automatically linked to threat actors and campaigns via inference rules
- ATT&CK techniques mapped to specific intrusion sets with evidence chains
- Every piece of data carrying TLP markings, confidence scores, and source provenance
The shift is from a document archive to a queryable threat knowledge graph.
Live Platform: What a Populated Instance Looks Like
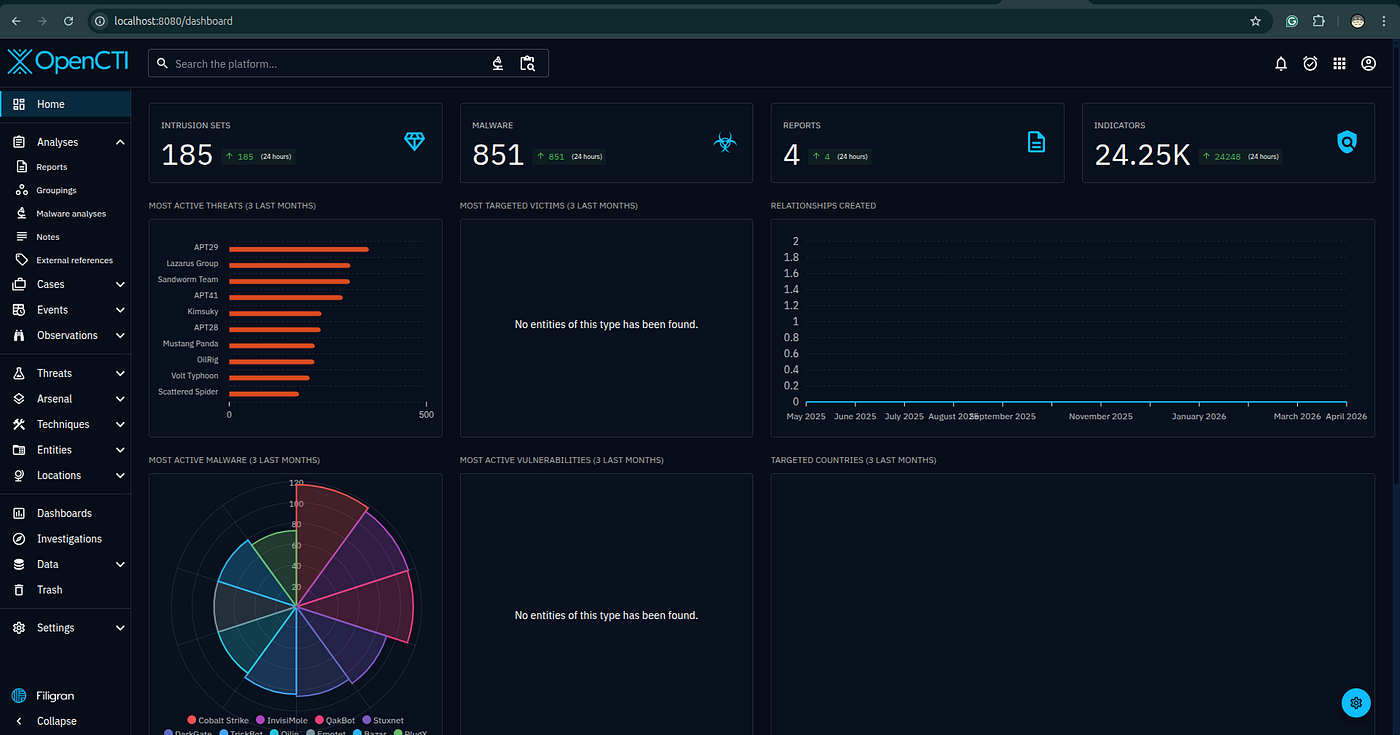
A fully loaded instance shows the scale of what's possible. The dashboard above reflects a platform with 185 tracked intrusion sets, 851 malware families, and over 24,250 active indicators — all structured, related, and searchable.
Core Capabilities
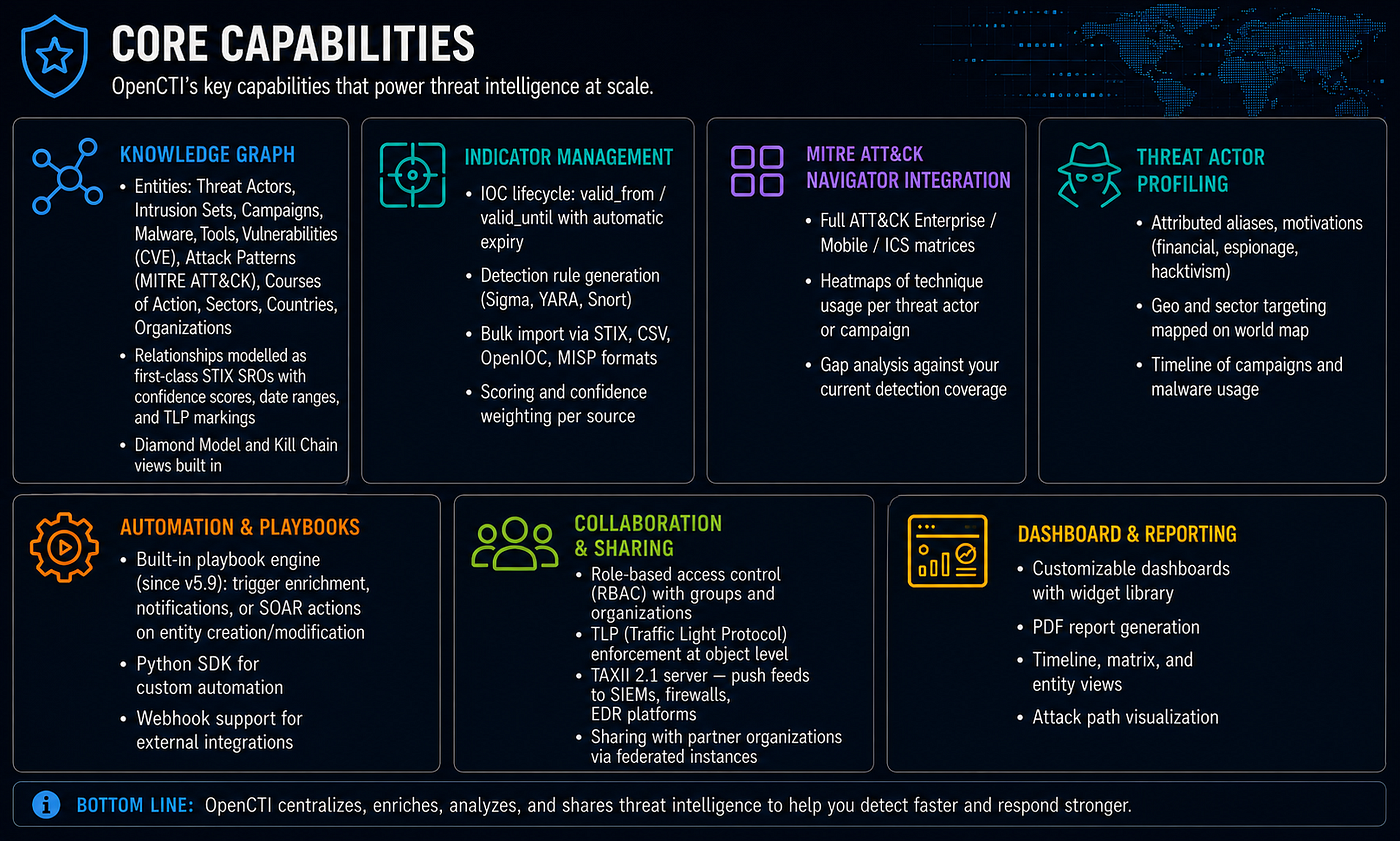
OpenCTI's seven core capability areas:
1. Threat Actor Tracking — Maintain structured profiles for APT groups, cybercriminal actors, and nation-state operators with attribution chains, aliases, and campaign history. See how this maps to field tradecraft in the CTI Analyst Field Manual.
2. Malware and Arsenal Management — Store malware families, tools, and TTPs with typed relationships: which actor uses which tool, which campaign deployed which implant.
3. Indicator and Observable Management — IOCs as STIX SCOs linked to the threat context that explains them. An IP address isn't just an IP — it's an indicator of a specific intrusion set, linked to a campaign, carrying a confidence score and TLP marking.
4. ATT&CK Technique Mapping — Every tactic and technique from MITRE ATT&CK ingested and relationship-mapped to actors, malware, and campaigns.
5. Report Storage and Analysis — PDF and structured reports imported as STIX Report objects, with automatic entity extraction (when combined with the AI connector described below).
6. STIX 2.1 Import/Export — Native STIX bundles in and out. Interoperable with any TAXII 2.x consumer or producer.
7. GraphQL API and Custom Integrations — Full programmatic access to the knowledge graph. Build custom dashboards, alert pipelines, or SOAR playbooks using the same API the UI uses.
Architecture Overview
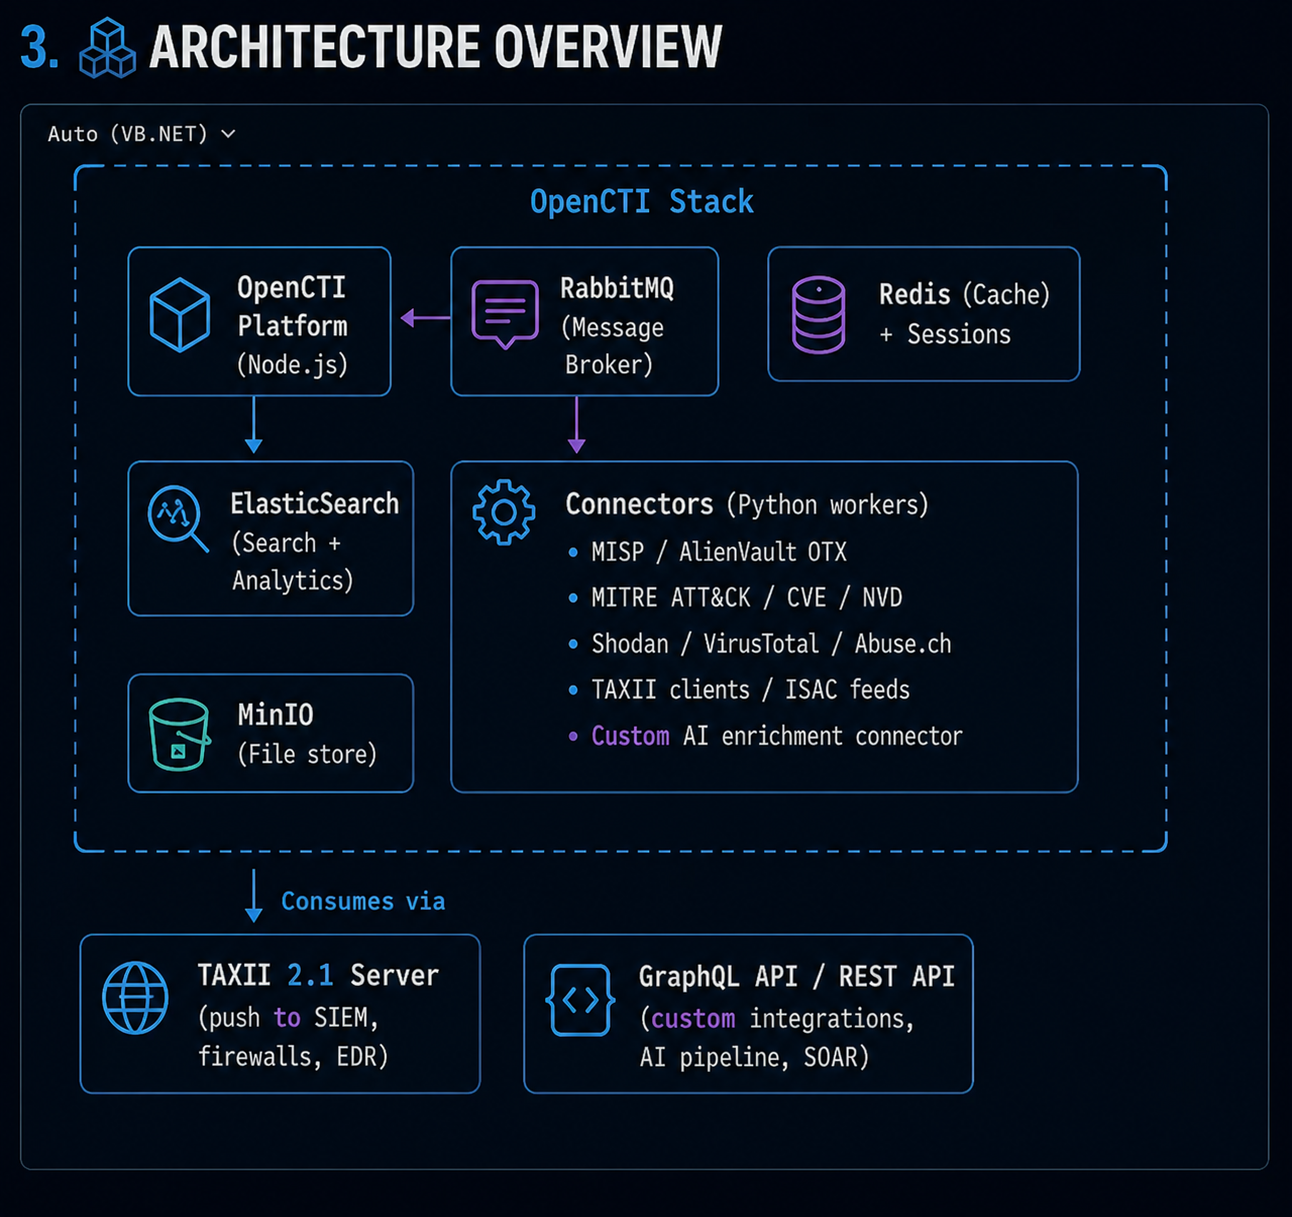
OpenCTI's stack has several distinct layers:
Core Platform
- OpenCTI Platform (Node.js) — The application server. Handles the GraphQL API, web UI, and all business logic.
- ElasticSearch — Full-text search and analytics. Every STIX object is indexed here for fast queries.
- JanusGraph — The graph database layer that stores relationship structures between STIX objects.
- Redis — Session cache and task queue coordination.
- RabbitMQ — Message broker for connector communication. All connector workers subscribe to queues here.
- MinIO — S3-compatible object store for report files, attachments, and analysis artifacts.
Extension Layer
- Connectors (Python workers) — Each connector is an independent Python process that subscribes to a RabbitMQ queue, pulls data from its source, converts to STIX, and pushes back to OpenCTI. Connectors run for: MISP, AlienVault OTX, MITRE ATT&CK, CVE/NVD, Shodan, TAXII clients, ISAC feeds, and the custom AI enrichment connector.
- TAXII 2.x Server — Built-in TAXII server endpoint. Push curated collections to SIEMs, firewalls, or EDR platforms.
- GraphQL API / REST API — The integration surface. Used for custom integrations, AI pipeline inputs, and SOAR playbook automation.
JanusGraph is the relationship graph engine under the hood. You don't interact with it directly — OpenCTI abstracts all graph queries — but it's what makes the "pivot from IOC to actor to campaign" workflow fast even at scale.
Intelligence Feeds
The platform is only as good as what you feed it. OpenCTI supports three feed tiers that together cover the full intelligence spectrum.
Free and Open-Source Feeds
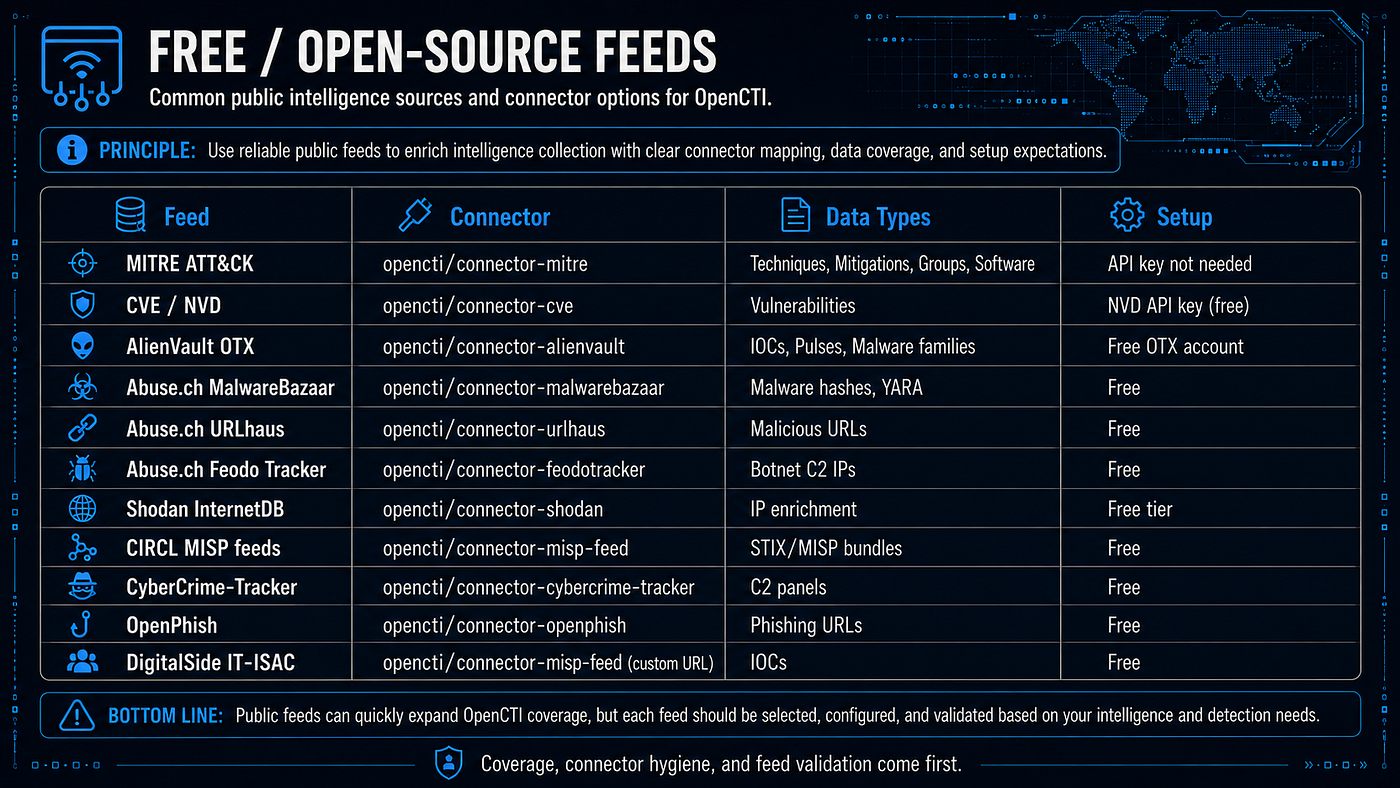
These connectors are free to run and provide strong foundational coverage:
| Feed | Connector | What It Provides |
|---|---|---|
| MITRE ATT&CK | opencti-connector-mitre | All tactics, techniques, sub-techniques, mitigations, and relationships |
| CVE / NVD | opencti-connector-cve | Vulnerability objects linked to affected software |
| AlienVault OTX | opencti-connector-alienvault | Community threat intelligence pulses with IOCs |
| Abuse.ch | opencti-connector-abuse | Malware bazaar, URLhaus, ThreatFox indicators |
| Shodan | opencti-connector-shodan | Internet-facing infrastructure data for observable enrichment |
| TAXII clients | Various | Connect to any TAXII 2.x collection (MS-ISAC, CIRCL, etc.) |
Start with MITRE ATT&CK and CVE as day-one connectors. They populate the technique and vulnerability taxonomy that everything else links against.
Commercial Feeds
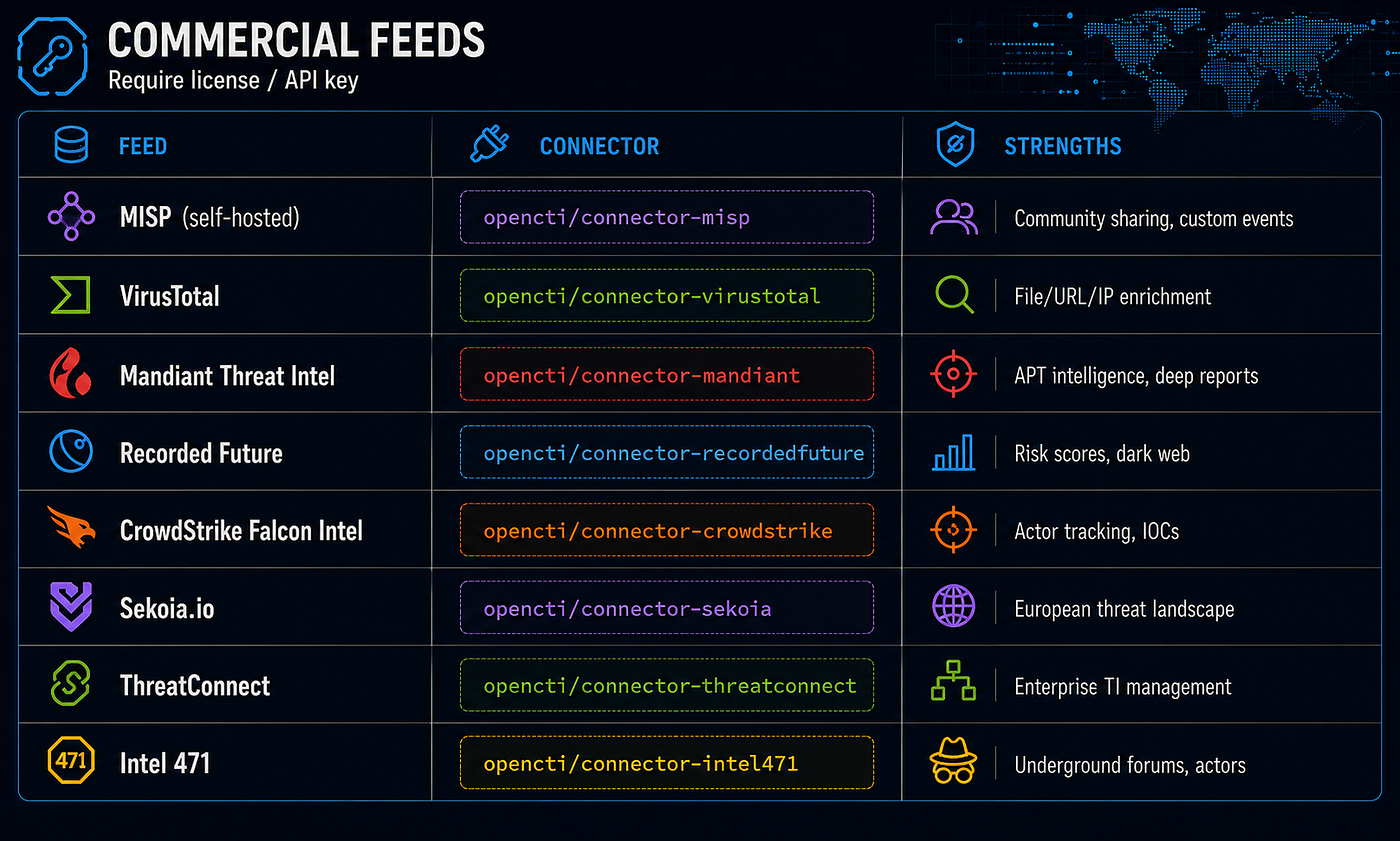
Commercial feeds require licenses or API keys but deliver deeper context, higher confidence, and faster detection of emerging threats:
- MISP (self-hosted) — Community sharing, custom events. If your organization runs a MISP instance, the bidirectional connector keeps both platforms synchronized.
- VirusTotal — File/URL/IP enrichment at scale. Automatically scores observables against 70+ AV engines.
- Mandiant Threat Intel — API intelligence with deep analyst reports. High confidence, proprietary tracking IDs.
- Recorded Future — Risk scores, dark web monitoring, predictive indicators.
- CrowdStrike Falcon — Actor tracking, IOCs from Falcon telemetry.
- Sekoia.io — European threat landscape focus.
- ThreatConnect — Enterprise TI management with playbook integration.
- Intel 471 — Underground forums, actors, and infrastructure tracking.
You don't need all of these. Start with VirusTotal (affordable API tier) and MISP if your sector has an active ISAC sharing network. Add commercial feeds as your program matures.
ISAC and Government Feeds
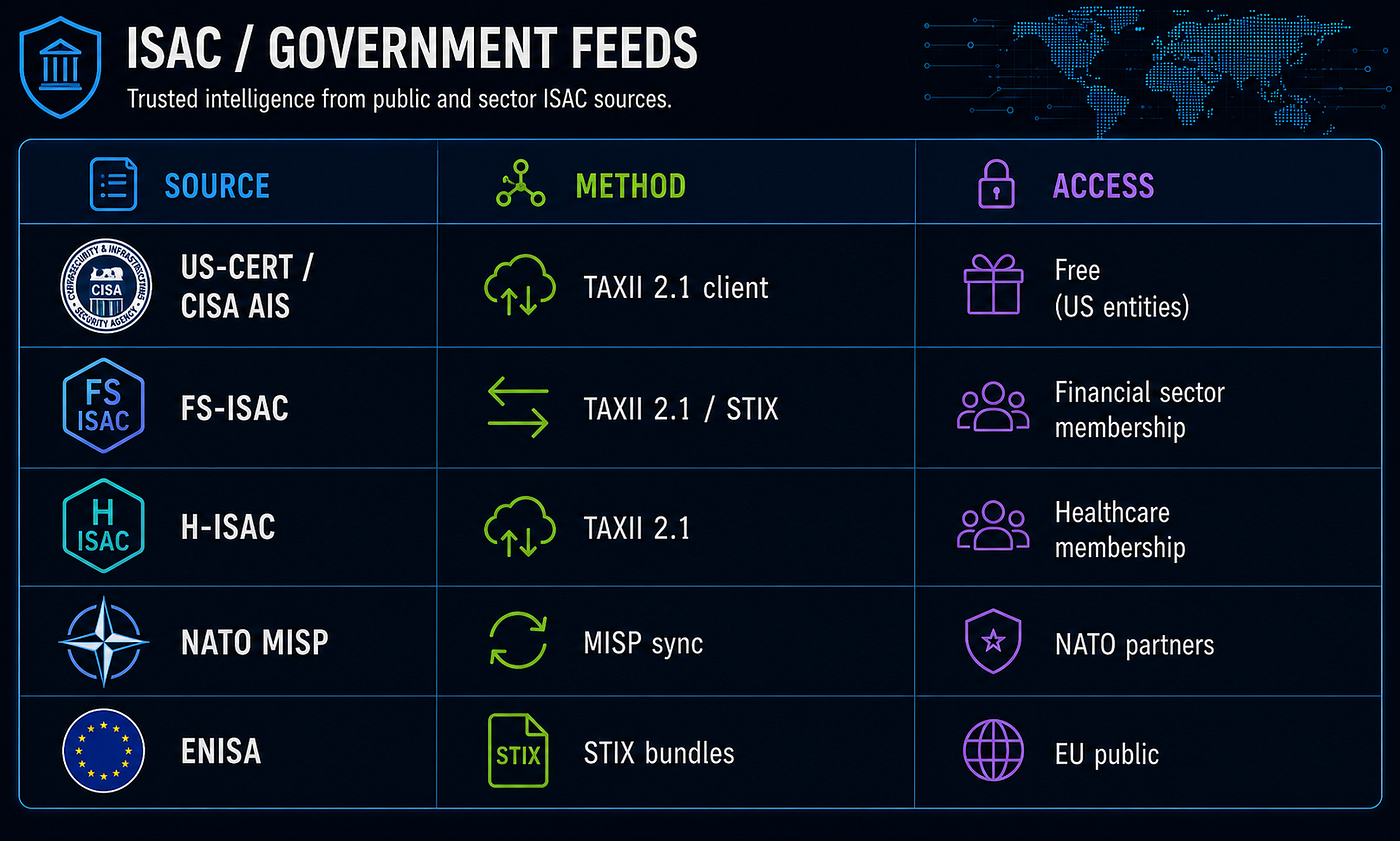
Sector-specific and government feeds carry high-confidence, operationally relevant intelligence that commercial feeds often miss:
- CISA AIS — Automated Indicator Sharing via TAXII. Free for US critical infrastructure operators.
- FS-ISAC — Financial sector threat intelligence. High relevance for banking and fintech.
- H-ISAC — Healthcare and public health sector feeds.
- NATO MISP — NATO member sharing network.
- ENISA — European Union Agency for Cybersecurity threat landscape reports.
These feeds matter most for sectors with defined regulatory and threat sharing obligations. If your organization qualifies, integrate them before turning to commercial options.
TLP Assignment by Source
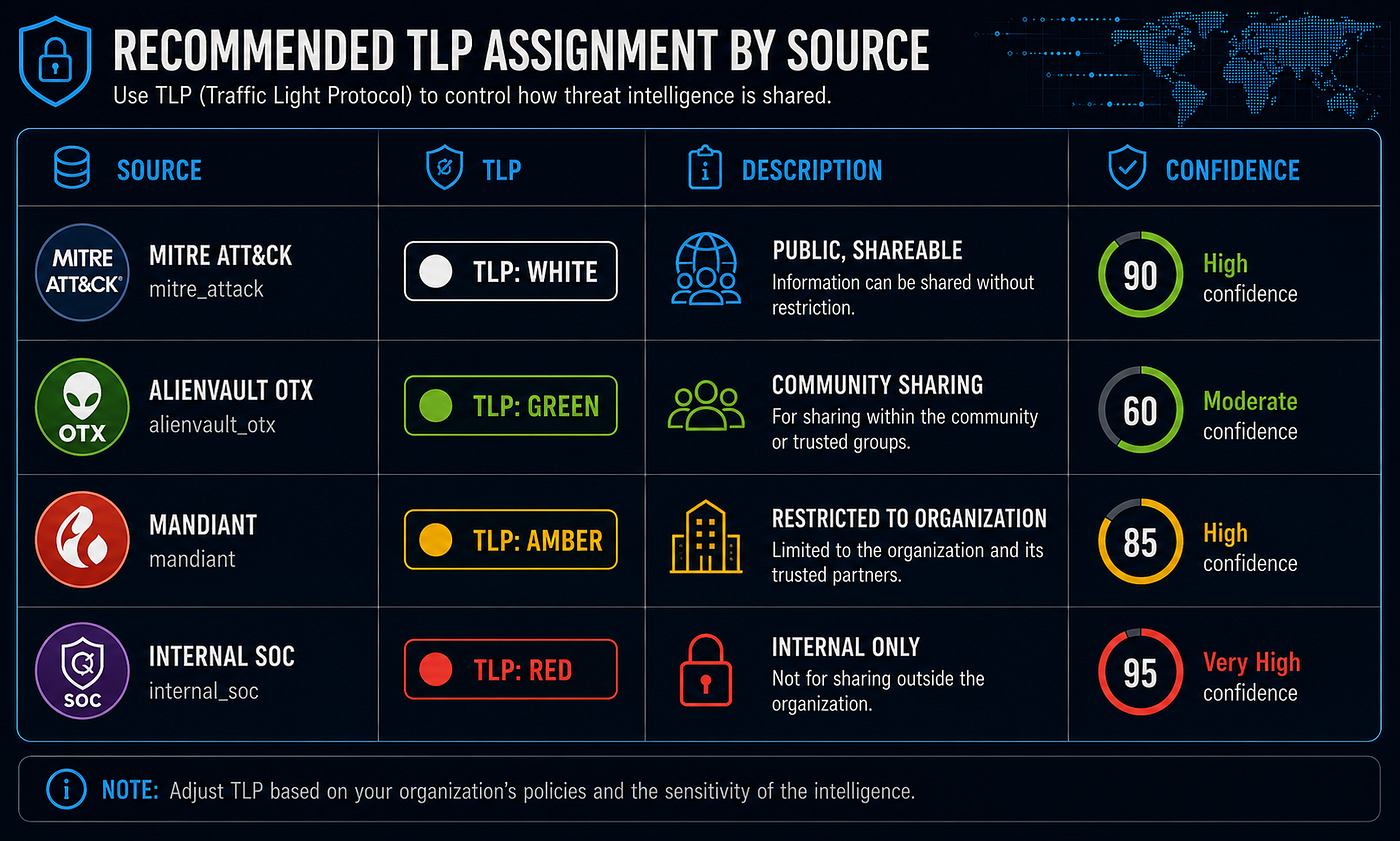
Consistent TLP assignment is critical when data from multiple sources flows into a shared platform. The recommended framework:
- TLP:WHITE (confidence 90) — MITRE ATT&CK, publicly indexed CVE data. Shareable without restriction.
- TLP:GREEN (confidence 60) — AlienVault OTX, community feeds. Share within your sector or trusted groups.
- TLP:AMBER (confidence 85) — Mandiant, commercial feeds, internal SOC. Restricted to your organization and trusted partners.
- TLP:RED (confidence 95) — Internal SOC observables, HUMINT-derived data. Internal only, no external sharing.
Configure these markings at the connector level, not per-indicator. This way every object from a given source inherits the correct marking automatically.
TLP confidence scores in the diagram reflect confidence in source reliability, not confidence in any individual indicator. Adjust based on your organization's experience with each feed.
Hardware Requirements
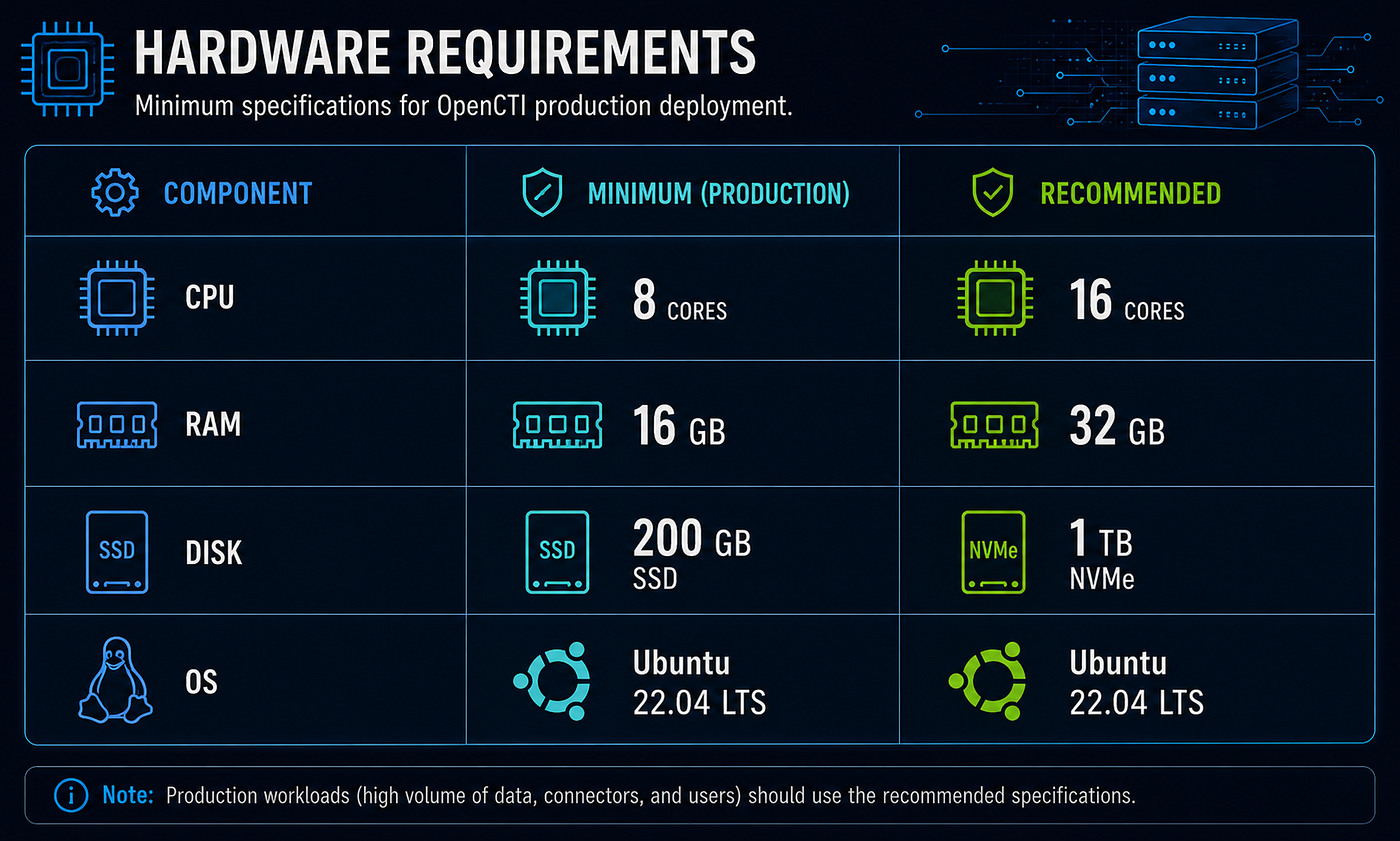
OpenCTI is not lightweight. The stack includes ElasticSearch, JanusGraph, RabbitMQ, and multiple connector workers — all running concurrently.
Minimum (lab / evaluation):
- 8 CPU cores
- 16 GB RAM
- 200 GB storage (SSD recommended)
Recommended (production or active CTI program):
- 16 CPU cores
- 32 GB RAM
- 1 TB NVMe storage
ElasticSearch is the primary memory consumer — it needs at least 8 GB heap for comfortable operation with 24K+ indicators. JanusGraph adds another 4–6 GB. Plan accordingly.
Running OpenCTI on 8 GB RAM will work for initial testing but becomes unstable as your dataset grows. ElasticSearch will OOM-kill itself under load. Allocate at least 16 GB before connecting your first production feed.
Deployment: Three Docker Compose Stacks
The deployment is organized into three Docker Compose stacks for maintainability. This separation keeps the core platform isolated from connector failures and makes upgrades easier.
Prerequisites
Verify Docker Compose V2 is installed before starting:

docker compose version
# Docker Compose version 2.40.3+ds1-0ubuntu1~24.04.1
Docker Compose V2 (the docker compose plugin, not the legacy docker-compose binary) is required. The V1 binary is no longer maintained and has networking differences that affect container-to-container communication.
Stack 1: OpenCTI Core
The core stack brings up the platform and its supporting services:
# docker-compose.core.yml
services:
  redis:
    image: redis:7.2
    restart: always
    volumes:
      - redis-data:/data

  elasticsearch:
    image: docker.elastic.co/elasticsearch/elasticsearch:8.13.0
    environment:
      - discovery.type=single-node
      - xpack.security.enabled=true
      - ELASTIC_PASSWORD=${ELASTIC_PASSWORD}
      - ES_JAVA_OPTS=-Xms4g -Xmx4g
    volumes:
      - es-data:/usr/share/elasticsearch/data
    restart: always

  minio:
    image: minio/minio:latest
    environment:
      MINIO_ROOT_USER: ${MINIO_ROOT_USER}
      MINIO_ROOT_PASSWORD: ${MINIO_ROOT_PASSWORD}
    volumes:
      - minio-data:/data
    command: server /data
    restart: always

  rabbitmq:
    image: rabbitmq:3.13-management
    environment:
      RABBITMQ_DEFAULT_USER: ${RABBITMQ_DEFAULT_USER}
      RABBITMQ_DEFAULT_PASS: ${RABBITMQ_DEFAULT_PASS}
    volumes:
      - rabbitmq-data:/var/lib/rabbitmq
    restart: always

  opencti:
    image: opencti/platform:6.x
    environment:
      - NODE_OPTIONS=--max-old-space-size=8096
      - APP__PORT=8080
      - APP__BASE_URL=${OPENCTI_BASE_URL}
      - APP__ADMIN__EMAIL=${OPENCTI_ADMIN_EMAIL}
      - APP__ADMIN__PASSWORD=${OPENCTI_ADMIN_PASSWORD}
      - APP__ADMIN__TOKEN=${OPENCTI_ADMIN_TOKEN}
      - REDIS__HOSTNAME=redis
      - ELASTICSEARCH__URL=http://elasticsearch:9200
      - MINIO__ENDPOINT=minio
      - RABBITMQ__HOSTNAME=rabbitmq
    ports:
      - "8080:8080"
    depends_on:
      - redis
      - elasticsearch
      - minio
      - rabbitmq
    restart: always

volumes:
  redis-data:
  es-data:
  minio-data:
  rabbitmq-data:
docker compose -f docker-compose.core.yml up -d
Wait for ElasticSearch to fully initialize (30–60 seconds) before starting the platform container. OpenCTI will exit and restart until ES is ready.
Stack 2: Standard Connectors
Once the core is running, the fresh dashboard looks like this:
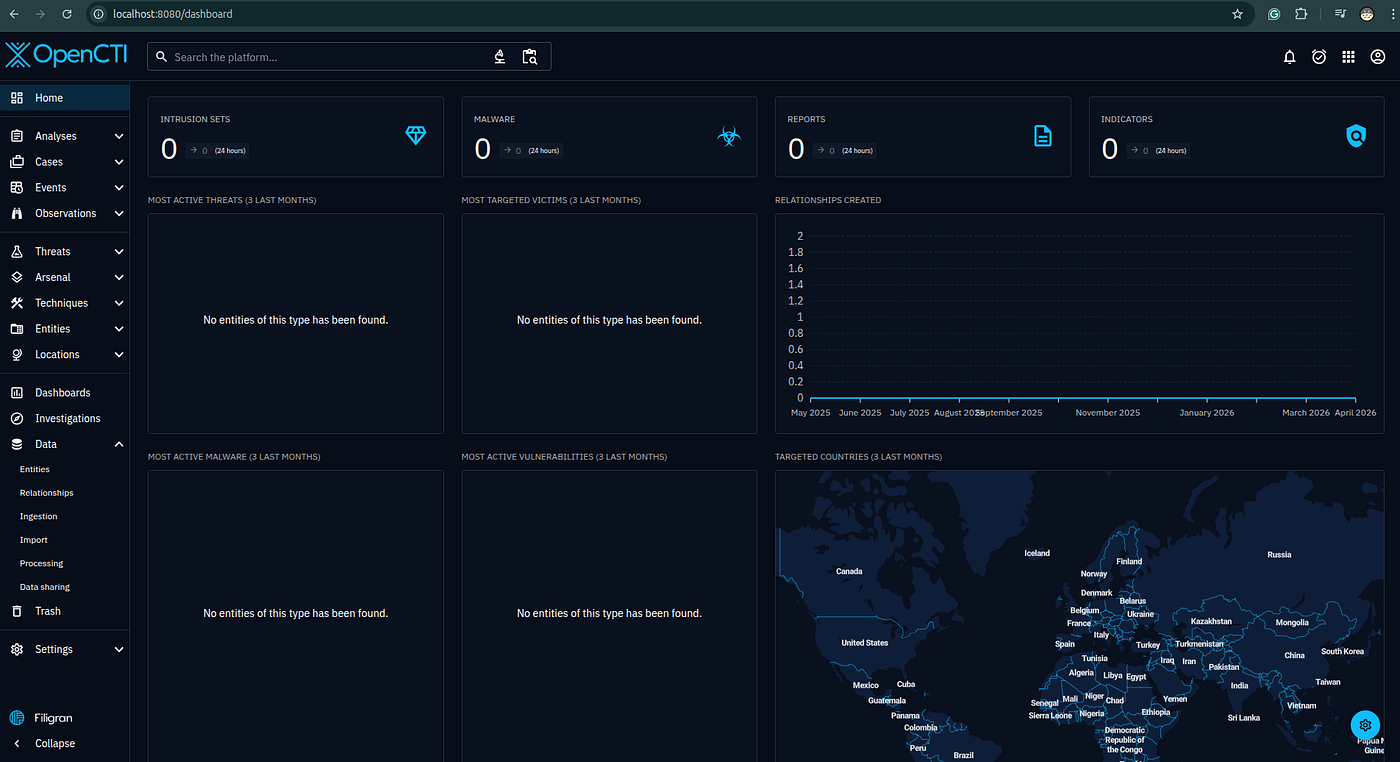
Add the standard connector stack to populate the knowledge base:
# docker-compose.connectors.yml
services:
  connector-mitre:
    image: opencti/connector-mitre:6.x
    environment:
      - OPENCTI_URL=http://opencti:8080
      - OPENCTI_TOKEN=${OPENCTI_ADMIN_TOKEN}
      - CONNECTOR_ID=${CONNECTOR_MITRE_ID}
      - CONNECTOR_TYPE=EXTERNAL_IMPORT
      - CONNECTOR_NAME=MITRE ATT&CK
      - MITRE_INTERVAL=7  # days between syncs
    restart: always

  connector-cve:
    image: opencti/connector-cve:6.x
    environment:
      - OPENCTI_URL=http://opencti:8080
      - OPENCTI_TOKEN=${OPENCTI_ADMIN_TOKEN}
      - CONNECTOR_ID=${CONNECTOR_CVE_ID}
      - CONNECTOR_NAME=CVE
      - CVE_NVD_DATA_FEED=https://nvd.nist.gov/feeds/json/cve/1.1/
      - CVE_INTERVAL=1  # daily
    restart: always

  connector-alienvault:
    image: opencti/connector-alienvault:6.x
    environment:
      - OPENCTI_URL=http://opencti:8080
      - OPENCTI_TOKEN=${OPENCTI_ADMIN_TOKEN}
      - ALIENVAULT_API_KEY=${ALIENVAULT_API_KEY}
      - ALIENVAULT_PULSE_START_TIMESTAMP=2024-01-01T00:00:00
      - ALIENVAULT_INTERVAL=24  # hours
    restart: always

  connector-abuse-threat-fox:
    image: opencti/connector-abuse-threat-fox:6.x
    environment:
      - OPENCTI_URL=http://opencti:8080
      - OPENCTI_TOKEN=${OPENCTI_ADMIN_TOKEN}
      - ABUSEIPDB_INTERVAL=24
    restart: always

networks:
  default:
    external: true
    name: opencti_default
docker compose -f docker-compose.connectors.yml up -d
Stack 3: AI Enrichment
The AI enrichment connector runs as its own stack. This keeps the Anthropic API key isolated and makes it easy to restart the enrichment pipeline independently.
# docker-compose.ai.yml
services:
  connector-claude-enrichment:
    image: opencti/connector-claude-enrichment:latest
    build:
      context: ./connectors/claude-enrichment
    environment:
      - OPENCTI_URL=http://opencti:8080
      - OPENCTI_TOKEN=${OPENCTI_ADMIN_TOKEN}
      - CONNECTOR_ID=${CONNECTOR_CLAUDE_ID}
      - ANTHROPIC_API_KEY=${ANTHROPIC_API_KEY}
      - CLAUDE_MODEL=claude-haiku-4-5-20251001
      - CONNECTOR_SCOPE=text/html,application/pdf
      - CONNECTOR_AUTO=true
    restart: always

networks:
  default:
    external: true
    name: opencti_default
docker compose -f docker-compose.ai.yml up -d
Use claude-haiku-4-5-20251001 for enrichment tasks that run continuously against every ingested report. Haiku's cost-per-token is significantly lower than Sonnet for high-volume, structured extraction tasks. Switch to claude-sonnet-4-6 for manual enrichment of high-priority reports where deeper analysis justifies the cost.
Connector Configuration
After deploying the connector stacks, the platform's connector management view shows registered workers:
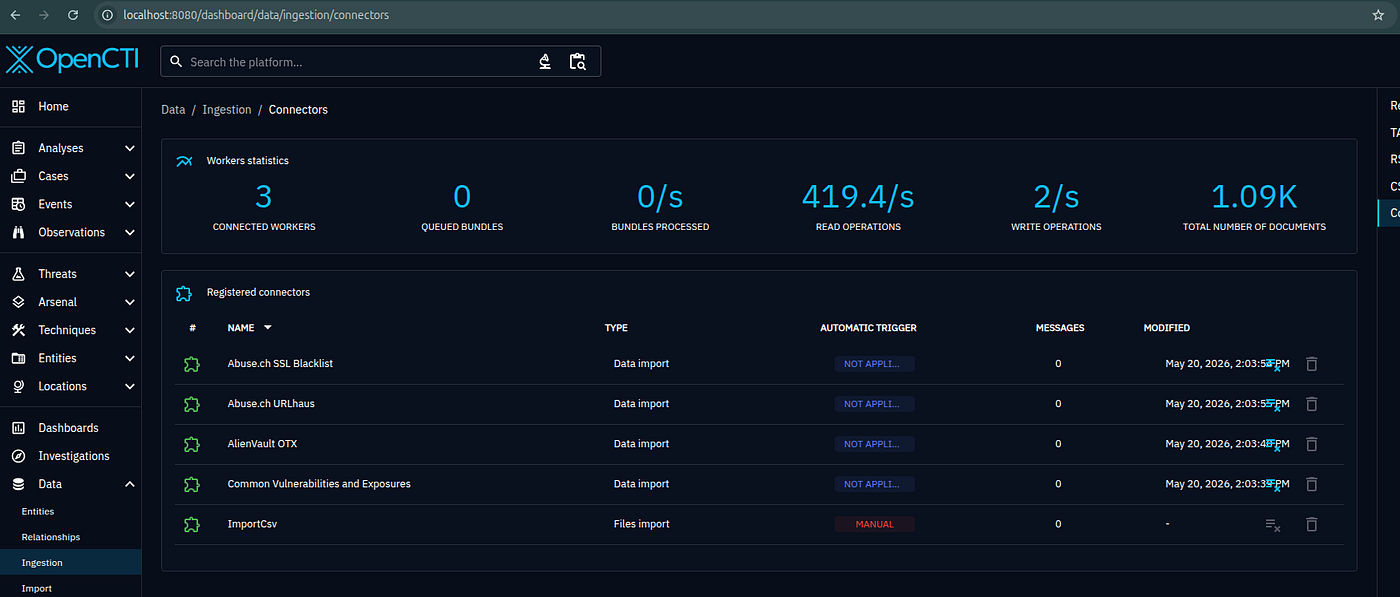
Each connector appears with:
- Worker status — green (active), red (disconnected), or yellow (idle)
- Last run timestamp
- Ingested objects count
- Error log access
Key connector operational notes:
- MITRE ATT&CK runs once weekly. The full ATT&CK dataset is large (1,500+ techniques) and changes infrequently — daily runs waste compute for no gain.
- CVE connector runs daily. New CVEs are published continuously and are often linked to active exploitation within 24–72 hours of disclosure.
- AlienVault OTX interval depends on your sector. If you're tracking active campaigns, 6–12 hours is appropriate. For longer-term strategic intelligence, 24 hours is fine.
- The Claude enrichment connector runs on-demand against newly imported reports. It doesn't poll on a timer — it responds to RabbitMQ events when new text/HTML or PDF content arrives.
AI Enrichment: The Claude Connector
The Claude connector is what separates this platform from a standard OpenCTI deployment. It connects directly to the Anthropic API to analyze incoming reports and extract structured intelligence automatically.
What Claude Extracts and How It Maps to STIX
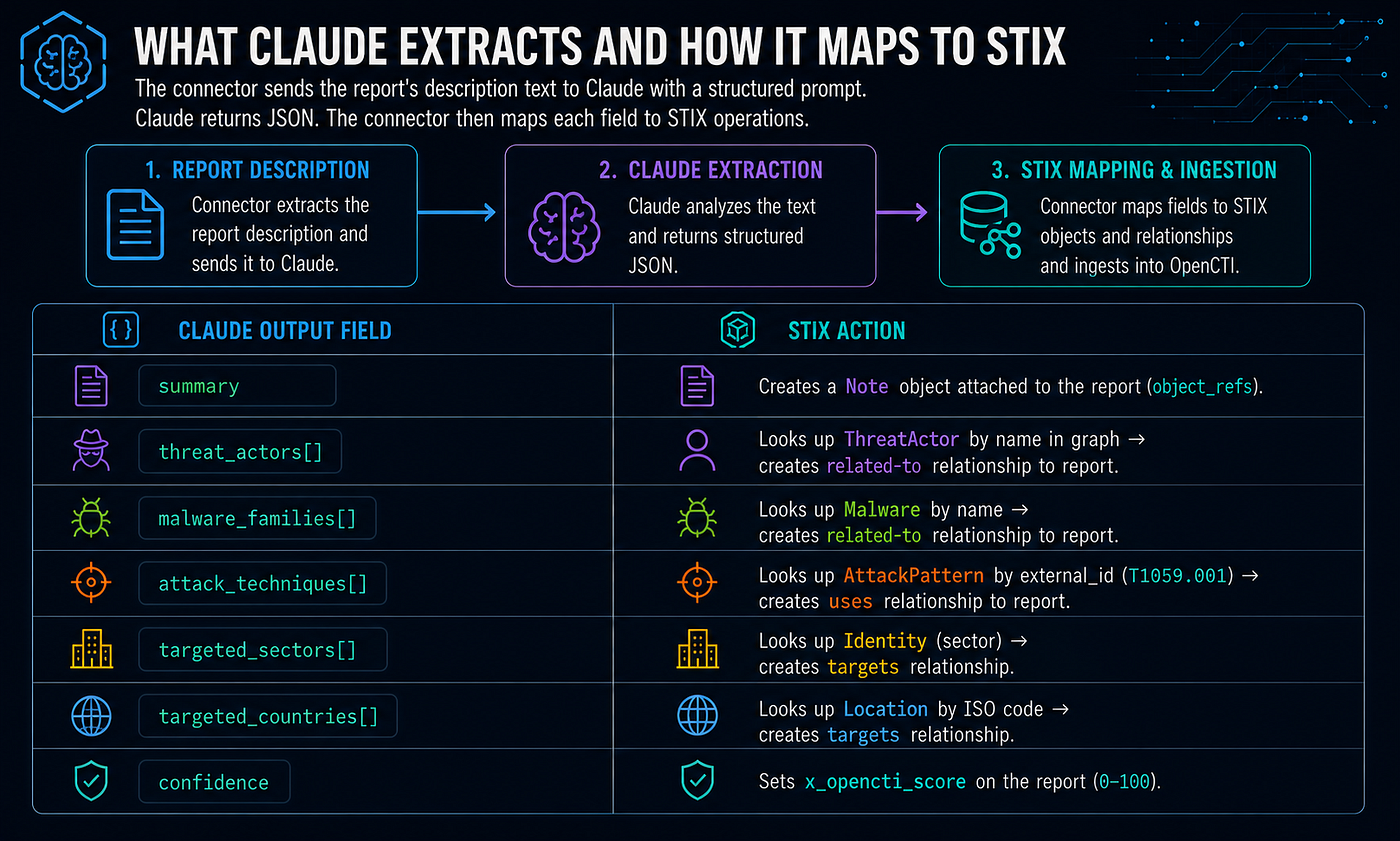
The extraction pipeline runs in three stages:
Stage 1: Entity Extraction
Claude reads the raw report text and identifies:
- Threat actor names and aliases
- Malware families and tool names
- IP addresses, domains, file hashes, URLs
- MITRE ATT&CK technique references (e.g., "T1566.001 — Spearphishing Attachment")
- Vulnerability identifiers (CVE-YYYY-NNNNN)
- Campaign names and operation codenames
- Victim sectors and geographies
Stage 2: Relationship Inference
From the extracted entities, Claude infers typed STIX relationships:
[ThreatActor] → uses → [Malware][Malware] → uses → [AttackPattern][ThreatActor] → targets → [Sector/Country][Campaign] → attributed-to → [ThreatActor][Indicator] → indicates → [ThreatActor]
Stage 3: STIX Object Creation
The connector writes the extracted entities and relationships back to OpenCTI as native STIX 2.1 objects via the GraphQL API. Every object includes:
- Source reference to the originating report
- Confidence score (derived from Claude's extraction confidence)
- TLP marking inherited from the source
- Creation timestamp
The connector code uses the pycti library:
from pycti import OpenCTIConnectorHelper, OpenCTIApiClient
import anthropic

class ClaudeEnrichmentConnector:
    def __init__(self):
        self.helper = OpenCTIConnectorHelper(config)
        self.client = anthropic.Anthropic(api_key=config["anthropic_api_key"])
        self.model = config.get("claude_model", "claude-haiku-4-5-20251001")

    def _extract_entities(self, report_text: str) -> dict:
        message = self.client.messages.create(
            model=self.model,
            max_tokens=4096,
            messages=[{
                "role": "user",
                "content": EXTRACTION_PROMPT.format(report=report_text)
            }]
        )
        return json.loads(message.content[0].text)

    def _create_stix_objects(self, entities: dict, report_id: str):
        for actor in entities.get("threat_actors", []):
            stix_actor = self.helper.api.threat_actor.create(
                name=actor["name"],
                aliases=actor.get("aliases", []),
                confidence=actor.get("confidence", 50),
                objectMarking=self.default_marking
            )
            # Create relationships to report
            self.helper.api.stix_core_relationship.create(
                fromId=report_id,
                toId=stix_actor["id"],
                relationship_type="mentions"
            )
The extraction prompt matters as much as the model choice. Structuring it to return JSON with typed entity arrays (not free text) makes the downstream STIX conversion deterministic.
This connector enriches reports automatically — it does not replace analyst judgment. Extracted relationships should be treated as leads for investigation, not confirmed attribution. Claude's confidence scores signal extraction reliability, not attribution confidence. See the Customer-Driven AI CTI project for more on responsible AI integration in CTI workflows.
Inference Rules
OpenCTI includes a built-in inference engine that automatically creates relationships based on logical rules. These run continuously as new data arrives.
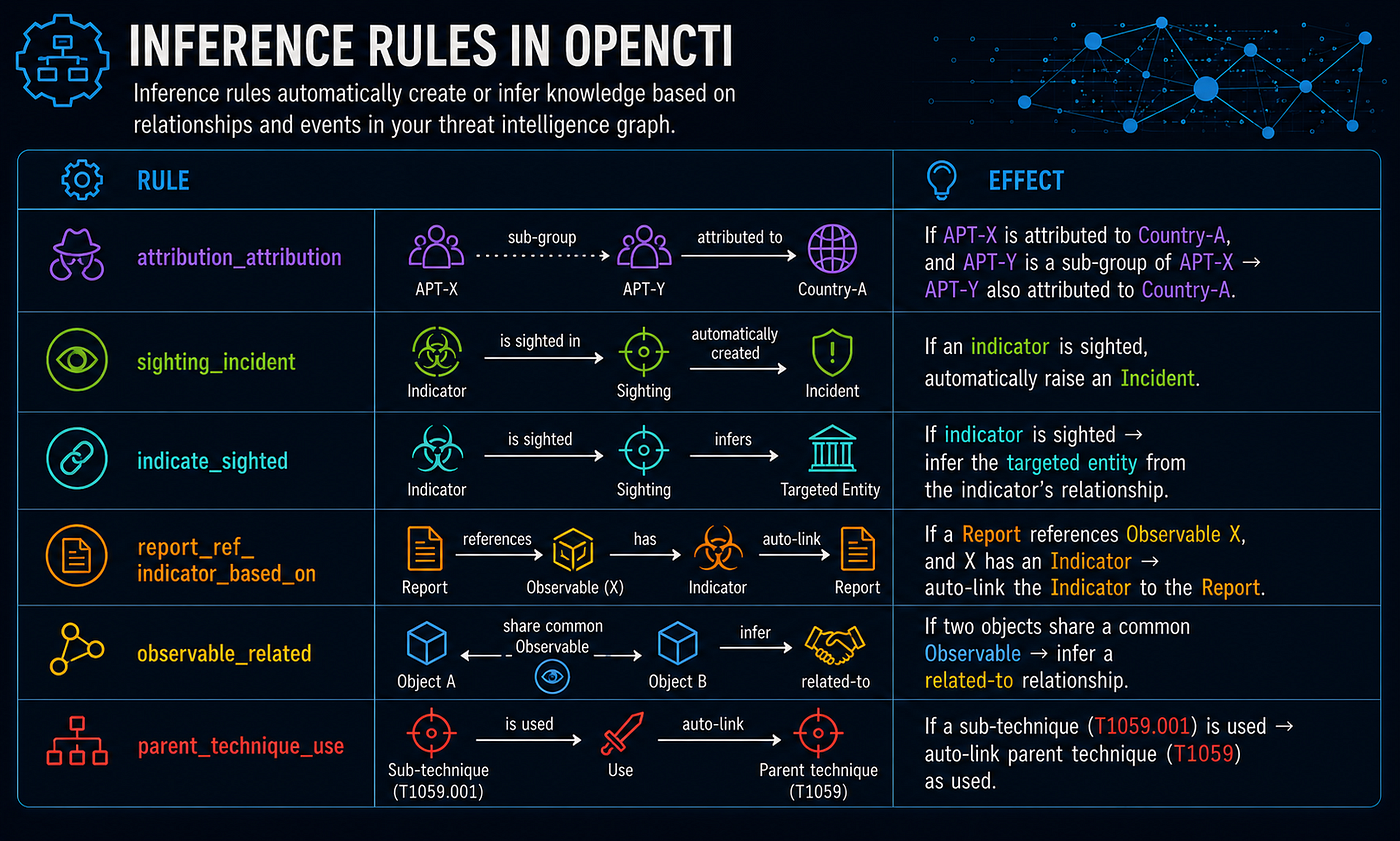
The active inference rules and what they do:
attribution_attribution — Transitive attribution. If APT-X is attributed to Country-A, and APT-Y is a sub-group of APT-X, then APT-Y is automatically attributed to Country-A.
sighting_incident — If an indicator is sighted, an incident is automatically created and linked to that sighting event.
indicate_sighted — If an indicator is sighted, the targeted entity from the indicator's definition is automatically linked to the sighting. This closes the loop between "we saw this IP" and "this IP belongs to this actor's campaign."
report_ref_indicator_based_on — If a report references observable X, auto-link the observable to the report's indicator objects.
observable_value — If two observable objects share a value (e.g., same domain, same hash), auto-link them as related-to.
parent_technique_use — If a sub-technique (e.g., T1059.001) is used, automatically infer use of the parent technique (T1059). Keeps ATT&CK coverage accurate without manual mapping.
Enable all inference rules after your first data load. The attribution_attribution rule in particular surfaces relationships that would otherwise require manual analyst effort to identify.
Security Hardening
OpenCTI's default configuration is optimized for ease of setup, not production security. Before exposing the platform to your network or connecting sensitive feeds, apply the security checklist.
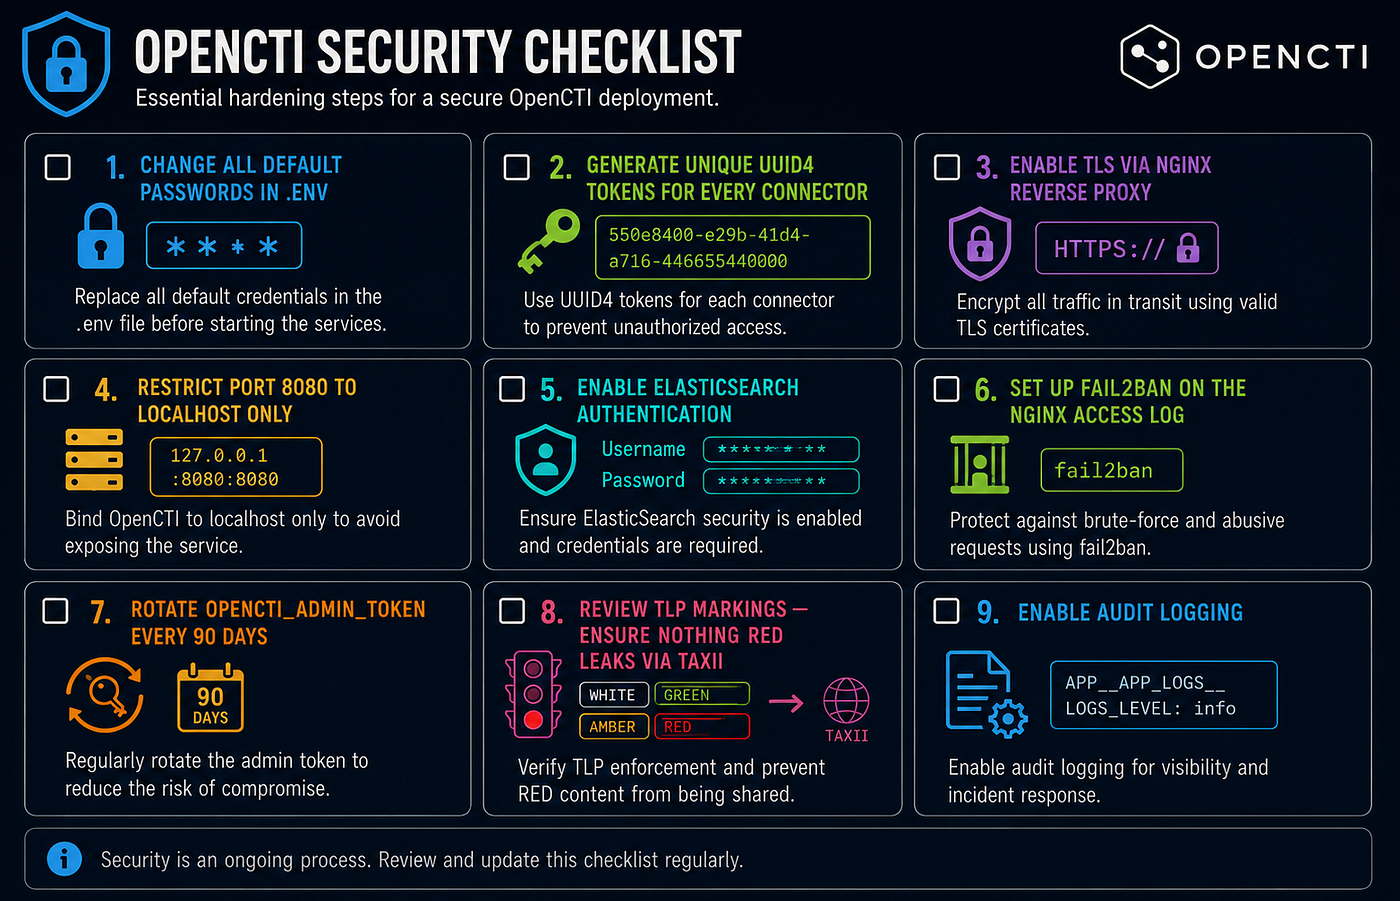
1. Change default credentials immediately The default admin email and password must be changed before any connector is configured. Connectors store the admin token — if it's compromised, an attacker has full API access.
# Generate a secure random token for OPENCTI_ADMIN_TOKEN
openssl rand -hex 32
2. Enable HTTPS Run OpenCTI behind a reverse proxy (nginx or Traefik) with TLS. Never expose port 8080 directly to untrusted networks.
server {
    listen 443 ssl;
    server_name opencti.internal.example.com;
    ssl_certificate /etc/ssl/certs/opencti.crt;
    ssl_certificate_key /etc/ssl/private/opencti.key;
    location / {
        proxy_pass http://127.0.0.1:8080;
        proxy_set_header Host $host;
        proxy_set_header X-Real-IP $remote_addr;
    }
}
3. Enable ElasticSearch authentication
Set xpack.security.enabled=true and configure the ELASTIC_PASSWORD environment variable. An unauthenticated ElasticSearch instance exposes your entire threat intelligence database.
4. Restrict RabbitMQ management interface By default, the RabbitMQ management UI runs on port 15672. Bind it to localhost only or restrict access via firewall rules. Connector credentials in RabbitMQ are as sensitive as API keys.
5. Use secrets management
Store credentials in Docker secrets or a vault, not .env files on disk. At minimum, ensure .env files are not readable by other users:
chmod 600 .env
6. Configure TLP markings at the platform level
Set a default TLP marking for all objects created without an explicit marking. TLP:AMBER is a safe default for internally generated intelligence.
7. Enable audit logging OpenCTI logs all API actions. Route these logs to your SIEM. Failed login attempts and unexpected API calls are early indicators of platform compromise.
8. Restrict network access The OpenCTI API and UI should not be internet-accessible. Place it on an internal network segment. If remote access is required, use a VPN or jump host.
9. Regular backups Snapshot ElasticSearch indices and MinIO buckets daily. A corrupted ES index without a backup means rebuilding months of enriched intelligence from scratch.
Monitoring and Operations
A running platform needs operational visibility. Monitor these metrics to catch problems before they affect intelligence quality.
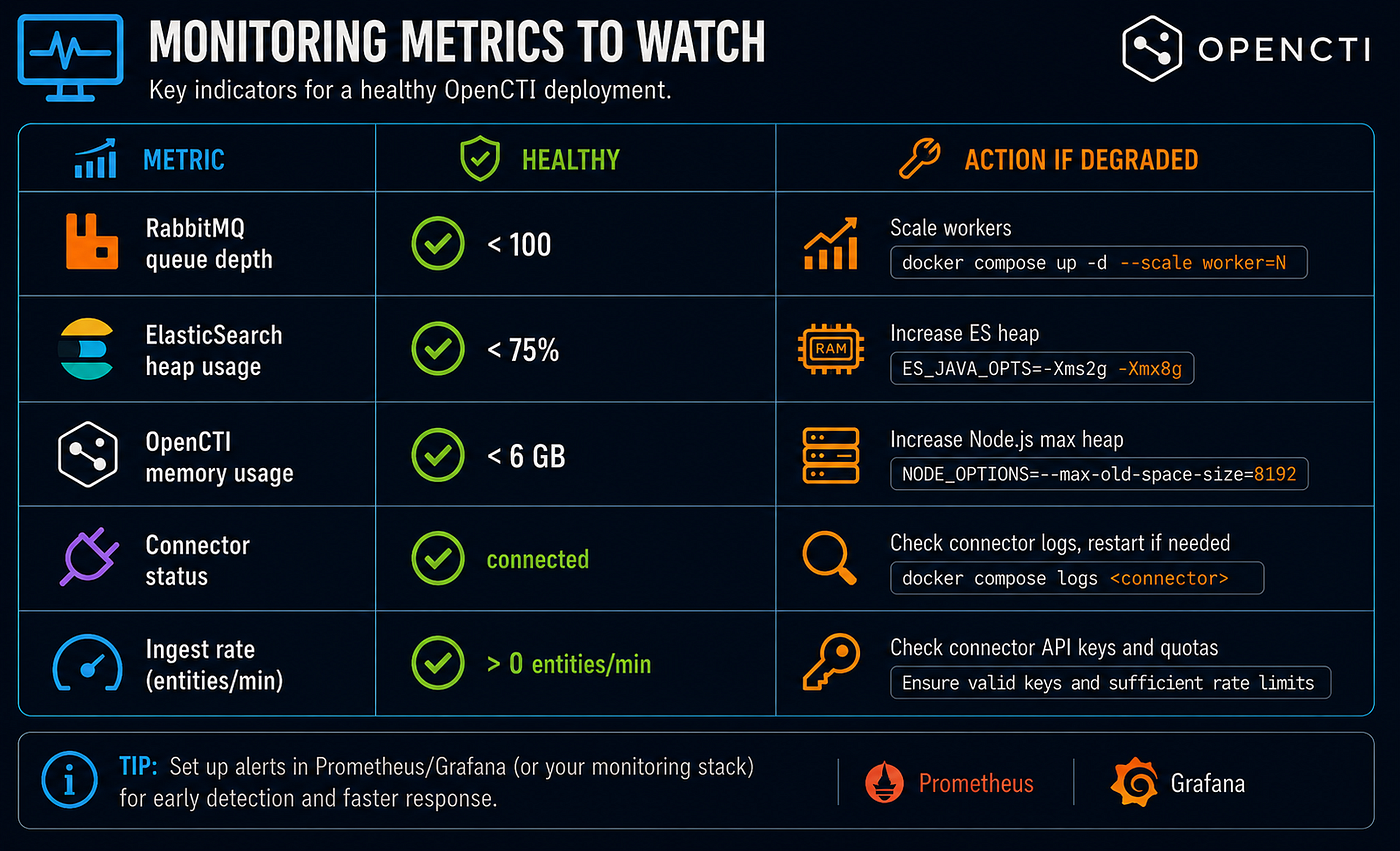
RabbitMQ queue depth — Each connector has a dedicated queue. If a connector crashes, its queue fills up. Check queue depth via the RabbitMQ management UI at :15672. A queue depth growing unboundedly means a connector is stopped or broken.
ElasticSearch heap usage — ES heap usage above 75% triggers frequent GC pauses that slow all queries. If heap consistently exceeds 75%, increase ES_JAVA_OPTS=-Xms4g -Xmx4g to a higher value (requires enough host RAM to support it).
Platform memory — The OpenCTI Node.js process is configured with NODE_OPTIONS=--max-old-space-size=8096. If the process is hitting this limit, you'll see OOM errors in the container logs.
Connector status — Check the connectors dashboard (see Connector Configuration) daily. A red connector status means no intelligence is flowing from that source.
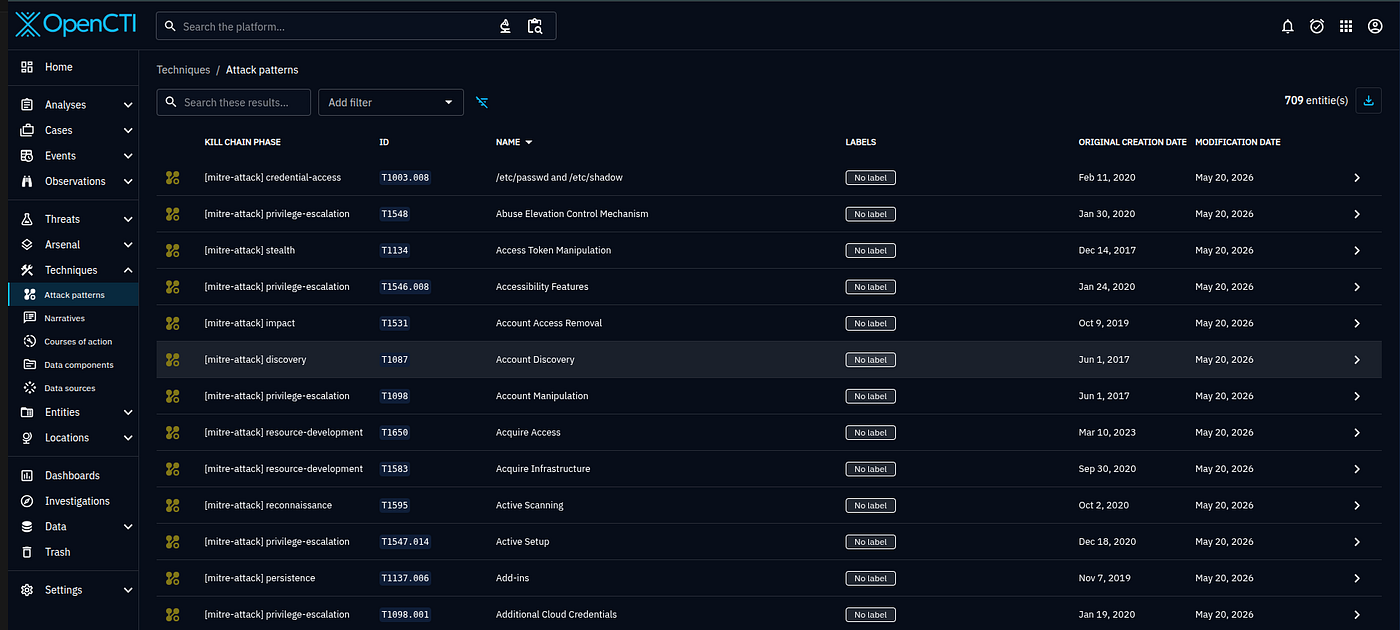
A healthy platform with MITRE ATT&CK loaded shows 700+ attack pattern entities. The list above confirms the MITRE connector ran successfully and all techniques are indexed.
Real Investigation Workflows
Platform setup is a means to an end. Here's how the platform supports real CTI investigation workflows.
Threat Actor Investigation
When a new actor surfaces in reporting, OpenCTI becomes the single pivot point for everything known about them.
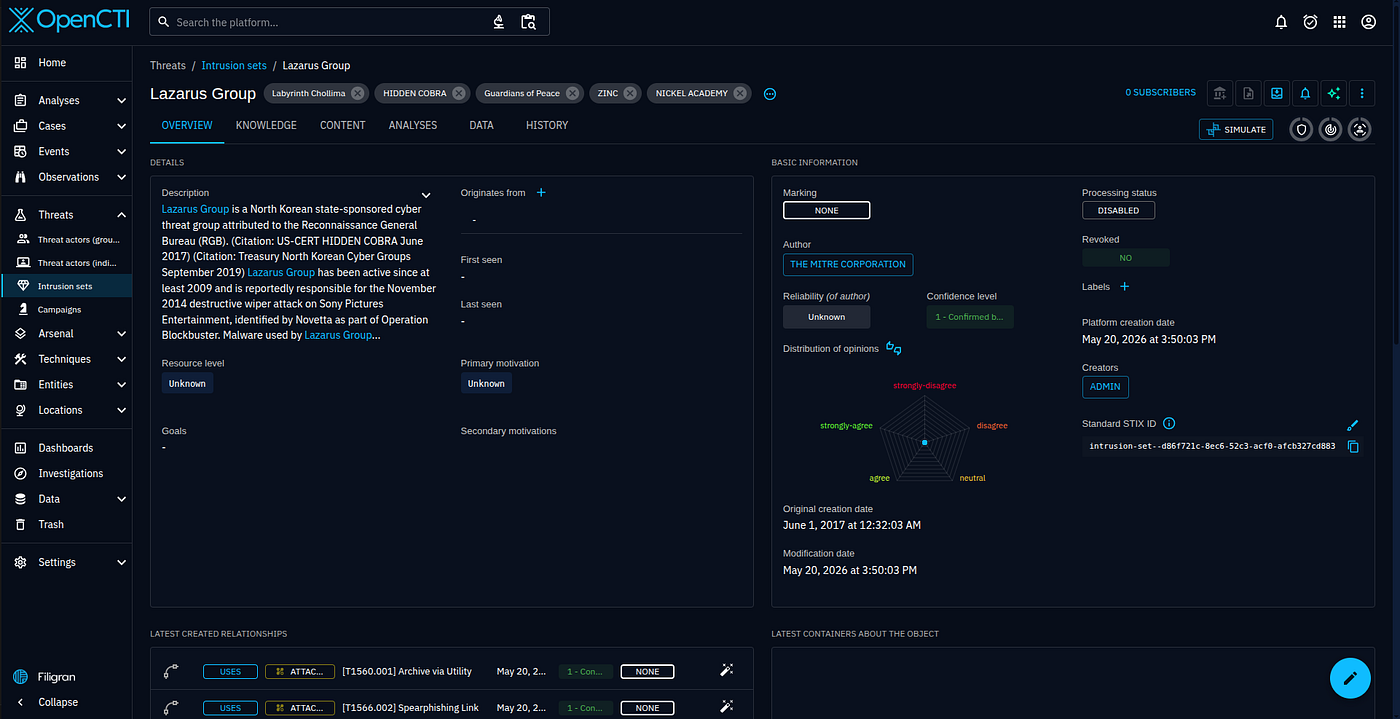
A fully enriched threat actor profile includes:
- Aliases and alternative names
- Attributed origin country
- Campaigns and operations attributed to this actor
- Arsenal: malware families and tools used
- ATT&CK techniques mapped from reporting
- Observed infrastructure: domains, IPs, certificates
- Targeted sectors and geographies
- Source reports with confidence scoring
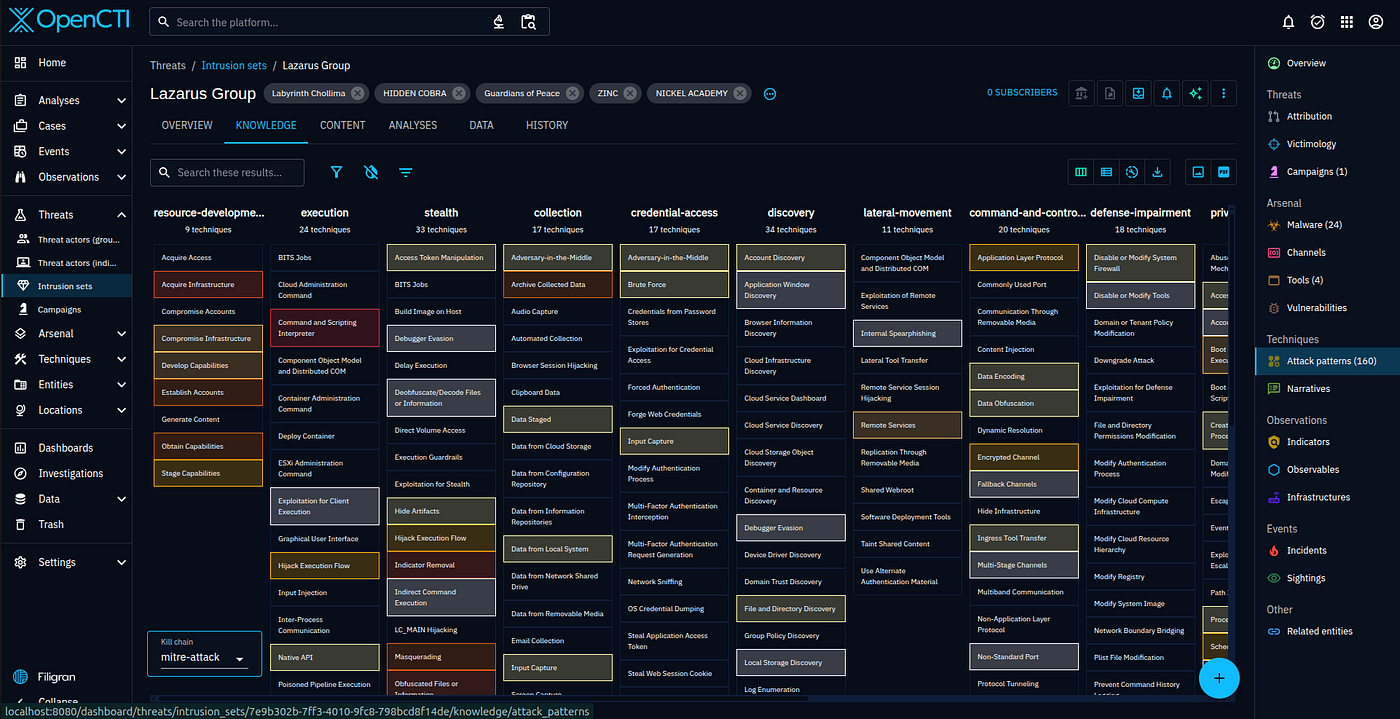
The knowledge graph view makes attribution chains immediately readable. In the Lazarus Group graph above, you can trace relationships between the actor, their sub-groups, specific campaigns, malware families, and targeted sectors — all in a single view.
This is directly applicable to the actor profiles in the Israel Threat Actors CTI project. Actors like MuddyWater, OilRig, and APT42 maintain exactly this kind of structured profile — but with the OpenCTI platform as the operational backend, those profiles become queryable and correlation-ready.
Report Ingestion and Analysis
The platform can automatically ingest PDF reports as STIX Report objects:
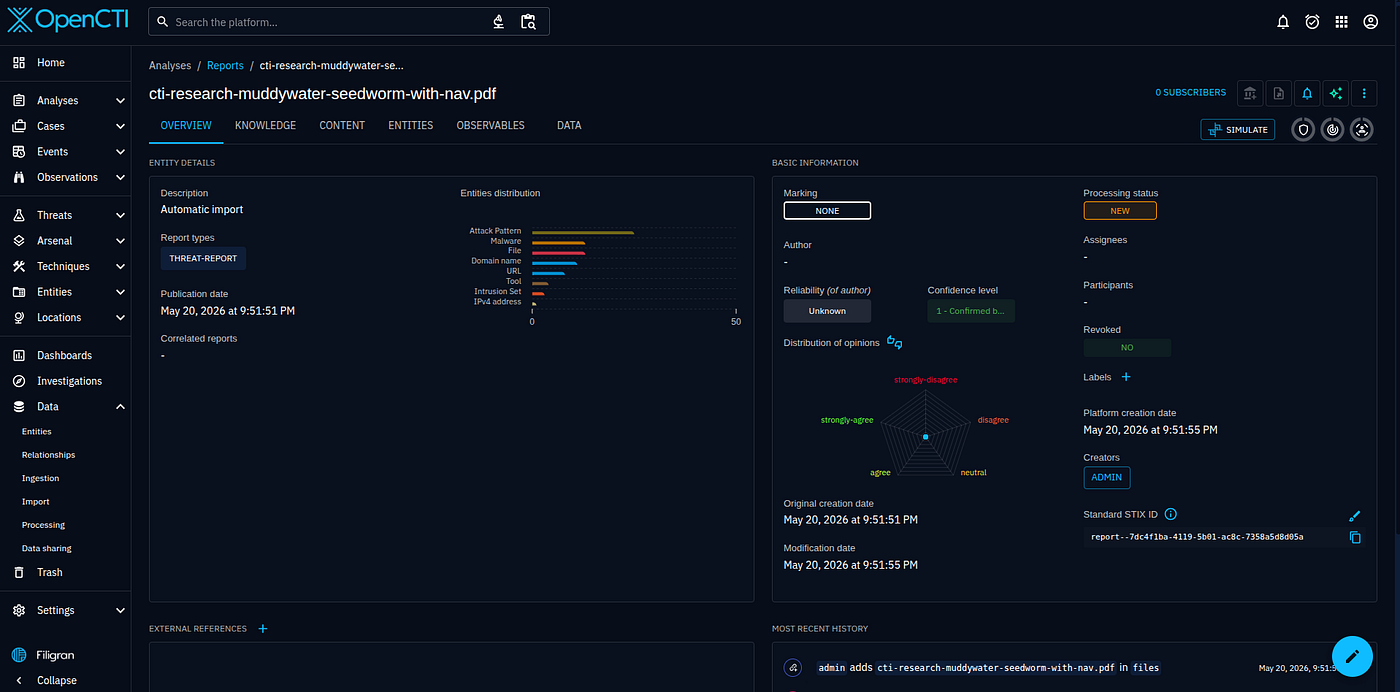
In the example above, a MuddyWater/Seedworm PDF research report was automatically imported via connector. The report object includes:
- Entity distribution chart (malware, attack patterns, domains, intrusion sets)
- Publication date, confidence level, and TLP marking
- STIX ID for programmatic reference
- Linked entities extracted from content
After the Claude enrichment connector processes this report, every entity mentioned in the PDF becomes a linked STIX object. An analyst reviewing the report doesn't need to manually extract IOCs — they click through to the pre-built relationship graph.
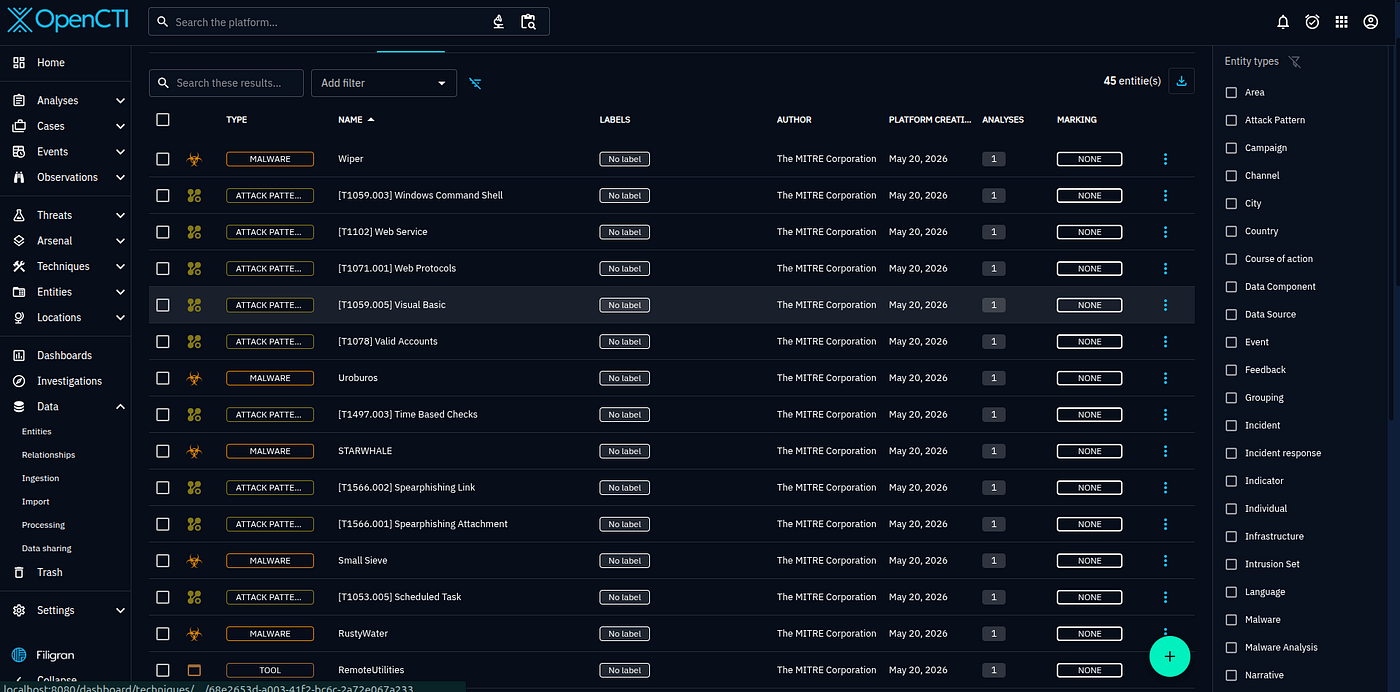
With 1,510 ATT&CK techniques loaded, every technique referenced in an ingested report links to the full technique definition — including mitigations, detection guidance, and which other actors in the platform use the same technique.
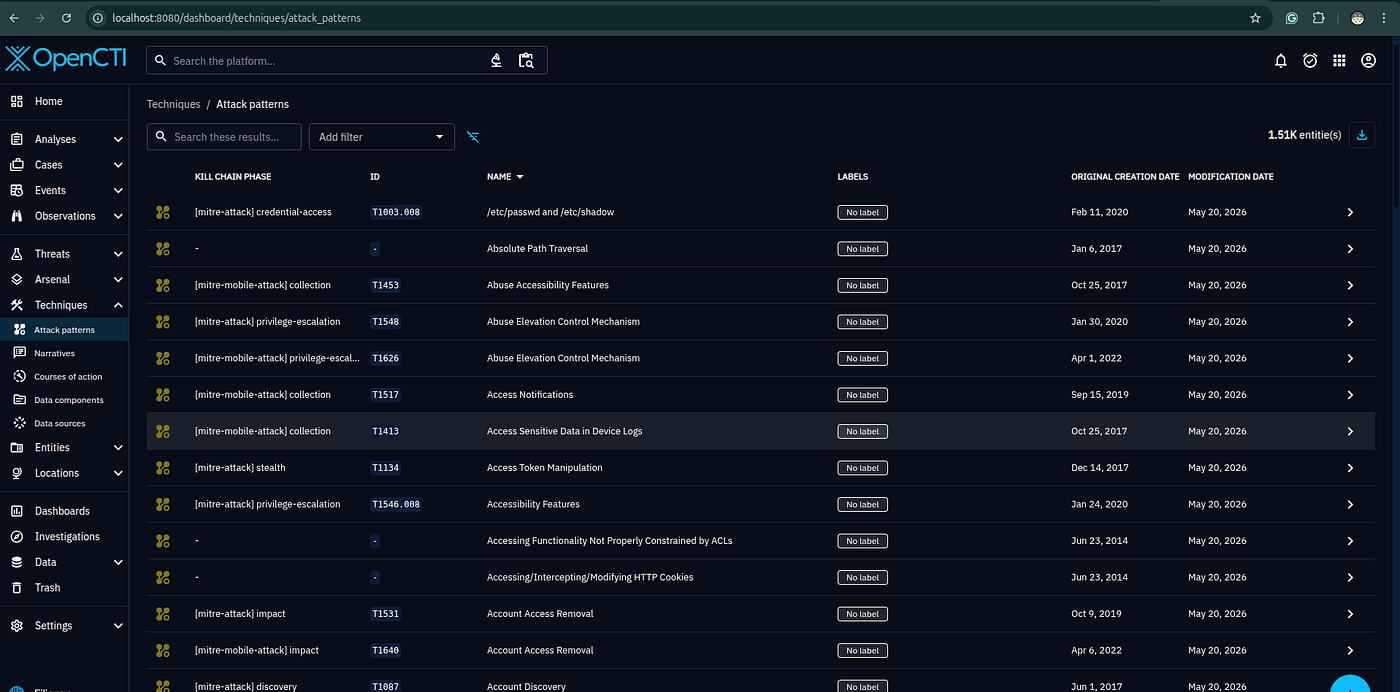
The attack patterns dashboard provides a campaign-level view of TTPs. Which kill-chain phases are most active across your current ingested reporting? Which techniques appear across multiple actors? This is the kind of cross-source correlation that takes hours manually and seconds in a structured platform.
IOC Pivoting and Attribution
When a suspicious IOC surfaces — from a SIEM alert, an EDR detection, or an analyst tip — OpenCTI is the pivot point to answer: what do we know about this?
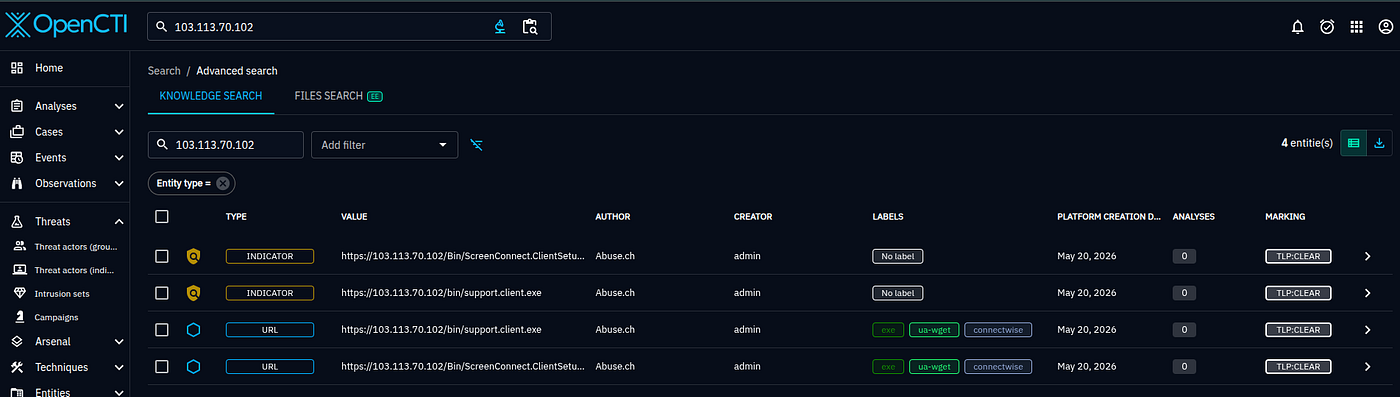
Searching for IP 103.113.70.102 returns four linked entities:
- Two indicators (from Abuse.ch)
- Two URLs sharing this IP as their host infrastructure
- Labels:
connectwise,us-wgrt— suggesting this infrastructure is related to ConnectWise RAT deployments
From here an analyst can pivot to the associated malware family, the campaign, and the actor — all without leaving the platform.
For programmatic IOC lookups, the GraphQL API provides the same data:
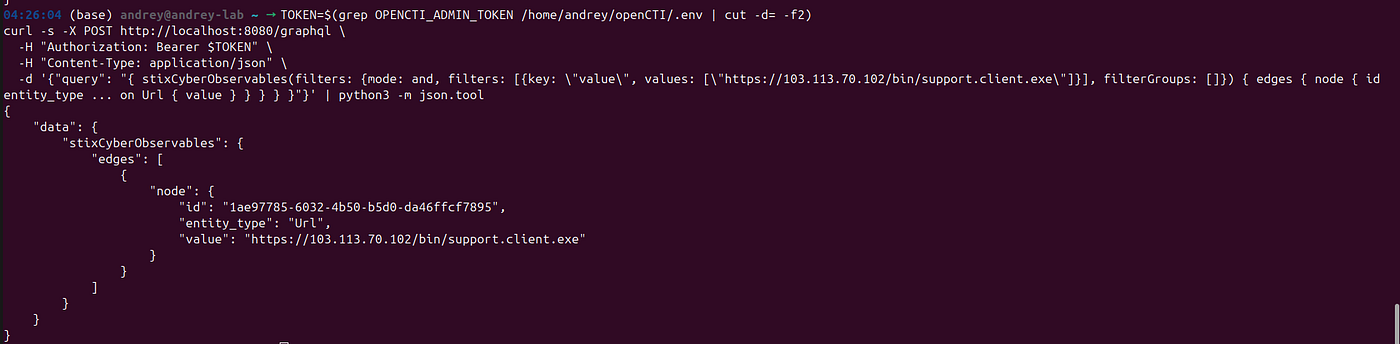
TOKEN=$(grep OPENCTI_ADMIN_TOKEN /home/andrey/openCTI/.env | cut -d= -f2)
curl -s -X POST http://localhost:8080/graphql \
  -H "Authorization: Bearer $TOKEN" \
  -H "Content-Type: application/json" \
  -d '{"query": "{ stixCyberObservables(filters: {mode: and, filters: [{key: \"value\", values: [\"https://103.113.70.102/bin/support.client.exe\"]}], filterGroups: []}) { edges { node { id entity_type value } } } }"}' \
  | python3 -m json.tool
This returns the STIX ID, entity type, and value — usable in SOAR playbooks, detection rules, or custom dashboards.
Vulnerability Research
CVE search enables rapid cross-referencing of vulnerabilities against active campaigns:
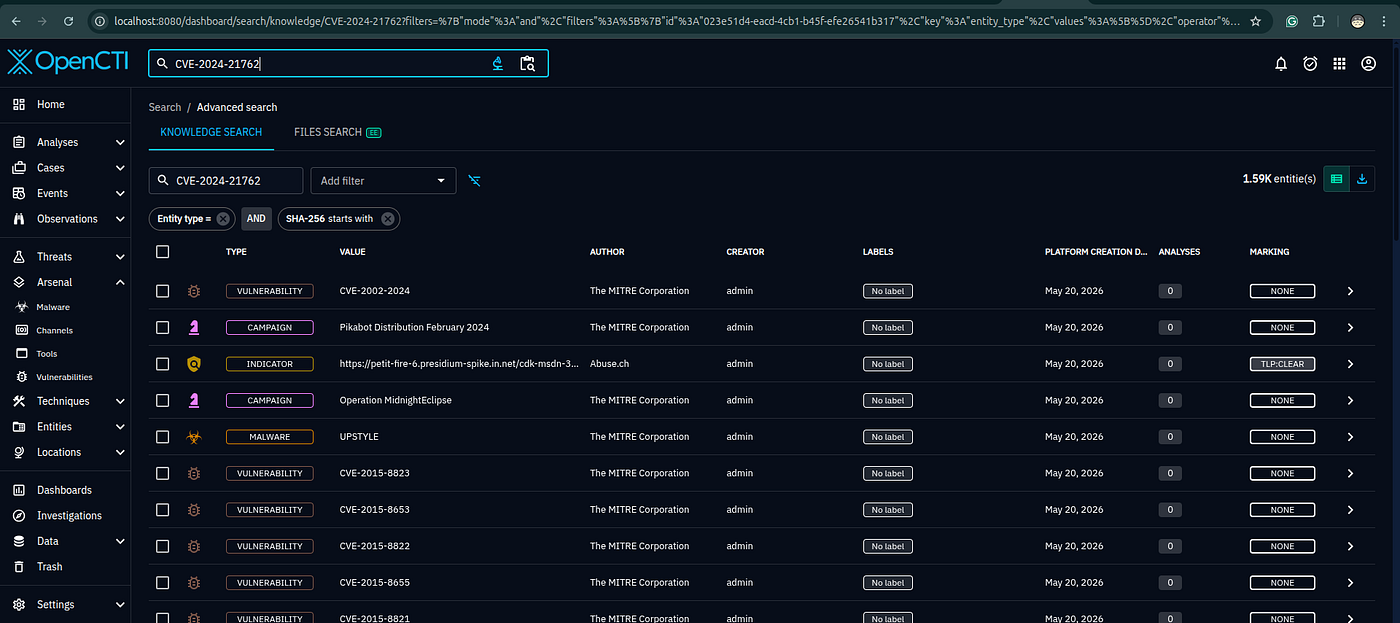
Searching for CVE-2024-21762 (Fortinet FortiOS auth bypass, actively exploited) returns 1,590 related entities:
- The vulnerability object with CVSS score and affected versions
- Campaign: Midnight Eclipse (the exploitation campaign name)
- Malware: UPSTYLE (the backdoor deployed via this CVE)
- Indicators linked to exploitation infrastructure
- Cross-references to the Pikabot distribution campaign
This is the difference between a flat vulnerability scanner result and structured threat intelligence. A CVE in OpenCTI tells you not just what is vulnerable, but who is exploiting it, how, and what infrastructure they're using.
For practitioner context on how vulnerabilities fit into the broader detection workflow, see the CTI Analyst Field Manual and the AI vs Defense research on vulnerability exploitation timelines.
Incident Response Integration
When an incident is triggered, OpenCTI can serve as the intelligence backbone for response:
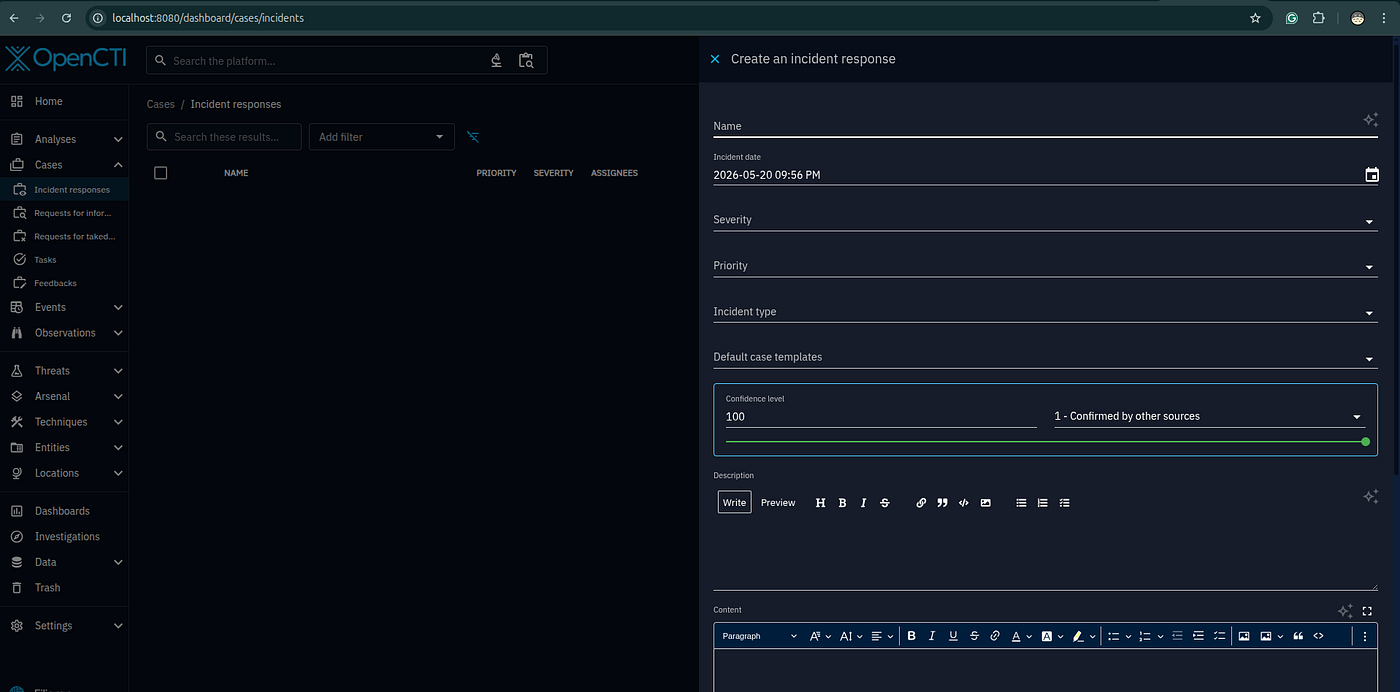
Creating an incident response case links:
- The triggering observable (IOC from the alert)
- All related threat intelligence (actor, campaign, TTPs)
- Evidence artifacts and report references
- Confidence level for each linked piece of intelligence
This gives the response team immediate context: this alert matches infrastructure used by Actor X in Campaign Y, which targets your sector using techniques T1566 and T1055.
Identity-centric incidents benefit particularly from this integration. If the triggering alert is an identity anomaly — a privileged account behaving unexpectedly, a Kerberos anomaly, a suspicious OAuth token — the linked threat intelligence immediately surfaces whether this matches known actor TTPs. See the ITDR knowledge base for detection engineering guidance on identity threat scenarios.
Integrating with the CTI Ecosystem
OpenCTI is most powerful as one layer in a connected intelligence workflow, not as a standalone tool. Here's how it connects to the broader practitioner ecosystem:
CTI Analyst Field Manual — The methodological framework that OpenCTI operationalizes. The field manual covers collection planning, analytical tradecraft, and reporting workflows. OpenCTI becomes the platform where those workflows execute — the field manual tells you what to do, OpenCTI tells you where to do it.
CTI as a Code — Template-driven CTI methodology with scaffolded actor profiles and investigation templates. These templates map directly to the STIX objects OpenCTI manages. A CTI-as-Code actor profile can be serialized to STIX and imported into OpenCTI — or an OpenCTI actor profile can be exported and converted into a CTI-as-Code analysis artifact.
Israel Threat Actors CTI — 22 structured actor profiles covering Iranian, Palestinian, and Israeli-nexus threat actors. These profiles represent exactly the kind of intelligence that should live in OpenCTI's threat actor registry. Actors like MuddyWater (Iranian APT targeting Israeli infrastructure), WIRTE (Hamas-linked), and Handala have structured profiles that translate cleanly to STIX ThreatActor objects.
Operation Desert Hydra — A full end-to-end CTI investigation case study. The investigation methodology demonstrated there — pivoting from IOCs to infrastructure to actor attribution — is exactly what the OpenCTI investigation workflow automates at scale.
Customer-Driven AI CTI — Responsible AI integration in intelligence workflows. Covers the confidence and validation requirements for AI-extracted intelligence — directly applicable to how you should treat Claude connector output before using it in operational decisions.
AI vs Defense — Research on offensive and defensive AI capabilities. The threat landscape OpenCTI monitors is increasingly shaped by AI-assisted attacks — understanding that landscape informs what you configure OpenCTI to watch for.
TAXII integration — OpenCTI's built-in TAXII server can feed curated indicator collections to downstream consumers: Palo Alto NGFW, Fortinet FortiGate, Microsoft Sentinel, Splunk ES. This closes the loop from intelligence to detection — the workflow the CTI Analyst Field Manual documents as CTI-to-detection.
What's Next
A deployed OpenCTI instance is a starting point, not a finished product. The platform's value grows as you:
-
Tune extraction prompts — The Claude connector's initial extraction quality depends on your prompt. Refine the prompt based on the reports you actually receive. Add sector-specific entity types if you're in a specialized domain.
-
Build custom dashboards — OpenCTI's dashboard system is fully customizable. Build analyst-specific views: a "new IOCs this week" dashboard, a "most targeted sectors" heatmap, an "active campaigns" summary.
-
Connect to detection engineering — Export indicator collections via TAXII to your SIEM. Build detection rules that reference OpenCTI actor and campaign context. When a SIEM alert fires, the analyst should immediately know whether it matches a tracked threat.
-
Establish regular review cycles — Set a weekly cadence to review connector health, prune stale indicators past their expiry date, and update actor profiles with new reporting. Platform quality degrades without maintenance.
-
Integrate with incident response — Train the SOC to open OpenCTI as the first step in any investigation. IOC → OpenCTI → actor context → response prioritization.
The Medium article that this guide is based on covers additional operational details and real-world lessons from running this stack in a production CTI program.
Part of the 1200KM.COM CTI practitioner ecosystem. See all projects at the main page.